June 5, 2026
When Geography Becomes a Weapon: The Strait of Hormuz and the Logic of Supply Disruption
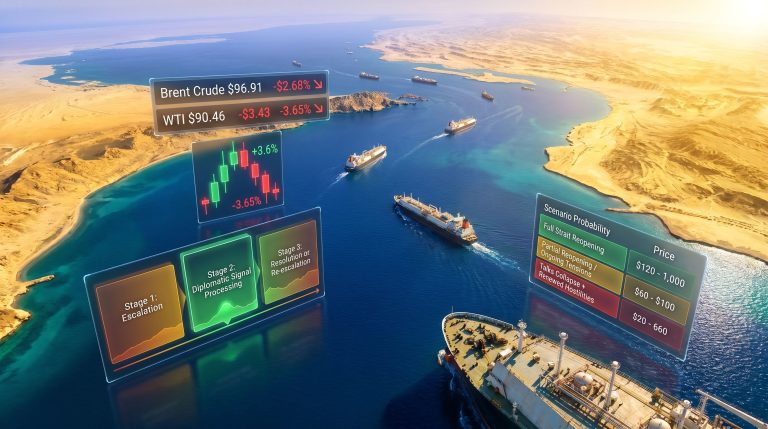
Every few decades, the global oil market is forced to confront a fundamental truth: the physical geography of energy infrastructure is itself a form of leverage. Chokepoints, transit corridors, and port access are not neutral logistics features. They are strategic assets whose disruption can reshape commodity markets within weeks. The current situation unfolding across the Persian Gulf represents one of the most concentrated supply-side stress events in modern energy history, one that demands analysis not merely as a geopolitical news item, but as a systems-level stress test for global oil market architecture.
When big ASX news breaks, our subscribers know first
The Mechanics of an Export Collapse: How Iranian Oil Flows Were Severed
Understanding why Iranian oil exports fall to lowest level in six years requires examining two distinct but reinforcing mechanisms operating simultaneously.
The first mechanism is the formal naval blockade, which the United States began enforcing on April 13, 2026. Unlike financial sanctions, which operate through banking exclusion and trade counterparty risk, a physical blockade introduces a kinetic dimension that fundamentally alters the risk calculus for every participant in the supply chain. Vessel operators face not just financial penalty exposure but direct security risk to crews and assets.
The second mechanism is what shipping analysts describe as a market-driven amplification effect. Even where formal enforcement has gaps, the collective withdrawal of marine insurance coverage, the risk aversion of vessel operators, and the counterparty exposure concerns of trade finance institutions combine to create a de facto secondary blockade. This soft enforcement layer can sustain disruption even when official posture fluctuates, because insurance markets and risk models reprice slowly and conservatively.
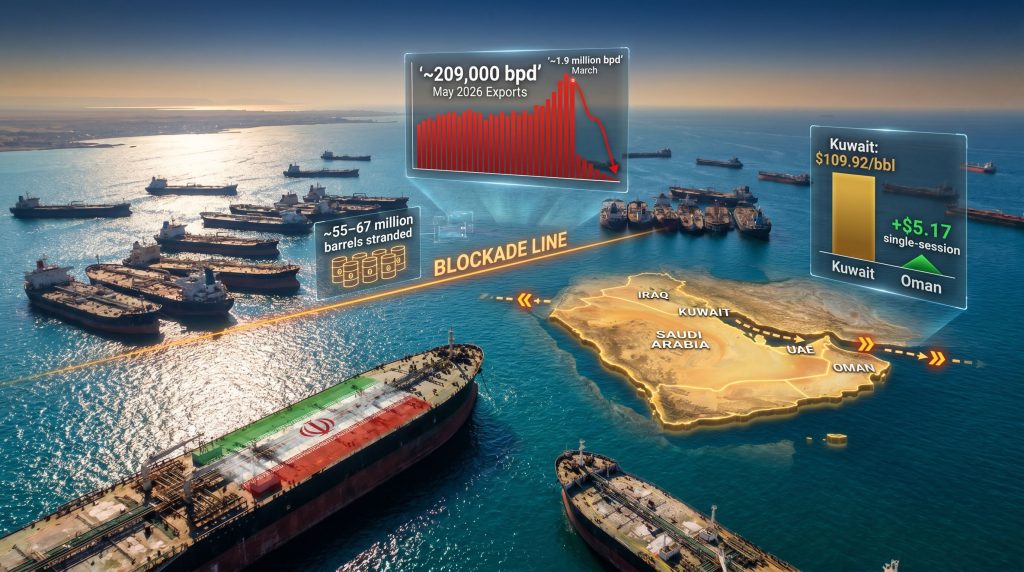
The result of these combined forces was a collapse in Iranian crude and condensate exports of extraordinary speed and scale. Furthermore, shipping data from Vortexa places May 2026 export volumes at approximately 209,000 barrels per day (bpd), while Kpler's dataset, using slightly different vessel tracking methodology, estimated 260,000 bpd. Both figures represent six-year lows.
Iran's Export Trajectory: March to May 2026
| Period | Estimated Export Volume | Primary Driver |
|---|---|---|
| March 2026 | ~1.9 million bpd | Pre-blockade operational peak |
| April 2026 | ~1.34 million bpd | Blockade initiation (April 13) |
| May 2026 | ~209,000–260,000 bpd | Full blockade and insurance withdrawal |
| Early 2024 | ~1.56 million bpd | Post-sanctions rebound high |
| Late 2019–Early 2020 | Comparable to May 2026 | Trump-era maximum pressure campaign |
| 2012 | Lowest since 1986 | JCPOA-era sanctions tightening |
The contraction from roughly 1.9 million bpd in March to approximately 209,000 bpd in May represents a volumetric decline of close to 89% across just two months, placing this episode among the most rapid export compression events recorded in the modern oil market era.
Beyond Iran: Why the Strait of Hormuz Closure Creates a Multi-Producer Crisis
A critical dimension of the current disruption that is frequently underweighted in market analysis is that the supply shock extends well beyond Iranian barrels alone. Iran's effective closure of the Strait of Hormuz has simultaneously constrained export flows from multiple Gulf producers whose outbound shipping infrastructure routes through the same corridor. Consequently, the broader implications for trade and geopolitics cannot be overstated.
Under normal operating conditions, approximately 20 to 21% of global seaborne oil trade transits the Strait of Hormuz. The producers dependent on this passage for export access include Saudi Arabia, Kuwait, Iraq, and the United Arab Emirates. This transforms what might otherwise be characterised as a bilateral enforcement action into a multi-producer supply disruption with systemic implications for global oil market balances.
Regional price benchmarks reflect this systemic pressure directly. Kuwait's crude oil benchmark rose to approximately $109.92 per barrel during the disruption period, while Oman's export grade recorded a $5.17 per barrel single-session price increase, according to data reported via Zawya. Saudi Arabia's energy minister publicly reaffirmed the kingdom's position as a reliable energy supplier under all circumstances, signalling that Riyadh views the current disruption as an opportunity to demonstrate supply dependability rather than exploit short-term price gains.
Separately, Kuwait Petroleum Corporation executives indicated that Kuwait could restore approximately 70% of its oil output within six to eight weeks of any Hormuz reopening, providing a useful benchmark for how quickly regional supply could recover once the physical constraint is removed.
The Floating Storage Equation: 147 Million Barrels in Limbo
One of the less widely understood dimensions of the current crisis is the role of floating storage as both a geopolitical indicator and a supply pipeline with a finite life. When export routes are blocked but production continues or recently loaded cargoes cannot reach buyers, crude oil accumulates on tankers at sea. Tracking this inventory provides a real-time gauge of how much Iranian supply remains potentially deliverable versus effectively stranded.
Iranian crude and condensate held in floating storage reached a peak of approximately 190 million barrels in late April 2026, before declining to roughly 147 million barrels as the May data was compiled. The decline reflects tankers successfully discharging cargoes primarily in China, but this discharge pipeline has a natural endpoint.
Where Iranian Floating Storage Is Located
| Storage Location | Estimated Volume |
|---|---|
| Inside Mideast Gulf and Gulf of Oman (Kpler) | ~67 million barrels |
| Behind the blockade line (FGE NexantECA) | ~55 million barrels |
| In transit or discharging in China | Remainder of ~147 million barrels total |
The approximately 55 to 67 million barrels estimated to be physically stranded behind the blockade line represents the most constrained portion of this inventory. These barrels cannot reach buyers regardless of commercial arrangements until the physical enforcement situation changes.
According to analyst modelling reported by Reuters, if the blockade remains in place for approximately two additional months, Iran could exhaust the oil inventory it is able to deliver to China, its primary buyer. This is not a capacity problem rooted in depleted reserves but a flow constraint imposed by physical and logistical interdiction.
China's Import Dilemma: Structural Dependency Meets Supply Shock
China has served as the dominant and in many periods near-exclusive destination for Iranian crude exports, attracted by the significant price discounts that sanctioned Iranian barrels have historically carried relative to market benchmarks. This relationship has created a deep structural dependency in China's refining sector, particularly among independent refiners known as teapots, which have built processing economics around access to discounted feedstock.
In May 2026, Chinese imports of Iranian crude declined to approximately 1.10 million bpd, the lowest monthly figure since January 2025, according to Kpler data. This contraction reflects both the physical unavailability of Iranian barrels and the logistical complications facing tanker operators in the current security environment.
China's Supply Substitution Challenge: Three Scenarios
Scenario A: Short-Duration Disruption (Under 60 Days)
- China draws down strategic petroleum reserves while redirecting purchases toward Russia, West Africa, and Brazil
- Iranian floating storage continues discharging gradually, partially offsetting the shortfall
- Chinese refinery throughput adjustments are modest; price impact is manageable
Scenario B: Extended Blockade (60 to 120 Days)
- Iranian inventory behind the blockade line becomes effectively inaccessible to Chinese buyers
- China faces a structural shortfall requiring accelerated alternative sourcing at premium prices
- Independent teapot refiners, which lack the supply diversification of state-owned enterprises, face the sharpest margin compression
- Downstream product price inflation becomes visible in consumer markets
Scenario C: Prolonged Standoff (Beyond 120 Days)
- Iran effectively exhausts the oil it can deliver to Chinese buyers given current blockade constraints
- China's annual crude import mix undergoes significant structural rebalancing away from Iranian supply
- Geopolitical pressure on Beijing to facilitate a diplomatic resolution intensifies
What makes Scenario C particularly significant is the timeline compression involved. However, unlike most supply disruptions, where months of inventory buffer absorb the initial shock, the floating storage dynamic here means the available pipeline is both visible and finite.
Historical Cycles and the Elasticity of Iranian Export Recovery
Context from previous enforcement cycles reveals an important counterbalancing insight: Iranian export volumes have demonstrated remarkable elasticity on the recovery side. Each prior period of severe enforcement has been followed by a rebound once pressure eased. In addition, understanding OPEC market influence during these cycles helps frame the broader structural context.
Comparing Major Iranian Export Enforcement Episodes
| Enforcement Period | Export Level Reached | Primary Mechanism |
|---|---|---|
| 2012 sanctions cycle | Lowest since 1986 | Financial sanctions, banking exclusion |
| 2019–2020 maximum pressure | Near-zero | Waivers withdrawn, secondary sanctions |
| 2024 rebound | ~1.56 million bpd | Enforcement gaps, sustained China demand |
| May 2026 | ~209,000–260,000 bpd | Naval blockade plus sanctions plus security risk |
The 2024 rebound to 1.56 million bpd from near-zero levels in 2020 is the most instructive precedent. It confirms that Iran's upstream production infrastructure remains largely intact across enforcement cycles. The disruption is consistently a flow problem, not a permanent capacity loss. Iranian fields continue producing; the constraint is imposed externally on the movement of barrels, not on the extraction of oil from the ground.
The critical distinction between the 2026 situation and all prior episodes is the addition of a physical naval enforcement mechanism. Financial sanctions create incentive structures and counterparty risks, but they have historically been permeable through grey market channels involving flag-of-convenience vessels, opaque ownership structures, and compliant intermediary jurisdictions. A naval blockade forecloses many of those workarounds by introducing direct physical risk to vessels and crews. The oil sanctions impact seen in comparable enforcement contexts confirms how rapidly these dynamics can reshape trade flows.
The next major ASX story will hit our subscribers first
Supply Chain Risk: The Insurance Market as an Invisible Enforcement Layer
One dimension of the current disruption that rarely receives adequate analytical attention is the role of the marine insurance market as an amplification mechanism. The withdrawal of war risk and hull insurance coverage from Iranian trade routes functions as a force multiplier for the official enforcement posture.
Vessel owners and operators who might otherwise be willing to accept financial sanction risk calculate the marine insurance dimension differently. Without coverage, a single vessel loss in a contested security environment carries catastrophic financial consequences for the operating entity. This dynamic means that the effective enforcement perimeter extends beyond the physical naval presence to encompass every port, terminal, and transit corridor where counterparties assess unacceptable risk exposure.
Shipping analysts have noted that this soft enforcement architecture can persist even after formal military posture changes, because insurance markets and risk committees apply conservative lag effects when repricing threats downward. Furthermore, any diplomatic resolution would need to be sustained and credible before vessel operators resume normal service patterns to Iranian ports.
Three Pathways Forward: Resolution, Stalemate, or Escalation
Pathway 1: Diplomatic Resolution Within 60 Days
A negotiated framework produces blockade withdrawal; Iranian floating storage discharges rapidly over 30 to 45 days following resolution; global oil prices moderate as supply concerns ease.
Pathway 2: Prolonged Standoff With Partial Workarounds
Enforcement gaps allow limited tanker movements; Iranian exports stabilise in the 300,000 to 500,000 bpd range through alternative routing; China accelerates diversification of crude sourcing mix. This pathway also represents a significant oil market disruption for downstream buyers across Asia.
Pathway 3: Escalation and Extended Closure
The Strait of Hormuz remains closed for an extended period; Iranian exports approach zero; global oil markets face a structural deficit requiring an emergency production response from OPEC+ members with spare capacity; oil prices test levels not seen since the 2022 post-Ukraine energy shock.
The speed of any eventual recovery in Iranian export volumes is likely to be faster than most market participants assume. Historical precedent consistently shows that once the enforcement pressure eases, Iranian exports rebound within weeks rather than months, reflecting a production infrastructure that has survived repeated cycles of disruption and recovery largely intact.
Disclaimer: This article is for informational purposes only and does not constitute financial or investment advice. The scenario projections, supply estimates, and price references included are drawn from third-party analyst data and publicly available reporting, including Reuters and Zawya Energy, and are subject to change as geopolitical conditions evolve. Readers should conduct their own research before making investment decisions.
Want to Stay Ahead of Commodity Supply Shocks Before They Move Markets?
Discovery Alert's proprietary Discovery IQ model delivers real-time alerts on significant ASX mineral discoveries, transforming complex commodity data into actionable investment insights the moment they hit the exchange — explore historic discoveries and their market returns to understand the scale of opportunity, then begin your 14-day free trial at Discovery Alert to position yourself ahead of the broader market.