
June 12, 2026
The Hidden Geography of Commodity Vulnerability
When geopolitical shocks hit global markets, the instinctive response from traders and analysts alike is to assume widespread contagion across commodity classes. History suggests this instinct is often correct. Energy markets seize up, metals swing violently, and freight costs spiral. Yet the current conflict involving Iran has exposed something more nuanced: commodity vulnerability is not uniform, and the determining factor is often not the scale of a conflict but the geography of trade routes.
Iron ore unaffected by Iran war conditions is not an accident of timing or market sentiment. It is a structural outcome rooted in shipping geography, bilateral trade architecture, and the physical characteristics of the ore itself. Understanding why requires looking beyond headline price moves and into the mechanics of how raw materials actually move around the planet.
When big ASX news breaks, our subscribers know first
Why Iron Ore Has Largely Sidestepped the Conflict
The Strait of Hormuz and the Commodities It Controls
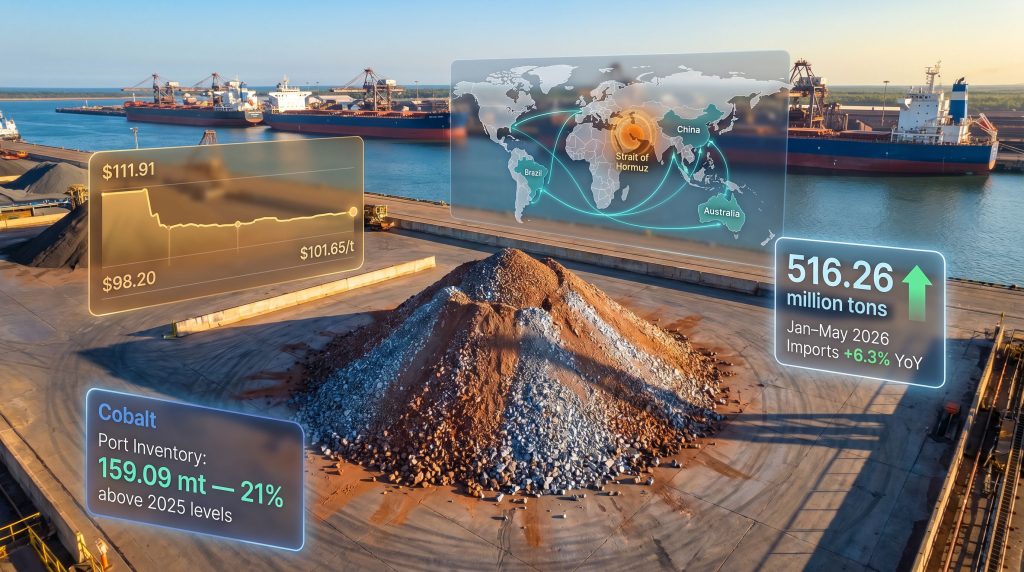
The Strait of Hormuz, a waterway roughly 33 kilometres wide at its narrowest navigable channel between Iran and Oman, carries an outsized share of the world's energy trade. Estimates suggest it handles approximately 20% of global oil trade and a significant portion of liquefied natural gas exports from Gulf producers. When the US-Israeli aerial campaign against Iran began on February 28, 2026, the effective closure of this passage to commercial vessels immediately disrupted crude oil, LNG, and coal flows for buyers dependent on Gulf-origin supply.
The commodity table below illustrates how different raw materials have responded since the conflict began:
| Commodity | Hormuz Exposure | Price Impact (Feb-Jun 2026) | Primary Disruption Type |
|---|---|---|---|
| Crude Oil | Very High | Significant volatility | Supply route closure |
| LNG | High | Significant volatility | Transit disruption |
| Aluminum (Gulf) | High | Output decline to decade lows | Energy input disruption |
| Coal | Moderate | Elevated | Freight rerouting |
| Copper | Moderate | Elevated | Sentiment and logistics |
| Iron Ore | Low (direct) | Narrow range (~$14/t) | Freight and insurance inflation |
Iron ore's exposure category sits in a fundamentally different column from its commodity peers. Australia and Brazil, the two dominant suppliers accounting for the overwhelming majority of China's iron ore intake, export their product along Indian Ocean and South Pacific shipping corridors. These routes have no meaningful intersection with the Persian Gulf or the Strait of Hormuz under standard routing conditions. Consequently, the iron ore trade disruptions that have rattled other commodity classes have largely bypassed this particular supply chain.
The Singapore Futures Market Tells Its Own Story
Singapore Exchange iron ore futures have traded within a $14 per metric ton range for most of 2026, oscillating around the $105 per ton anchor level. The low for the year came in at $98.20 per ton on February 20, just before the conflict began, and the year-to-date high reached $111.91 per ton on May 11 before moderating to $101.65 per ton by June 10, 2026.
For context, a $14 range in a commodity sitting near $105 represents a roughly 13% peak-to-trough swing. In the same period, energy commodities experienced far more violent moves. That kind of calm is not typical for a major industrial commodity during active regional conflict, and it reflects genuine structural insulation rather than market complacency. Iron ore remains unaffected by the war's most severe price contagion, a fact that continues to baffle some market observers.
The conflict's impact on iron ore is best described as a cost-push disruption rather than a supply-destruction event. Logistics are becoming more expensive, but the ore itself keeps moving.
The temporary spike toward $111.91 during April and May appears to have been driven primarily by anxiety around marine bunker fuel availability, not by any actual interruption to iron ore supply. As fears of imminent fuel shortages moderated, prices retreated accordingly.
China's Iron Ore Architecture: Why the Numbers Are More Complicated Than They Appear
The Scale of China's Market Position
China's role in seaborne iron ore markets is without parallel in any commodity class. The country purchases approximately 75% of all globally traded seaborne iron ore, feeding steel mills that collectively produce just over half of the world's total steel output. The iron ore demand outlook for the primary import sources — Australia and Brazil — therefore carries outsized consequences for global pricing.
This concentration creates a paradox. On one hand, the bilateral nature of the trade flow means any disruption to Australian or Brazilian output carries outsized consequences for global iron ore pricing. On the other hand, the geographic routing of this trade is remarkably robust to Middle Eastern geopolitical disruption precisely because neither Australia nor Brazil ships product through Gulf waters.
The January to May 2026 Import Picture
Official Chinese customs data recorded 516.26 million tons of iron ore imports across the first five months of 2026, representing a 6.3% increase year-on-year. That headline figure suggests healthy demand growth and appears to validate the narrative of iron ore sailing calmly through the conflict period.
However, the May data introduced a complication worth examining closely.
Decoding China's Confusing May 2026 Import Data
The 8-Million-Ton Discrepancy
Official Chinese customs figures put May 2026 iron ore imports at 97.71 million tons, down 6% from April and the lowest monthly reading in three months. That would normally be read as a bearish demand signal.
The problem is that independent vessel tracking services told a very different story:
- DBX Commodities tracked seaborne iron ore imports into China at 105.56 million tons for May
- Kpler estimated arrivals at 106.4 million tons for the same month
- The implied gap between official data and independent estimates: approximately 8 million tons
An 8-million-ton discrepancy between customs data and independent vessel tracking is statistically unusual for a single reporting month. The most likely explanation is a cargo assessment timing shift — vessels arriving in the final days of May may have been formally logged under June's customs period, creating an artificial trough in May's official figures.
This is a phenomenon that experienced iron ore market participants recognise as a recurring feature of Chinese customs reporting. End-of-month cargo assessments can create artificial dips and rebounds across consecutive monthly data releases, particularly when large bulk carriers arrive in port during the final 72 hours of a reporting period. Furthermore, the China iron ore surplus narrative has complicated how analysts are interpreting these statistical anomalies.
How to Identify Customs Reporting Lags in Iron Ore Data
For analysts and investors tracking Chinese iron ore demand, the following methodology helps filter genuine demand signals from statistical noise:
- Compare official customs monthly totals against real-time vessel tracking data from services such as Kpler or DBX Commodities
- Flag months where the divergence exceeds 3 to 5 million tons as candidates for reporting lag distortion
- Check whether the discrepancy reverses in the following month's official customs release
- Apply a rolling three-month smoothing methodology to demand models to absorb end-of-period timing effects
- Avoid drawing structural demand conclusions from a single month's official figure without corroboration from tracking data
The implication for June 2026 data is clear: a statistical rebound in official imports is probable, and analysts who interpreted May's 97.71 million ton reading as evidence of weakening demand may be revisiting their models.
The Deeper Tension: Rising Imports, Falling Steel Output
A Structural Contradiction
Even adjusting for the May reporting anomaly, there is a genuine puzzle in China's iron ore market data. Chinese steel output fell 4.1% year-on-year in the first four months of 2026, totalling 331.12 million tons. Yet iron ore imports grew 6.3% over a similar period. A raw material flowing in faster than the finished product flows out is a structural signal worth examining carefully. The complexities surrounding China steel and iron ore dynamics make this divergence particularly significant.
Chinese Iron Ore Market Indicators (2026 YTD)
| Indicator | Value | Year-on-Year Change |
|---|---|---|
| Jan-May 2026 imports | 516.26 million tons | +6.3% |
| May 2026 imports (official customs) | 97.71 million tons | -6% vs April |
| May 2026 imports (Kpler estimate) | 106.4 million tons | Not directly comparable |
| Port inventory peak (March 13) | 166.91 million tons | Record high |
| Port inventory (June 5) | 159.09 million tons | +21% vs same week 2025 |
| Steel output (Jan-Apr 2026) | 331.12 million tons | -4.1% |
| Domestic ore output (Jan-Apr 2026) | 326.8 million tons | -1.0% |
Three distinct mechanisms explain this divergence.
Mechanism 1: Port Inventory Accumulation
Chinese port iron ore stockpiles surged to a record high of 166.91 million tons in the week ending March 13, 2026. While stocks have since drawn down to 159.09 million tons by the week ending June 5, they remain 21% above the equivalent 2025 comparison week, when inventories stood at 132.0 million tons according to SteelHome data.
Mills and traders were clearly importing ahead of immediate consumption requirements, building buffer stock during a period of logistical uncertainty. Whether this represented rational precautionary behaviour or over-stocking that will now depress future purchasing activity is the central question facing iron ore price forecasters.
Mechanism 2: The Declining Quality of Chinese Domestic Iron Ore
This is perhaps the most structurally significant and least widely appreciated factor driving China's import dependency. Chinese domestic iron ore averages only 20 to 30% iron content, compared to the 60 to 65% iron grades typical of Australian and Brazilian seaborne supply.
The gap in grade quality is not merely an academic measurement. Processing low-grade domestic ore to steelmaking specifications requires energy-intensive beneficiation, including multiple stages of crushing, grinding, magnetic separation, and pelletising. The cost and carbon intensity of this process makes high-grade imported ore economically superior even when domestic supply is technically available.
The volume trajectory reinforces this quality concern:
- Domestic iron ore production totalled 326.8 million tons in January to April 2026, down 1% year-on-year according to MySteel data
- Full-year 2025 domestic output fell 2.8% to 983.7 million tons, down from 1.04 billion tons in 2024
- The multi-year declining trend in domestic production, combined with deteriorating average grades, structurally anchors Chinese demand for high-grade seaborne imports regardless of steel demand cycles
Mechanism 3: Precautionary Stockpiling Ahead of Logistics Uncertainty
During the early phase of the Iran conflict, uncertainty around bunker fuel availability and marine insurance costs incentivised buying behaviour that front-loaded purchases beyond immediate mill requirements. Even if those logistical fears did not fully materialise into sustained disruptions, the inventory accumulation they triggered has already occurred and now sits as an overhang on the market. In addition, the broader China iron ore outlook suggests this precautionary behaviour may persist well into the second half of 2026.
Forward Scenarios for Iron Ore Pricing
Scenario 1: Conflict Escalation and Prolonged Hormuz Closure
Sustained freight and insurance cost inflation would narrow mill margins and place structural stress on pellet and direct reduced iron supply chains. Chinese buyers might accelerate stockpiling further, providing short-term price support, but the 21% inventory overhang already on hand limits the upside. Price range implication: $110 to $115 per ton under genuine logistics shock conditions.
Scenario 2: Conflict De-escalation and Route Normalisation
Bunker fuel premiums compress, freight costs retreat, and the focus shifts back to China's steel demand fundamentals. With port inventories running 21% above prior-year levels, any demand recovery would need to absorb existing stock before meaningful price support materialises. Price range implication: consolidation in the $95 to $105 per ton band.
Scenario 3: Chinese Steel Demand Recovery Overrides Geopolitical Noise
Infrastructure stimulus or property sector stabilisation reignites Chinese steel consumption. Inventory drawdown accelerates, import volumes sustain above 100 million tons per month, and the structural story of declining domestic ore quality reinforces import dependency. Price range implication: gradual recovery toward $110 to $120 per ton across the second half of 2026. For a broader perspective on iron ore pricing dynamics, analyst commentary from the early months of 2026 remains instructive.
Investor Consideration: The most consequential variable for iron ore pricing over the next 12 months is not the Iran conflict itself. It is whether Chinese steel demand recovers sufficiently to absorb the 21% inventory surplus currently sitting at Chinese ports.
The scenarios above represent analytical projections based on current market conditions. They are not financial advice, and actual price outcomes may differ materially from any range discussed here.
The next major ASX story will hit our subscribers first
FAQ: Iron Ore, the Iran War, and China's Steel Market
Why has iron ore remained largely unaffected by the Iran war?
Iron ore unaffected by Iran war routing is a structural outcome. Trade between Australia, Brazil, and China routes through the Indian Ocean and South Pacific, bypassing the Strait of Hormuz entirely. The primary conflict disruption point has been that strait, which handles energy and Gulf metals trade but carries no meaningful volume of Chinese iron ore imports under standard shipping conditions.
What explains the gap between Chinese customs data and vessel tracking estimates for May?
End-of-month cargo assessment timing can cause vessels arriving in the final days of a reporting month to be logged in the following month's official customs data. The approximately 8 million ton gap between official figures and independent estimates for May 2026 is consistent with this phenomenon and suggests a statistical rebound in June's official release is probable.
Why are Chinese port stockpiles at record levels if steel output is contracting?
A combination of precautionary buying during the conflict's early phase, declining domestic ore quality driving structural import preference, and weaker-than-expected steel consumption has resulted in raw material accumulating at ports faster than mills can process it. The 21% year-on-year stockpile surplus is now the key variable constraining any near-term price recovery.
How does the grade difference between Chinese domestic ore and imported ore affect market dynamics?
With domestic ore averaging 20 to 30% iron content versus 60 to 65% for Australian and Brazilian imports, Chinese mills face a significant processing cost disadvantage when relying on domestic supply. As domestic mine output continues its multi-year decline and average grades deteriorate further, the economic case for imported high-grade ore strengthens independently of cyclical demand conditions.
What would a full de-escalation of the Iran conflict mean for iron ore?
Route normalisation would relieve freight and insurance cost pressures but would not immediately resolve the underlying demand-inventory imbalance in China. The price impact of de-escalation on iron ore is likely to be more modest than on energy commodities, given that iron ore's main challenge is the domestic steel demand environment rather than supply-side logistics.
Want to Stay Ahead of the Next Major ASX Mineral Discovery?
While iron ore navigates geopolitical headwinds and inventory overhangs, Discovery Alert's proprietary Discovery IQ model scans ASX announcements in real time, instantly identifying significant mineral discoveries across 30+ commodities and delivering actionable alerts to subscribers before the broader market catches on — explore historic discovery returns or start your 14-day free trial today.