July 31, 2026
The Hidden Economics of Iron Ore Quality: Why Silica Pricing Accuracy Defines Steelmaking Profitability
Commodity pricing has never been a simple matter of supply and demand. In the iron ore market specifically, the chemical composition of each cargo can shift its commercial value by tens of millions of dollars before a single tonne reaches a blast furnace. At the centre of this complexity sits silica, a seemingly unremarkable impurity that carries outsized financial consequences across the entire steelmaking supply chain.
Understanding how the iron ore silica value-in-use pricing notice mechanism works, and why methodology refinements matter, requires stepping back from price headlines and into the operational reality of steelmaking economics. Furthermore, monitoring iron ore price trends helps contextualise why chemical quality commands such significant commercial attention.
When big ASX news breaks, our subscribers know first
What Value-in-Use Actually Measures and Why It Matters
Most commodity benchmarks focus on a single primary quality metric. In iron ore, that has historically meant iron content expressed as a percentage of dry weight. However, experienced procurement teams and blast furnace operators have long understood that iron grade alone tells only part of the story.
Value-in-use, or VIU, is the framework that fills that gap. It translates the economic burden of chemical impurities into a price differential expressed in dollars per dry metric tonne ($/dmt). Rather than applying fixed penalty tables derived from historical conventions, regression-based VIU methodology dynamically captures how the market is actually pricing impurities in real-time transactions, reflecting genuine steelmaking cost impacts rather than arbitrary deductions.
Silica, or SiO₂, is among the most commercially significant of these impurities. Its presence directly determines:
- The volume of limestone and dolomite required to achieve slag basicity targets in the blast furnace
- Total slag output per tonne of hot metal produced, which determines furnace throughput capacity
- Coke consumption rates needed to maintain thermal balance as slag volumes increase
- Overall productivity, with industry-standard estimates placing the productivity penalty at roughly 1 to 2 percent per additional percentage point of silica above specification
For a large integrated steelworks processing 10,000 tonnes of iron ore fines per day, a one-percentage-point increase in silica content can accumulate into hundreds of thousands of dollars in additional annual operating costs. This is why the iron ore silica value-in-use pricing notice and its underlying methodology carry genuine commercial weight, not just academic interest.
The Structural Break at 6.5% Silica: A Market Divide Most Outsiders Miss
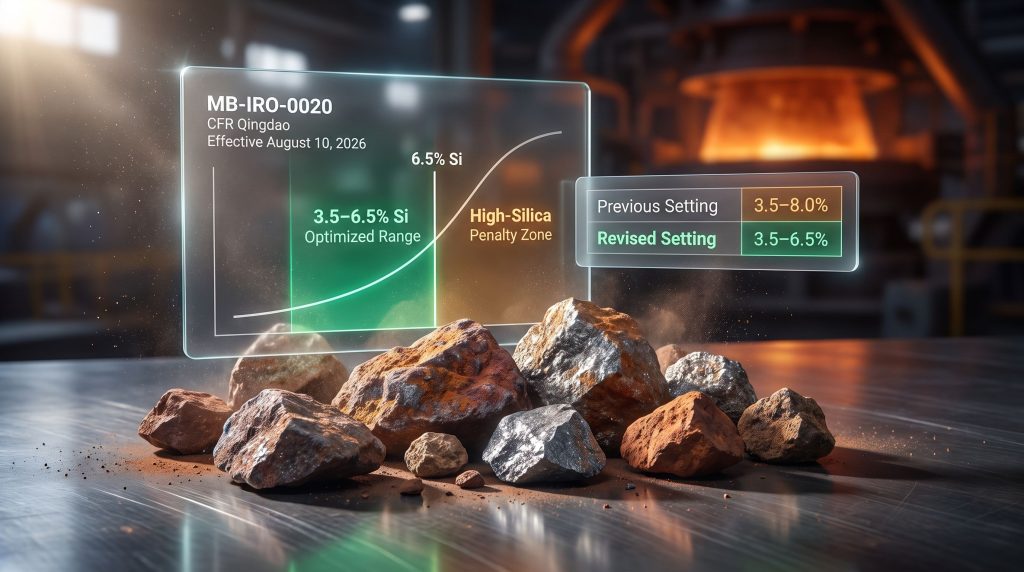
One of the least-discussed dynamics in iron ore trading is the structural pricing discontinuity that has emerged around the 6.5% Si threshold. Within the mid-grade fines segment spanning 60 to 63% Fe, market participants have increasingly observed that iron ore with silica content above this level is not simply penalised more steeply — it is effectively priced under a different commercial framework altogether.
This bifurcation reflects operational realities at the blast furnace level. Below 6.5% Si, cargoes can typically be blended into standard sintering plant feed without requiring significant operational adjustments. Above this level, slag management challenges escalate non-linearly, creating a materially different risk profile for the buyer. The practical result is that buyers apply different discount structures and liquidity thins considerably.
The following table illustrates how silica concentration maps to market behaviour:
| Silica Range | Market Characterisation | Pricing Behaviour |
|---|---|---|
| Below 3.5% Si | Ultra-low silica premium zone | Positive differential, premium over benchmark |
| 3.5% to 6.5% Si | Core liquid trading band | Most representative, active price discovery |
| 6.5% to 8.0% Si | High-silica penalty zone | Steeper discount, reduced transaction frequency |
| Above 8.0% Si | Blending/specialist grade | Limited price discovery, thin liquidity |
Including high-silica data points above 6.5% in a regression model designed to capture the liquid mid-grade market introduces statistical distortion. Consequently, the regression output gets pulled toward pricing behaviour that applies to a smaller, less representative subset of transactions, reducing the index's reliability for the vast majority of market participants.
The August 2026 Specification Change: What Happened and Why
Fastmarkets, one of the leading price reporting agencies (PRAs) operating in metals and mining markets, announced a formal update to the iron ore silica value-in-use pricing notice covering its MB-IRO-0020 assessment on July 31, 2026. The change, effective August 10, 2026, narrows the optimised silica range from 3.5 to 8.0% to 3.5 to 6.5% for the iron ore fines, % Si VIU, CFR Qingdao, $/dmt assessment.
The revision followed a structured consultation period that closed on July 24, 2026. Market feedback during that process consistently identified that cargoes above the 6.5% Si threshold were being priced under different discount logic. Furthermore, including them within the same optimised range was reducing the assessment's representativeness for the most actively traded segment of the mid-grade fines market.
The implementation date was moved from the originally proposed August 3 to August 10, not due to any technical issue, but to satisfy minimum public notice timeline requirements under Fastmarkets' methodology governance framework. This adjustment carries no consequence for the index's calculation, historical data, or published values.
The full specification comparison is shown below:
| Parameter | Previous Specification | Revised Specification (August 10, 2026) |
|---|---|---|
| Price Code | MB-IRO-0020 | MB-IRO-0020 (unchanged) |
| Assessment Basis | % Si VIU, CFR Qingdao | % Si VIU, CFR Qingdao (unchanged) |
| Fe Range | 60 to 63% Fe | 60 to 63% Fe (unchanged) |
| Optimised Silica Range | 3.5 to 8.0% | 3.5 to 6.5% |
| Data History | December 2013 | December 2013 (unchanged) |
| Calculation Methodology | Regression-based | Regression-based (unchanged) |
Key insight: This change is not a recalculation of historical data. All values published under MB-IRO-0020 since December 2013 remain intact. The revision applies prospectively and affects only the boundaries of the regression input dataset used in future daily assessments.
How the Regression Methodology Translates Market Data into a Price Signal
The mechanics behind the iron ore silica value-in-use pricing notice are rarely explained in plain terms outside specialist circles. The following breakdown demystifies the process:
- Transaction data collection: Price inputs and chemical assay data, including Fe%, Si%, Al₂O₃%, and other impurity levels, are gathered from observed market transactions within the defined iron content band of 60 to 63% Fe.
- Regression modelling: A statistical regression is run across the collected dataset to isolate the marginal price impact attributable specifically to silica variation, controlling for other variables.
- Differential derivation: The regression output is expressed as a $/dmt adjustment per percentage point of silica deviation from a defined reference specification.
- Optimised range application: Only data points falling within the optimised silica range, now narrowed to 3.5 to 6.5%, are included in the regression. This confines the model to the most liquid and commercially representative transactions.
- Daily publication: The resulting differential is published on a CFR Qingdao basis in $/dmt, providing a daily benchmark for contract adjustments and market reference pricing.
Why regression beats fixed tables: Static penalty tables apply historical discount rates regardless of how current market conditions are evolving. Regression-based VIU models respond dynamically to live transaction data, meaning the published differential reflects what steel mills and traders are actually paying and accepting in the market today, not what they paid years ago.
Why Does This Methodology Matter for Global Iron Ore Markets?
The China steel and iron ore market remains the dominant driver of iron ore demand globally, and Chinese steel mills are the primary consumers of mid-grade fines assessed under frameworks like MB-IRO-0020. In addition, the accuracy of regression-based VIU assessments directly influences procurement decisions at the world's largest steelmaking operations.
Mid-Grade vs. High-Grade Silica VIU: Two Frameworks for Two Markets
A common source of confusion among participants less familiar with iron ore pricing is the existence of separate VIU frameworks for mid-grade and high-grade iron ore. These are not interchangeable, and the silica dynamics in each segment differ significantly.
| Dimension | Mid-Grade Silica VIU (MB-IRO-0020) | High-Grade Silica VIU |
|---|---|---|
| Fe Range | 60 to 63% Fe | 63 to 70% Fe |
| Optimised Si Range | 3.5 to 6.5% (post-August 10, 2026) | 1.0 to 8.5% (broader) |
| Primary Users | Mid-grade fines traders, sinter blenders | Pellet feed, DR-grade concentrate buyers |
| Steelmaking Route | Blast furnace / basic oxygen furnace | Direct reduction / electric arc furnace |
| Publication Basis | CFR Qingdao | CFR China |
The broader optimised range maintained for high-grade silica VIU reflects the different steelmaking pathways where these materials are consumed. Direct reduction (DR) grade and electric arc furnace (EAF) route materials face distinct silica tolerance thresholds. As decarbonisation pressures accelerate the global shift toward low-emission steelmaking, understanding the various iron ore types and deposits becomes increasingly important for participants navigating these diverging demand profiles.
The next major ASX story will hit our subscribers first
The Governance Architecture Behind PRA Methodology Changes
Price reporting agencies operate within a framework of transparency obligations that most commodity market participants interact with indirectly but rarely examine closely. For an iron ore silica value-in-use pricing notice to result in a methodology change, the following governance sequence must be completed:
- A formal consultation is published, inviting structured feedback from market participants across the supply chain
- A comment period runs, typically several weeks, during which traders, producers, steel mills, and financial institutions may submit responses on either a named or confidential basis
- Non-confidential submissions are made available upon request, reinforcing market transparency
- Following consultation closure, a formal pricing notice is issued specifying the effective date and exact nature of the specification change
- A minimum public notice window separates the announcement from implementation, which is why the August 10 date replaced the originally proposed August 3 date
This sequence is not bureaucratic formality. It protects the integrity of benchmarks that underpin billions of dollars in physical supply contracts and derivatives positions globally. Market participants whose contracts reference MB-IRO-0020 need adequate time to review how specification changes interact with their existing agreements.
The breadth of stakeholders who typically engage in these consultation processes reflects how widely iron ore VIU assessments are used:
- Major iron ore producers operating large-scale export operations in Australia and Brazil
- Chinese integrated steel mills and sintering plant procurement teams
- Commodity trading houses with iron ore physical and derivatives books
- Steel industry associations monitoring benchmark quality and representativeness
- Financial institutions using iron ore index-linked instruments for hedging and risk management
Commercial Implications Across the Iron Ore Supply Chain
The narrowing of the MB-IRO-0020 optimised silica range produces distinct practical considerations depending on where a participant sits in the market.
For Iron Ore Producers
- Cargoes with silica content in the 3.5 to 6.5% band will now be assessed against a tighter, more liquid reference, improving pricing transparency and index representativeness for typical mid-grade shipments
- Producers whose products consistently contain silica above 6.5% should anticipate that counterparties will reference the MB-IRO-0020 index with the understanding that their material falls outside the primary optimised range, which may influence contract negotiation dynamics
For Steel Mill Procurement Teams
- The revised assessment provides a cleaner, statistically more reliable benchmark for evaluating the relative value of mid-grade fines within the 3.5 to 6.5% Si window
- Procurement contracts that incorporate VIU adjustment clauses referencing MB-IRO-0020 should be reviewed to confirm alignment between the physical cargo specification and the revised index range
For Commodity Traders and Derivatives Users
- Reducing the optimised range removes statistical noise introduced by high-silica outliers in the regression, potentially improving the index's utility as a hedging reference for silica-sensitive cargo positions
- Traders structuring basis swaps or differential contracts linked to MB-IRO-0020 should assess whether the revised range better reflects the silica profile of their physical book
Lesser-Known Factors That Amplify Silica's Commercial Significance
Several dimensions of silica's role in iron ore pricing remain underappreciated outside specialist steelmaking and trading circles.
Gangue Mineralogy Beyond the Headline Number
The total silica percentage in an iron ore assay does not capture the full picture. The form in which silica appears — whether as free quartz or locked within complex silicate mineral structures — influences how it behaves in the sintering and ironmaking process. Free quartz is generally more reactive and carries higher flux penalties than silica bound in aluminosilicate phases, yet standard assay reporting does not distinguish between them.
Interaction Effects With Alumina
In practice, blast furnace operators assess silica and alumina (Al₂O₃) content together rather than in isolation. High combined gangue loads — meaning elevated totals of Si plus Al — create compounding slag management challenges that are more severe than either impurity alone. This interaction is why some procurement frameworks use composite gangue indices rather than individual impurity thresholds.
Geographic Silica Profiles and Deposit Geology
Different iron ore deposit types carry characteristic silica profiles. Itabirite deposits in Brazil typically deliver lower silica content at high iron grades, while certain Australian Marra Mamba and pisolite ore types carry naturally higher silica concentrations. Understanding deposit geology therefore provides producers and buyers with a structural lens for anticipating the silica distribution of future supply, independent of spot market pricing signals.
Furthermore, the China iron ore outlook and the accelerating transition toward green iron production are expected to reshape silica tolerance thresholds across steelmaking routes in the years ahead, reinforcing the importance of robust and representative VIU pricing frameworks.
Disclaimer: This article is intended for informational purposes only and does not constitute financial, investment, or trading advice. References to price levels, methodology changes, and market dynamics reflect publicly available information and general industry analysis. Readers should conduct independent due diligence before making commercial or investment decisions based on iron ore pricing indices.
Want to Stay Ahead of the Next Major ASX Mineral Discovery?
Discovery Alert's proprietary Discovery IQ model delivers real-time alerts on significant ASX mineral discoveries, translating complex commodity data across more than 30 resources into clear, actionable investment insights — explore the historic returns major discoveries have generated and begin your 14-day free trial today to position yourself ahead of the broader market.