July 8, 2026
Why Monthly Employment Figures Hold Such Power Over Precious Metals
Every first Friday of the month, a single data release triggers coordinated price movements across Treasury markets, currency exchanges, and commodity trading desks simultaneously. The cascade happens so reliably that professional traders position themselves before 8:30 a.m. ET in anticipation. Yet for most investors watching gold and silver react, the underlying logic connecting a labour statistic to a hard asset price remains opaque.
Understanding how the jobs report moves gold and silver requires moving past the surface-level observation that metals rise when employment disappoints. The real story is a multi-stage transmission system operating through monetary policy architecture, and once that architecture is understood, the monthly reaction pattern stops appearing random.
When big ASX news breaks, our subscribers know first
The Federal Reserve's Dual Mandate: The Foundation of the Entire System
The Federal Reserve operates under a congressional directive to pursue two simultaneous objectives: stable prices and maximum employment. This dual mandate is not incidental to the gold-silver-jobs relationship. It is the relationship.
Gold and silver do not respond to payroll figures because jobs directly alter the supply or demand for physical metal. They respond because employment conditions determine what the Federal Reserve is authorised to do with interest rates. Strong hiring gives the central bank political and economic cover to hold rates elevated or raise them further. Weak hiring removes that cover and opens the door to cuts or extended pauses.
This means monthly payroll data functions primarily as a policy permission signal. The employment situation report published by the U.S. Bureau of Labor Statistics tells the market how much monetary policy optionality the Fed retains, and precious metals pricing adjusts accordingly. Furthermore, central bank gold demand plays an increasingly important structural role in amplifying these policy-driven price moves.
What the Nonfarm Payrolls Report Actually Counts
The Bureau of Labor Statistics releases the Nonfarm Payrolls report on the first Friday of each month at 8:30 a.m. ET. The headline figure captures net job additions across all non-agricultural sectors during the prior calendar month. However, the headline number is deliberately narrower than the total labour market:
- Excluded: self-employed workers, agricultural sector employees, and involuntary part-time workers
- Included: formal payroll employment across private and government sectors outside agriculture
Beyond the headline, sophisticated market participants monitor three sub-components that frequently determine whether the headline is treated as strong or weak:
- Average hourly earnings — the wage inflation signal embedded in the report
- Prior-month revisions — adjustments to the preceding two months that can reverse the entire narrative of a given headline
- Unemployment rate — particularly the gap between the U-3 headline measure and the U-6 broader measure, which captures discouraged and underemployed workers
Analyst Note: Prior-month revisions are frequently the most market-moving element of any NFP release. A headline that reads as a solid beat can be completely neutralised when the BLS simultaneously revises the previous two months downward by a combined figure larger than the apparent surplus.
The Five-Stage Transmission Model: How NFP Data Reaches Gold Prices
The pathway from payroll data to precious metals pricing runs through a sequential chain. Each stage feeds the next. Disrupting any link in the chain weakens or reverses the expected response at the end.
Stage-by-Stage Breakdown
-
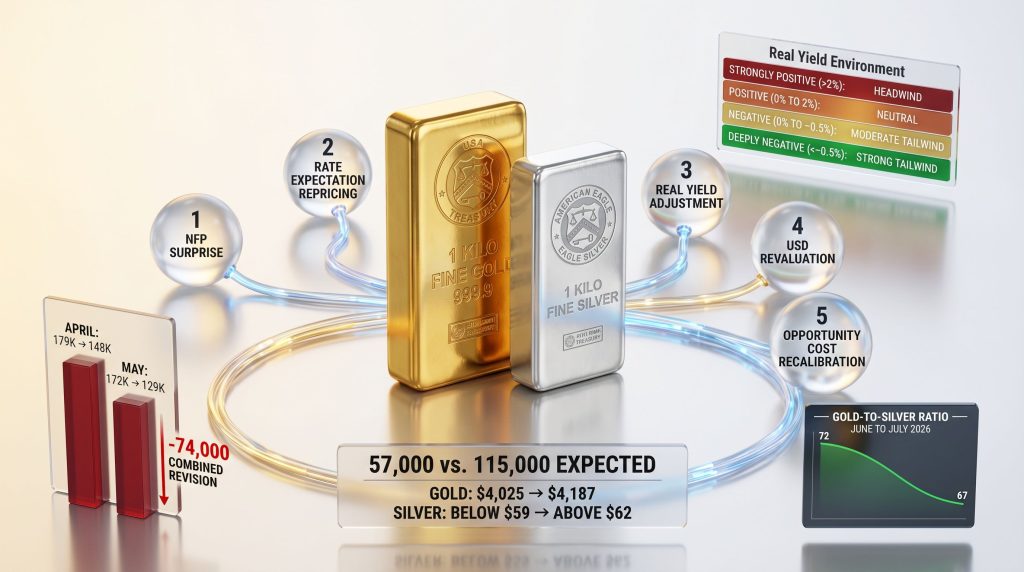
NFP Surprise Generation — Markets react not to the absolute payroll figure but to the deviation between reported results and the consensus estimate aggregated from major institutional forecasters. A print of 57,000 jobs when consensus sits at 115,000 produces a large negative surprise regardless of whether 57,000 is an economically significant number in isolation.
-
Federal Reserve Rate Expectation Repricing — Federal funds futures markets, tracked in real time through the CME FedWatch tool, immediately redistribute probability mass across upcoming rate decision scenarios. A significant miss shifts probability toward rate cuts or prolonged pauses; a beat shifts it toward holds or potential hikes.
-
Nominal and Real Treasury Yield Adjustment — Repriced rate expectations flow directly into the bond market. The 10-year Treasury yield moves as duration positioning adjusts. The operative variable for gold is the real yield — the nominal yield minus inflation expectations tracked through TIPS markets and the FRED database maintained by the Federal Reserve Bank of St. Louis. In addition, understanding gold and bond dynamics helps clarify how these yield adjustments translate into durable price moves.
-
U.S. Dollar Index Revaluation — Yield differentials between U.S. Treasuries and foreign sovereign bonds determine the relative attractiveness of dollar-denominated assets to international capital. Falling real yield expectations reduce the incentive for foreign investors to hold dollars, weakening the currency index.
-
Precious Metals Opportunity Cost Recalibration — Gold and silver generate no yield. Their attractiveness relative to interest-bearing alternatives is therefore a direct inverse function of real yields. When real yields compress, the comparative disadvantage of holding non-yielding metals shrinks, demand rises, and prices follow.
Understanding Real Yield: The Single Most Important Variable
Real yield is calculated as the nominal Treasury yield minus the expected inflation rate. A 10-year Treasury yielding 4.5% against inflation expectations of 3.0% produces a real yield of 1.5% — a meaningful return that competes directly with the zero yield offered by gold.
When real yields approach zero or turn negative, the competitive disadvantage of holding gold disappears entirely. This relationship has held consistently across multiple rate cycles and is widely regarded as the most reliable single-variable driver of gold pricing.
| Real Yield Environment | Gold Price Tendency | Dollar Tendency | Investor Behaviour |
|---|---|---|---|
| Strongly positive (above 2%) | Headwind | Strengthening | Rotate to Treasuries |
| Moderately positive (0 to 2%) | Neutral to mild headwind | Stable | Mixed positioning |
| Near zero (-0.5% to 0.5%) | Tailwind | Weakening | Accumulate metals |
| Deeply negative (below -0.5%) | Strong tailwind | Declining | Flight to hard assets |
The June 2026 NFP Release: The Transmission Chain in Practice
The June 2026 employment situation report, published by the Bureau of Labor Statistics on July 2, 2026, provides a near-textbook illustration of the full five-stage mechanism operating simultaneously.
The Bureau of Labor Statistics reported 57,000 jobs added in June 2026 against a Dow Jones consensus estimate of 115,000 — the smallest monthly gain in four months. Simultaneously, the BLS revised April's figure down by 31,000 (from 179,000 to 148,000) and May's figure down by 43,000 (from 172,000 to 129,000), erasing a combined 74,000 jobs from the prior two months (Bureau of Labor Statistics, July 2, 2026). Average hourly earnings increased a modest 0.3% — insufficient to signal wage-driven inflation pressure.
The transmission chain activated immediately:
- The CME FedWatch tool showed the probability of a September 2026 rate hike falling from 66% to 50% within hours of the 8:30 a.m. release (CME Group, July 2, 2026)
- The 10-year U.S. Treasury yield pulled back toward 4.5%, compressing real yields as inflation expectations held steady (Trading Economics, July 2026)
- The U.S. Dollar Index recorded its largest weekly decline since April 2026 (Trading Economics, July 2026)
- Gold advanced from approximately $4,025 pre-release to $4,187 by the following Monday, representing roughly a 4% gain (Yahoo Finance, July 2–7, 2026)
- Silver moved from below $59 to above $62 in the same window, a gain of approximately 6% (Trading Economics, July 2026)
- The gold-to-silver ratio compressed from above 72 in late June to approximately 67 in early July (Trading Economics, July 2026)
Operational Rule: Evaluate three data points together on every NFP release day: the headline payroll figure, prior-month revisions, and average hourly earnings. The June 2026 report was particularly decisive because all three components aligned in the same direction simultaneously — a relatively uncommon occurrence.
For further context on how this release unfolded across markets, the jobs report that changed everything offers a detailed breakdown of gold hitting $4,490 and silver exploding to $78 in the aftermath.
The March 2024 Case: When a Headline Beat Was Neutralised by Revisions
The March 2024 release demonstrates how the revision dynamic can override the headline entirely. The Bureau of Labor Statistics reported 275,000 jobs for February 2024 against a consensus of 198,000 — a substantial apparent beat (BLS, March 8, 2024). On the surface, this should have been dollar-positive and gold-negative.
However, the BLS simultaneously revised January's figure from 353,000 to 229,000, a reversal of 124,000 jobs (BLS, March 8, 2024). The two-month net came in close to flat. The dollar response was minimal, and gold held its position. The lesson is that the revision component frequently determines the true signal of any given release, regardless of what the headline number appears to say.
Why Gold's Response to a Weak Jobs Report Exceeds Its Response to a Strong One
Research examining 35 consecutive NFP releases found that gold's response to disappointing payroll data is consistently larger than its reaction to equivalent upside surprises (FXStreet, 2024–2026 NFP preview series). This asymmetry is structural, not accidental, and two independent mechanisms drive it.
The Recession Signal Amplifier
Weak employment data carries a secondary signal beyond the rate-expectation repricing: potential economic contraction. This activates broad risk-off positioning across asset classes. Equity exposure is reduced, credit spreads widen, and demand for monetary reserve assets accelerates. Gold therefore receives a dual bid on a weak NFP day. The rate-repricing channel and the safe-haven demand channel operate simultaneously, compounding the upward price pressure.
Seema Shah, Chief Global Strategist at Principal Asset Management, noted following the June 2026 release that the result challenged the prevailing narrative of renewed labour market resilience while reinforcing the case that the Federal Reserve faced minimal pressure to tighten policy further (CNBC, July 2, 2026). That framing captures the dual-channel dynamic precisely. Consequently, gold as a safe haven becomes particularly relevant when employment signals point toward economic slowdown.
The Constrained Policy Response
A strong NFP print only drives meaningful downward pressure on gold when the market simultaneously believes the Fed will act on that strength with rate increases. In a high-debt, fiscally constrained environment, that belief is structurally limited. Strong employment is a necessary but not sufficient condition for tighter monetary policy when the central bank's freedom of movement is constrained by sovereign debt sustainability concerns. The upside potential for the dollar and real yields is therefore capped on strong prints, which in turn caps the downside for precious metals.
The same FXStreet research found that gold's inverse correlation with payroll surprises weakens measurably within the fourth hour following the 8:30 a.m. release. The initial price snap typically overshoots in both directions. The remainder of the trading session reflects fuller digestion of the complete report. Practically speaking, the first 15 minutes post-release function as a raw signal; subsequent price action represents mean-reversion and recalibration as earnings data, the unemployment rate, and revision depth are absorbed.
How Silver's Response Differs from Gold's: The Industrial Variable
Silver runs through the same five-stage transmission mechanism as gold, but with two important differences: a higher beta to rate moves and a second independent variable that gold does not carry.
Approximately 58% of annual global silver consumption is industrial as of 2025, spanning solar photovoltaic manufacturing, electronics production, electric vehicle components, and medical technologies (Silver Institute, World Silver Survey 2026). This industrial exposure creates a scenario-dependent response to NFP data that gold does not experience. Furthermore, silver supply deficits running through five consecutive annual cycles add a structural tightness that can amplify silver's monetary-channel response.
| NFP Scenario | Gold Response | Silver Response | Dominant Channel |
|---|---|---|---|
| Mild miss (soft landing signal) | Moderate gain | Larger percentage gain | Monetary channel fires; industrial demand intact |
| Severe miss (recession signal) | Strong gain | Muted or mixed | Monetary tailwind vs. industrial headwind |
| Strong beat (limited Fed response) | Modest decline | Modest decline | Rate channel partially muted by fiscal constraints |
| Strong beat (credible Fed response) | Material decline | Material decline | Full transmission chain operates |
The June 2026 print represented what analysts describe as silver's operational sweet spot: soft enough to meaningfully reprice rate-cut expectations without triggering recession-driven industrial demand concerns. The result was silver outperforming gold by roughly two percentage points in the week following the release, with the gold-silver ratio analysis showing compression from above 72 to approximately 67 (Trading Economics, July 2026).
Silver-Specific Risk: A jobs report that signals genuine economic contraction creates a competing headwind for silver. Industrial demand, representing more than half of annual consumption, contracts alongside manufacturing activity during recessions. In this scenario, the monetary tailwind and the industrial headwind partially offset each other, and silver's net response depends entirely on which force dominates market pricing in the days following the release.
The next major ASX story will hit our subscribers first
When the NFP-to-Metals Connection Breaks Down: Fiscal Dominance
The transmission model described above carries a critical assumption: that the Federal Reserve possesses genuine operational freedom to respond to employment conditions. That assumption is conditionally false in the current fiscal environment, and understanding when it breaks down is as important as understanding when it holds.
As of mid-2026, U.S. national debt approaches $40 trillion (U.S. Treasury Fiscal Data). Each 25-basis-point rate increase materially elevates the cost of debt service across the federal balance sheet. Greg Shearer, head of base and precious metals research at J.P. Morgan, identified fiscal sustainability and central bank reserve diversification as the dominant structural forces shaping gold's longer-term trajectory, above and beyond the short-term rate dynamics captured in any single payroll release (J.P. Morgan Global Research, 2026).
The May 2026 ADP National Employment Report illustrated the disconnect concretely. Private-sector payrolls registered 109,000 for April, the strongest monthly gain since January 2025 (ADP Research Institute, May 6, 2026). Gold's response was minimal. Markets had already concluded that the Fed lacked the practical freedom to respond to strong data with aggressive rate hikes, regardless of what employment figures showed.
When fiscal constraints are the binding variable, strong payroll prints lose their capacity to drive meaningful dollar strength or real yield increases, and consequently lose their capacity to pressure precious metals. This asymmetric breakdown has a counterintuitive implication for metals holders: the same fiscal conditions that limit the Fed's responsiveness to strong data simultaneously undermine the long-term purchasing power of the currency the Fed manages.
Structural Factors That Can Override the Monthly NFP Mechanism
| Override Factor | Mechanism | Relevance to NFP Day |
|---|---|---|
| Central bank accumulation | Sovereign reserve diversification away from dollar assets | Provides structural price floor regardless of rate expectations |
| Fiscal constraints on Fed rate policy | Limits credibility of rate-hike signals | Weakens strong NFP's ability to pressure metals |
| Silver supply deficits | Five consecutive annual deficits through 2025 (Silver Institute, 2026) | Structural tightness limits downside |
| Institutional safe-haven positioning | Risk-off demand independent of rate dynamics | Activates on recession signals embedded in weak prints |
What Structural Trends Reveal That Monthly Data Cannot
Gold's approximately 26% gain over the twelve months to July 2026, rising from roughly $3,303 per ounce in June 2025 to approximately $4,168 in July 2026, was not driven by any single payroll release (CNBC; Yahoo Finance). Three durable structural forces account for the majority of that move:
- Central bank reserve accumulation operating at above-historical-average rates, driven by sovereign mandates to diversify away from U.S. dollar exposure
- Fiscal constraint on Federal Reserve policy, limiting the central bank's capacity to defend dollar purchasing power through traditional rate-based tools
- Silver supply deficit cycle, with five consecutive annual supply deficits recorded through 2025 creating structural tightness independent of monetary conditions (Silver Institute, World Silver Survey 2026)
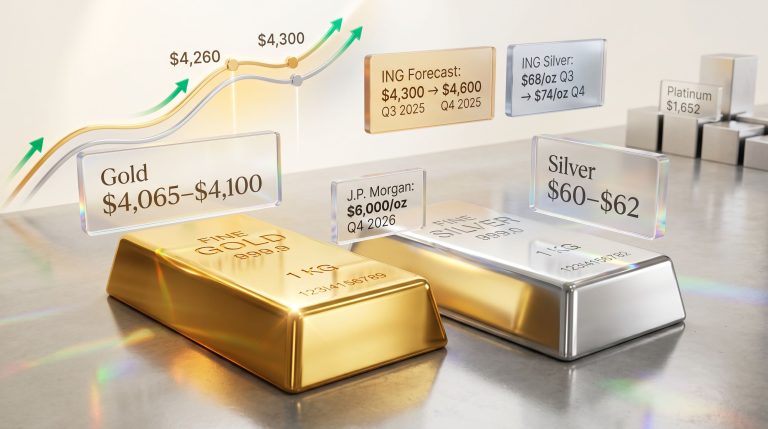
J.P. Morgan Global Research has forecast gold averaging $6,000 per ounce by Q4 2026, a projection grounded in structural demand dynamics rather than monthly data cycles (J.P. Morgan Global Research, 2026). For additional perspective, gold pulls back as strong jobs data resets rate-cut expectations illustrates precisely how quickly the structural narrative can interact with short-term data surprises.
For investors holding physical precious metals as a multi-year wealth preservation allocation, understanding how the jobs report moves gold and silver provides directional context about the labour market, not a trading trigger. The correlation between payroll surprises and gold prices weakens significantly within four hours of the release (FXStreet, 35-print analysis). Transaction costs, dealer premiums, and storage friction associated with physical metals make short-cycle trading around monthly economic data economically counterproductive in most scenarios.
The more consequential analytical question for long-duration holders is whether the structural forces making fiat currency less reliable are strengthening or weakening over time. When fiscal constraints progressively narrow the Fed's options, the monthly jobs report becomes contextual information rather than a decision-relevant signal for anyone operating on a multi-year investment horizon.
Frequently Asked Questions
Does a Strong Jobs Report Always Push Gold Lower?
Not automatically. A strong NFP print creates downward pressure on gold through the transmission chain only when two conditions are simultaneously met: the data must shift Fed rate expectations meaningfully, and the market must find those revised expectations credible given the fiscal environment. The June 2026 weak print was particularly effective because the miss was large (57,000 versus 115,000 expected), prior revisions compounded the weakness by a combined 74,000 jobs, and rate repricing was unambiguous (BLS, July 2, 2026). All three conditions aligned, which is relatively uncommon.
How Quickly Does Gold React to NFP Data?
The most pronounced price movement typically occurs within the first 15 minutes following the 8:30 a.m. ET release. Research across 35 consecutive NFP prints confirmed that the inverse correlation between payroll surprises and gold prices weakens measurably by the fourth hour post-release (FXStreet). Initial reactions frequently overshoot in both directions before the market processes the complete report.
Should Long-Term Physical Metals Holders Trade Around NFP Releases?
The weight of evidence argues against it. The correlation weakens materially within hours of release, and the practical costs associated with physical metal transactions — including dealer premiums and storage adjustments — far outweigh the potential benefit of capturing short-term price movements driven by a monthly data point. The structural case for how the jobs report moves gold and silver does not operate on a monthly clock, and long-duration holders are better served by monitoring the durable forces that no single payroll print can override.
This article is provided for informational and educational purposes only. It does not constitute financial or investment advice. Past performance of any asset, including precious metals, is not indicative of future results. All investment decisions should be made in consultation with a qualified financial adviser. Price forecasts mentioned represent the views of third-party research firms and should not be interpreted as guarantees of future performance.
Want to Know Which ASX Mining Companies Are Positioned for the Next Major Discovery?
While gold and silver respond to macroeconomic signals like the NFP report, the most significant wealth-creation events in the resources sector often come from ground-level mineral discoveries — and Discovery Alert's proprietary Discovery IQ model delivers real-time ASX discovery alerts, instantly translating complex geological data into actionable opportunities for investors at every level. Explore historic discovery returns on Discovery Alert's dedicated discoveries page and begin a 14-day free trial to position yourself ahead of the broader market.