
July 14, 2026
When the Map Runs Out: Oil Pricing in Uncharted Territory
Every forecasting model has a boundary condition, a point beyond which the historical data used to calibrate it simply stops providing reliable guidance. For oil markets, that boundary was crossed on March 2, 2026. The near-complete halt of vessel transit through the Strait of Hormuz did not just remove supply from global markets; it removed the analytical floor beneath conventional pricing frameworks. Understanding what the JP Morgan oil price forecast Strait of Hormuz situation means requires grasping not just the numbers themselves, but why producing those numbers took two months longer than usual, and what that delay reveals about the structural limits of modern commodity analysis.
When big ASX news breaks, our subscribers know first
The Strait of Hormuz and the Limits of Historical Precedent
The Strait of Hormuz has functioned as a commercial waterway for over a thousand years. Medieval spice and silk trade routes passed through it. Gulf commerce persisted through eras of regional conflict, piracy, and imperial competition. During the eight-year Iran-Iraq War, when hundreds of tankers were directly attacked in what became known as the Tanker War, flows were disrupted but never stopped entirely.
That record of continuity, stretching back more than a millennium, ended on March 2, 2026, when vessel transit slowed to what JP Morgan analysts described as a near standstill, representing the first near-complete halt in the Strait's recorded history.
The scale of what followed was without modern parallel. At the peak of the disruption, approximately 14 million barrels per day of supply was effectively removed from global markets. To contextualise that figure: when Russia invaded Ukraine in 2022, markets feared losses of up to three million barrels per day, yet actual Druzhba pipeline losses amounted to roughly 0.7 million barrels per day.
The 2026 Hormuz closure represented a realised supply removal roughly 20 times larger than the actual losses experienced during the most significant geopolitical oil shock of the preceding decade. Furthermore, the trade war oil impact from prior years had already introduced structural fragility into global supply chains, compounding the vulnerability of markets entering this crisis.
Yet the closest historical analogues that analysts could identify, the 1956 Suez Crisis and pre-World War II geopolitical disruptions, predate the existence of modern oil futures markets entirely. Brent and WTI benchmark contracts only began trading in the 1980s. Every econometric model used to price oil today was built on data from those post-1980s decades. Applying those frameworks to the current situation, as JP Morgan's commodities strategy team acknowledged, risked extrapolating from a dataset that simply did not contain this kind of shock.
Why the JP Morgan Oil Price Forecast Was Withheld for Two Months
JP Morgan's decision to suspend publication of oil price forecasts from early March through mid-May 2026 was a deliberate methodological choice, not an operational delay. The bank's head of global commodities strategy, Natasha Kaneva, along with the broader JP Morgan commodities team, determined that standard pricing models faced two compounding problems that made point forecasts unreliable.
Was It Simply a Data Problem?
The first was informational. In a rapidly evolving geopolitical situation, where diplomatic signals shift within hours and military developments alter physical market conditions in real time, feeding unstable inputs into a pricing model produces outputs that carry false mathematical precision. The team described this as a classic problem where unreliable inputs generate unreliable outputs regardless of how sophisticated the underlying framework is.
The second problem ran deeper. The pricing frameworks JP Morgan uses are calibrated on approximately 25 to 30 years of liquid futures trading data. Within that dataset, no comparable disruption exists. The methodology that works reliably for forecasting oil prices in response to OPEC's market influence, demand recessions, or even war-related supply disruptions is built on parameter estimates that were never designed to handle a sustained near-closure of the world's most critical maritime chokepoint.
When the team forced their model to generate an explicit price path in early March, assuming the Strait would reopen by early May, the output implied Brent would average approximately $100 per barrel across March, April, and May. That figure initially appeared counterintuitive given the magnitude of the shock. The 2022 reference point, where Brent spiked to $128 on fears of much smaller supply losses, suggested that a disruption 20 times larger should have produced a far more severe price response.
The resolution to that apparent paradox lies in understanding market starting conditions.
What Is JP Morgan's Current Oil Price Forecast?
Published on May 13, 2026, JP Morgan's base-case forecasts represent the bank's first formal price targets since the Hormuz crisis began. The forecasts anchor on an assumed Strait reopening around June 1, 2026, conditional on a clear and credible jointly confirmed announcement, including ratification by a multilateral authority such as the UN Security Council.
| Benchmark | 2026 Average Forecast | 2027 Average Forecast |
|---|---|---|
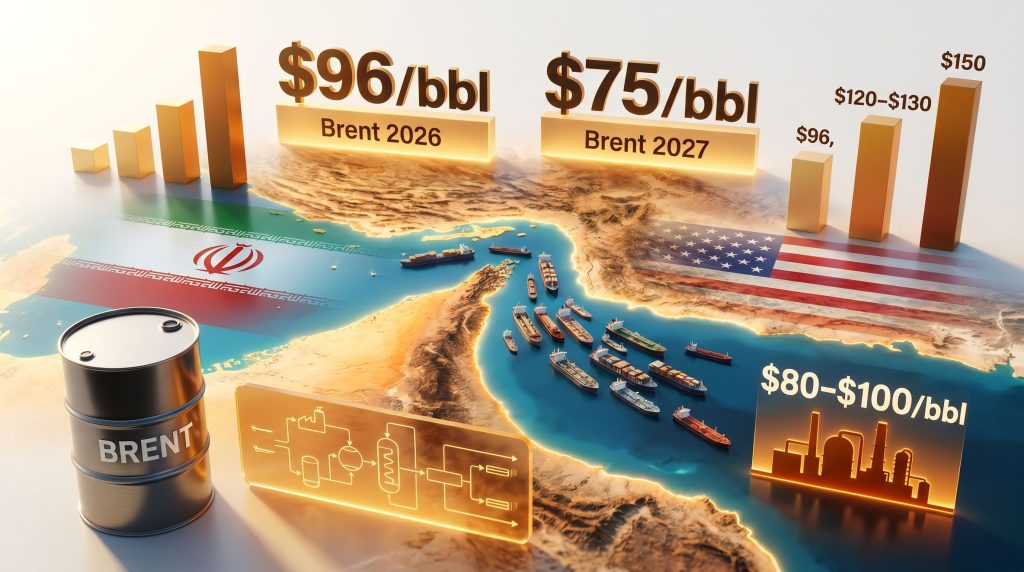
| Brent Crude | $96/bbl | $75/bbl |
| WTI Crude | $89/bbl | $70/bbl |
The $21 per barrel decline in Brent from 2026 to 2027 reflects the bank's assumption that normal Strait throughput resumes and that the inventory rebuild process progresses sufficiently to normalise supply and demand balances over the following 12 months. These are not certainty-weighted predictions; they are scenario-conditional estimates built on a specific resolution timeline that remains unconfirmed.
Importantly, actual market outcomes during the crisis have broadly validated the directional logic of the framework. Brent averaged $99 per barrel in March and $102 per barrel in April 2026, figures that proved consistent with the model's early output despite initial scepticism about whether those numbers were too low.
The Starting Point Problem: Why Inventory Levels Determine Price Sensitivity
The most counterintuitive insight from JP Morgan's analysis concerns the relationship between disruption size and price response. Conventional market intuition suggests a larger supply shock should produce a proportionally larger price increase. The 2026 data challenges that assumption directly.
In 2022, Brent's estimated fair value entering the crisis was approximately $90 per barrel, supported by post-COVID demand recovery, depleted inventory levels, and sustained OPEC production restraint. When markets priced in feared Russian supply losses, the premium above fair value pushed spot prices to $128.
In 2026, the market entered the year in surplus. Estimated Brent fair value was approximately $60 per barrel, with inventories described by JP Morgan as swollen relative to historical norms. The physical supply shock was dramatically larger, however the starting conditions meant the system had more buffer capacity to absorb the initial impact before prices were forced to ration demand through price signals alone.
This relationship between market entry conditions and price sensitivity is not intuitive from headline disruption data alone. It requires understanding that oil prices do not respond linearly to supply removals; they respond to the gap between available supply (including inventory drawdown capacity) and required consumption. A market in surplus entering a disruption behaves fundamentally differently from one already operating at the margin. For a broader perspective on these dynamics, the oil price volatility guide offers valuable context on how price sensitivity has evolved in recent years.
Four Mechanisms Shaping Oil Price Formation During the Hormuz Crisis
JP Morgan's analytical framework identifies four structural forces that explain why the price response has been more contained than the raw scale of supply removal would suggest. Each mechanism operates independently and their combined effect accounts for the apparent paradox of a historically large supply disruption producing a moderate crude price response.
Mechanism 1: Starting Conditions Determine Price Sensitivity
Whether a market enters a disruption in surplus or deficit critically shapes how much of the supply removal translates into upward price pressure. Inventory levels function as a price buffer; the more inventory available to draw down, the longer prices can remain below the level required to destroy sufficient demand to balance the market.
Mechanism 2: Duration Dominates Disruption Size
A large but short-lived supply shock can be absorbed through inventory drawdowns without requiring a proportional price response. A prolonged disruption cannot. The market's primary concern is not the peak volume removed but the cumulative inventory depletion over the duration of the closure. Consequently, JP Morgan shifted analytical focus away from geopolitical headlines toward the pace of inventory drawdown as the forcing function toward market resolution.
Mechanism 3: Physical Unavailability Bypasses the Price Signal
In a standard supply shock, higher prices gradually destroy demand by making consumption prohibitively expensive for price-sensitive users. In the Hormuz scenario, physical crude unavailability removes demand directly before the price signal can operate. Refineries that cannot source crude do not reduce throughput because prices are too high; they reduce throughput because the feedstock does not arrive.
This structural distinction allows crude benchmarks to remain lower than headline disruption volumes would otherwise imply.
Mechanism 4: The Price Signal Migrates Down the Refining Value Chain
Rather than expressing fully in flat crude prices, a disproportionate share of the supply dislocation has concentrated in refined product crack spreads. This redistribution along the value chain means that crude benchmarks like Brent and WTI remain relatively anchored while downstream product markets absorb the full stress of constrained availability.
The next major ASX story will hit our subscribers first
Scenario Analysis: From Base Case to Catastrophic Outcomes
JP Morgan's scenario framework captures the range of outcomes depending on the timing and credibility of any Strait reopening. The base case is not a prediction; it is the most probable outcome under defined conditions, with materially different price trajectories possible under alternative scenarios.
| Scenario | Key Assumption | Brent Price Implication |
|---|---|---|
| Base Case | Strait reopens around June 1, 2026 | $96/bbl average (full year 2026) |
| Delayed Recovery | Normalisation extends to July 2026 | Spike risk toward $120/bbl |
| Broad Escalation | Wider regional military engagement | $120 to $130/bbl |
| Catastrophic Closure | Prolonged shutdown with Gulf production cuts | Potential overshoot toward $150/bbl |
The catastrophic scenario becomes increasingly likely as Middle Eastern producer storage capacity approaches exhaustion. With an estimated 25 days of combined storage capacity across regional producers, a prolonged Strait closure would eventually force production shutdowns across multiple Gulf states, compounding the initial supply removal with additional upstream losses that cannot easily be reversed once they occur.
The base case resolution requires more than a simple diplomatic announcement. JP Morgan's analysts specify that what the market needs is a clear, credible announcement ratified and confirmed by both parties, such as a statement from the UN Security Council, before physical flows can resume and price premiums begin to compress. The interplay of oil and geopolitics has rarely been more consequential than in the current environment.
Refined Product Markets: Where the Real Stress Is Concentrated
While crude benchmarks have remained relatively contained, the downstream refining and product markets tell a more severe story. JP Morgan's analysis describes a scenario where crude prices could stabilise around $100 even as refined product prices continue rising, with the refining and end-user fuel crunch becoming the primary transmission channel for demand destruction.
The clearest expression of this dynamic is in jet fuel markets. Jet crack spreads, the margin refiners earn by converting crude into jet fuel above the cost of the crude itself, have widened to an extraordinary $80 to $100 per barrel over crude across Asia, Europe, and the United States. Jet prices have nearly doubled across major consuming regions.
A crack spread represents the margin a refinery earns by transforming crude oil into finished petroleum products. It is calculated as the difference between the market price of crude and the combined market value of the refined outputs produced from a given barrel. When crack spreads widen sharply, it signals that product markets are experiencing greater stress than crude benchmark prices alone would indicate, and that the physical supply constraint is being expressed downstream rather than at the crude level.
S&P Global Energy's Fuels and Refining team has quantified the demand destruction implications in terms that contextualise the severity of the downstream crisis.
| Period | Global Refinery Run Decline (YoY) | Refined Product Demand Decline (YoY) |
|---|---|---|
| Q2 2026 | -5.2 mb/d | -4.4 mb/d |
| Q3 2026 | -2.7 mb/d | -2.2 mb/d |
| Full Year 2026 (Average) | -1.9 mb/d | -1.8 mb/d |
The Q2 2026 demand decline is projected to exceed twice the worst quarterly demand loss recorded during the 2008 to 2009 Global Financial Crisis. S&P Global Energy's base case assumes the effective Strait closure continues through May before a gradual return of oil flows, and Q2 product demand estimates were revised lower by 4.7 million barrels per day relative to pre-crisis projections.
Daniel Evans, Vice President and Global Head of Fuels and Refining Research at S&P Global Energy, characterised the situation as having crossed a critical threshold where the demand equation cannot be solved without consumption acting as the primary market balancer. Karim Fawaz, Executive Director of Fuels and Refining at S&P Global Energy, framed the analytical challenge in terms of what he called the call on demand curtailment: the volume of consumption that must disappear given fixed supply constraints and limited inventory draw capacity.
The Inventory Clock and Why Reopening Alone Does Not Solve the Problem
JP Morgan's balance sheet analysis projects OECD commercial inventories approaching operational stress levels by early June 2026. Rationing behaviour, whether through airline capacity reductions, industrial fuel substitution, or voluntary consumption curtailment, can extend the inventory runway potentially toward June 30. However, this extension comes with a cost: reduced consumption, lower refinery utilisation rates, and progressively wider macroeconomic drag as fuel-intensive sectors curtail activity.
The inventory depletion timeline carries a critical implication that is less visible in headline price data: even a successful diplomatic resolution and immediate Strait reopening would not translate into prompt product market relief. According to the IEA, global oil supply is set to plunge below demand this year, further underscoring that operational and logistical delays between any flow resumption and the arrival of meaningful product supply relief are measured in months, not weeks.
Tanker repositioning, refinery ramp-up timelines, pipeline fill cycles, and regional inventory rebuilding create a structural lag that persists well beyond the geopolitical resolution date. Their assessment suggests that product markets would not normalise before late Q3 2026 at the earliest, even under an immediate restart scenario.
This lag dynamic represents a key risk for market participants and policymakers who may anchor expectations on the geopolitical event (Strait reopening) rather than the physical market consequence (product supply normalisation). The former is a discrete, observable event; the latter is a gradual process governed by logistics and infrastructure capacity.
What This Analysis Reveals About Modern Oil Market Structure
The JP Morgan oil price forecast Strait of Hormuz situation, published on May 13, 2026, is notable not just for its numbers but for what the process of producing those numbers exposed about the structural architecture of modern commodity analysis. Several conclusions emerge that extend beyond this specific crisis.
- Historical model training data has a meaningful boundary condition. Pricing frameworks calibrated on 25 to 30 years of futures data cannot reliably handle events that fall outside the distribution of shocks that occurred during that period.
- Inventory levels are a first-order variable in determining price sensitivity. The same physical disruption produces materially different price outcomes depending on whether the market enters it in surplus or deficit.
- Disruption duration matters more than disruption size for price formation. A large but brief shock can be absorbed through drawdowns; cumulative inventory depletion pace is the forcing function toward resolution.
- Price dislocations do not always express in crude benchmarks. In availability-constrained shocks, the adjustment migrates down the value chain into product crack spreads, leaving headline crude prices deceptively stable relative to the severity of downstream conditions.
- Reopening a chokepoint does not immediately reopen the market. Logistical lags in tanker routing, refinery ramp-up, and inventory rebuild mean that physical market normalisation follows diplomatic resolution by months, not days.
For investors, energy consumers, and policymakers, the analytical lesson from JP Morgan's approach is that in genuinely unprecedented situations, scenario-based frameworks with explicit assumptions are more useful than precise point forecasts. Furthermore, a crude market overview provides useful baseline context for understanding how dramatically conditions have shifted. The willingness to acknowledge the limits of one's models is, in this case, itself a form of analytical rigour.
This article contains forward-looking statements, scenario projections, and analyst forecasts that involve inherent uncertainty. Oil price forecasts, demand projections, and geopolitical scenario outcomes referenced herein are subject to change and should not be construed as investment advice. Readers should conduct independent research and consult qualified financial professionals before making investment decisions. All forecasts cited are sourced from JP Morgan and S&P Global Energy analyst reports as reported by Rigzone on May 13, 2026.
Want to Stay Ahead of the Next Major Commodity Market Shift?
Discovery Alert's proprietary Discovery IQ model scans ASX announcements in real time, instantly identifying significant mineral discoveries and translating complex data into actionable investment insights — ensuring subscribers are positioned ahead of the broader market. Explore how historic discoveries have generated substantial returns on the Discovery Alert discoveries page, and begin your 14-day free trial today.