July 16, 2026
When the World's Most Critical Oil Corridor Goes Dark
Every generation or so, a single geographic bottleneck reminds the world how fragile its energy infrastructure truly is. Maritime chokepoints have shaped the outcome of wars, collapsed economies, and rewritten energy investment strategies across decades. Yet despite repeated warnings from analysts and policymakers, the global oil trading system remains structurally dependent on a narrow strip of water at the mouth of the Persian Gulf.
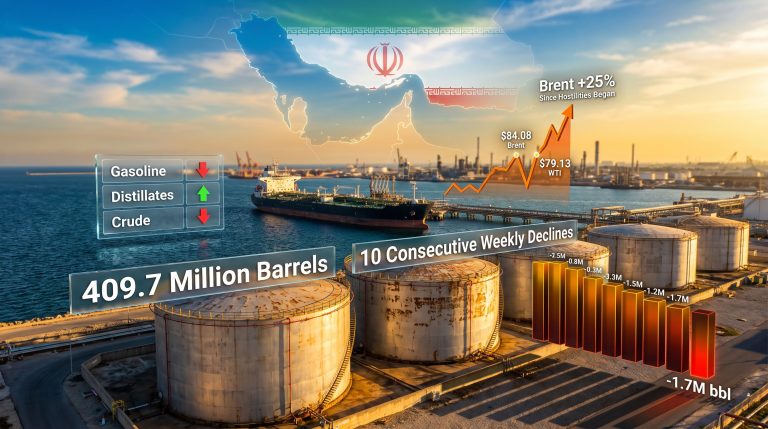
The ongoing conflict involving Iran has translated that long-standing theoretical vulnerability into a lived market reality. The Strait of Hormuz, through which roughly one-fifth of the world's daily oil consumption has historically transited, has been functionally closed to normal commercial shipping. The consequences are cascading through every layer of global energy economics, from household fuel bills to international forecasting models, and the numbers being revised by the world's most influential energy agencies tell a complex and increasingly divergent story.
When big ASX news breaks, our subscribers know first
How Global Oil Demand Forecasts Actually Work
Before examining what the current crisis means for market positioning, it is worth understanding the machinery behind the headline numbers that are now being revised. Global oil demand forecasts are not single-point predictions. They are rolling probabilistic models built from an ensemble of macroeconomic inputs.
The three agencies whose projections carry the most institutional weight are OPEC, the International Energy Agency, and the U.S. Energy Information Administration. Each publishes monthly reports that function as real-time economic signals, and each constructs its models from distinct analytical foundations:
- GDP growth assumptions drawn from IMF and World Bank projections, disaggregated by region
- Industrial activity indices tracking manufacturing output, freight volumes, and heavy industry energy intensity
- Transportation fuel consumption patterns across road, aviation, and maritime sectors
- Emerging market expansion trajectories, particularly across Asia, Africa, and Latin America
The critical methodological divergence between these agencies lies in what each framework weights most heavily. OPEC's Monthly Oil Market Report, known in the industry as the MOMR, places substantial analytical emphasis on non-OECD demand trajectories. This structural weighting toward emerging economy growth patterns consistently produces higher demand projections than models used by Western-aligned agencies.
The IEA, by contrast, incorporates energy transition headwinds more aggressively into its forward-looking scenarios, while the EIA applies a sharper focus on fuel price elasticity of demand in near-term projections. This is not merely an academic distinction. When a major supply disruption occurs, these methodological differences produce materially different forecasts from the same underlying event, creating genuine uncertainty for market participants trying to price risk.
OPEC Cuts Global Oil Demand Growth Forecast: Breaking Down the Numbers
OPEC's May 2026 Monthly Oil Market Report delivered the organisation's formal response to the Hormuz disruption. The revised figures carry more interpretive weight than any single data point suggests on its own, and furthermore, they signal a sustained pattern of adjustment rather than a one-off correction. OPEC's influence on oil markets means these revisions reverberate well beyond the organisation's membership.
| Metric | Previous Forecast | Revised Forecast | Change |
|---|---|---|---|
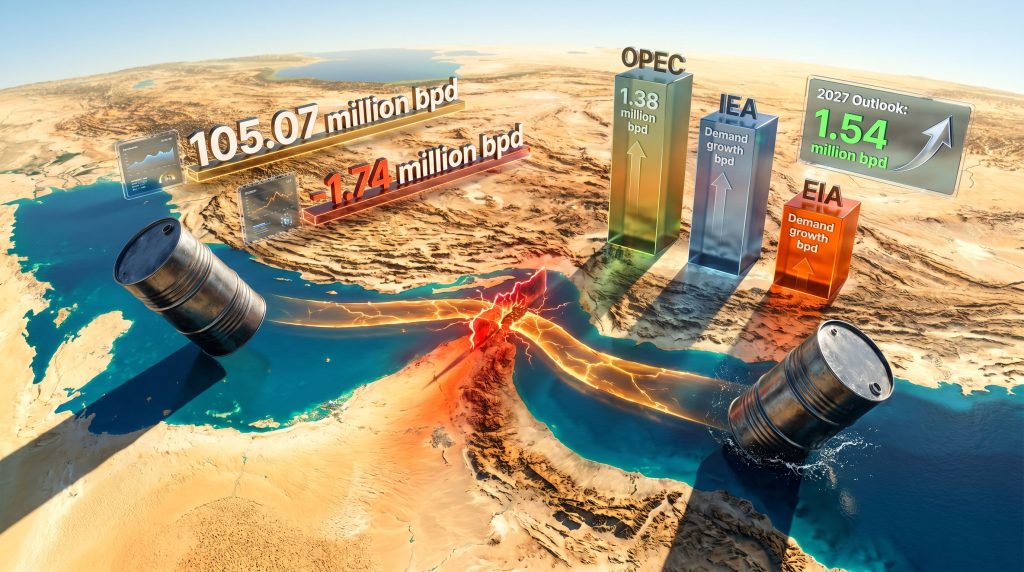
| Q2 2026 Global Demand | 105.07 million bpd | 104.57 million bpd | -500,000 bpd |
| Prior Month Q2 Revision | 105.57 million bpd | 105.07 million bpd | -500,000 bpd |
| Full-Year 2026 Demand Growth | 1.38 million bpd | 1.38 million bpd | Unchanged |
| 2027 Demand Growth Forecast | 1.34 million bpd | 1.54 million bpd | +200,000 bpd |
| OPEC+ Crude Output (April 2026) | ~34.93 million bpd (March) | 33.19 million bpd | -1.74 million bpd |
A single downward revision of 500,000 barrels per day is meaningful. Two consecutive revisions of the same magnitude in successive monthly reports is a categorically different signal. Sequential adjustments indicate that the demand destruction dynamic is not being driven by a one-time shock that models have now absorbed. Instead, it reflects sustained and worsening economic transmission of elevated fuel costs through consumer and industrial channels.
What makes OPEC's position analytically distinctive is the combination of near-term caution with longer-horizon optimism. While Q2 demand was revised down for the second consecutive month, the full-year 2026 demand growth forecast was held steady at 1.38 million bpd, and the 2027 outlook was actually upgraded by 200,000 bpd to 1.54 million bpd. This is an institutional statement that OPEC views the current disruption as a bounded, recoverable shock rather than a structural inflection in global consumption patterns.
The organisation also left its global economic growth forecasts unchanged, characterising the world economy as showing continued resilience despite the geopolitical pressures bearing down on the Middle East energy complex. This framing positions the demand weakness as a temporary price-driven suppression rather than a fundamental deterioration in underlying economic activity.
What Do the OPEC Demand Forecast Revisions Signal?
The OPEC demand forecast revisions across successive monthly reports suggest the organisation is threading a careful analytical needle. By maintaining its full-year growth figure whilst cutting the quarterly estimate, OPEC is effectively front-loading its acknowledged weakness whilst defending the structural recovery thesis. Consequently, markets must evaluate whether that defence is credible given the physical realities on the ground.
The Hormuz Closure: A Supply-Side Shock Unlike Previous Episodes
The Strait of Hormuz is approximately 33 kilometres wide at its narrowest navigable point, connecting the Persian Gulf to the Gulf of Oman and onward to global export markets. Major producers dependent on this corridor include Saudi Arabia, the UAE, Iraq, Kuwait, and Iran itself. Historically, the Strait has facilitated the movement of approximately 20 to 21 million barrels per day of crude oil and refined petroleum products, a volume equivalent to roughly one-fifth of total global daily consumption.
What makes any sustained Hormuz disruption so structurally severe is the near-total absence of viable alternative routing at comparable capacity. The East-West Pipeline across Saudi Arabia and partial bypass routes through Oman exist, but neither can absorb anything close to the full volume of Gulf exports. This physical constraint means the market cannot route around the problem in the way it might with, say, a pipeline disruption that can be redirected through interconnected grid systems.
The April 2026 OPEC+ production data crystallises the scale of the supply-side impact. Output across the group fell to 33.19 million bpd, a decline of 1.74 million bpd from March levels. That month-on-month contraction, measured via the secondary sources OPEC uses for independent production monitoring, represents one of the steepest single-month declines recorded outside of a formally negotiated production cut agreement.
This disruption is operating simultaneously on two distinct economic channels:
- The supply shock channel: Physical export capacity is constrained, reducing the volume of crude available to global refiners regardless of price
- The demand shock channel: The resulting fuel price surge is suppressing consumption across consumer, industrial, and logistics sectors globally
Standard single-factor economic models are poorly equipped to capture the non-linear price dynamics that emerge when both forces operate concurrently. Supply disruptions that simultaneously destroy demand create feedback loops that compress the price transmission window and make recovery timelines harder to model with precision.
Three Agencies, Three Very Different Readings
Perhaps the most analytically revealing aspect of the current crisis is the degree to which the world's three major energy forecasting bodies have diverged in their assessments, each responding to the same underlying event through the lens of its own methodological priorities.
| Agency | 2026 Demand Growth View | Characterisation of Disruption | 2027 Outlook |
|---|---|---|---|
| OPEC | 1.38 million bpd (maintained) | Transitory; bounded recovery | Upgraded to 1.54 million bpd |
| IEA | Revised materially lower | Structural near-term risk; supply below demand | Cautious |
| EIA | Approximately halved | Most severe near-term assessment | Not upgraded |
The IEA's April 2026 Oil Market Report went beyond a demand downgrade. The agency also projected that global oil supply would fall below demand in 2026, a structurally bullish price signal that has significant implications for how markets price inventory risk and long-term contract exposure. The IEA's heavier weighting of fuel price elasticity in near-term models drives a more aggressive demand destruction estimate than OPEC's framework produces.
The EIA's position represents the bearish extreme of the forecasting spectrum. Its approximately halved projection for 2026 demand growth reflects the application of the most conservative elasticity assumptions combined with a pessimistic view of how quickly consuming economies can adapt through conservation, substitution, and alternative sourcing.
This three-way divergence is not unusual in absolute terms, but the magnitude of the gap between OPEC and the EIA during a live geopolitical disruption of this scale is uncommon. It reflects genuine analytical uncertainty rather than mere model calibration differences, and it creates a wide band of possible outcomes for anyone trying to position around oil price trajectories.
How Elevated Fuel Prices Travel Through the Global Economy
Understanding why OPEC cuts global oil demand growth forecast repeatedly requires mapping the transmission channels through which price shocks translate into real consumption reductions. The mechanism operates across at least three distinct layers, and each operates on a different timeline.
The consumer household channel is the most visible. When fuel prices surge, disposable income contracts in every import-dependent economy. This effect is particularly acute across Asia, Sub-Saharan Africa, and parts of Eastern Europe where government fuel subsidies are either absent or fiscally unsustainable at elevated price levels. The price elasticity of transport fuel demand is relatively inelastic in the short term, but over a period of months, behavioural adaptation and government conservation mandates begin to register as measurable demand destruction.
The industrial and logistics channel operates more quickly in heavy industries. Energy-intensive manufacturing sectors including petrochemicals, cement, steel, and aluminium face direct and immediate input cost escalation. As production margins compress, output volumes are reduced, carrying second-order effects through global supply chains. Freight cost inflation compounds this by raising the delivered cost of goods across international trade routes.
The aviation sector faces a uniquely compounded burden. Beyond fuel cost increases that account for 20 to 30 per cent of airline operating costs in normal conditions, the closure of Middle East airspace and rerouting requirements add significant journey time and additional fuel burn to routes connecting Europe, Asia, and Australasia.
Multiple governments have announced emergency fuel reserve releases and conservation directives in response to the price environment. Strategic Petroleum Reserve utilisation across major consuming nations introduces a partial demand-buffering mechanism, though historical precedent from previous SPR deployment episodes suggests these releases moderate rather than reverse the underlying price signal.
The next major ASX story will hit our subscribers first
OPEC+ Production Architecture Under Structural Stress
The April 2026 production decline within OPEC+ needs to be understood within its institutional context to appreciate the full significance of the number. The group had formally agreed to resume output increases beginning from April 2026, a plan that became operationally undeliverable the moment Hormuz export flows were disrupted at scale.
The 1.74 million bpd month-on-month decline reflects the combined weight of three simultaneous forces:
- Physical export restrictions arising directly from the Hormuz closure preventing normal tanker loading and transit operations
- The impossibility of executing the agreed output increase schedule under current transit conditions
- The institutional complexity introduced by the UAE's formal departure from OPEC on May 1, 2026
That last point deserves particular attention. The UAE's exit from OPEC as a formal member organisation, whilst it remains part of the broader OPEC+ coalition, introduces a new layer of complexity into how production data will be measured, attributed, and compared on a historical basis going forward. With UAE output capacity estimated at approximately 4 million barrels per day at peak capacity, the reclassification of its production data changes the denominators analysts use to track compliance and quota management.
The suspension of the output increase schedule also reinforces the IEA's projection of supply falling below demand. The market had been pricing an expectation of additional barrels coming to market through the second half of 2026. With that supply pathway now indefinitely deferred, the structural deficit scenario carries considerably more probability weight than it did at the start of the year.
Historical Precedents and What Makes 2026 Structurally Different
Major Hormuz disruption scenarios are not without historical reference points. The 1980 to 1988 Iran-Iraq War saw tanker attacks reduce Gulf throughput materially during the most intense periods of the conflict. The 2019 Strait of Hormuz tensions, while ultimately contained, produced a measurable risk premium in crude markets without any physical closure occurring, illustrating how even the threat of disruption moves prices significantly.
How Does This Oil Price Shock Compare to Previous Episodes?
The current oil price shock distinguishes itself from prior incidents across several dimensions. Furthermore, this episode is unfolding against a backdrop of structurally reduced emergency buffers and a more fragmented producer alliance than in previous crises:
- Reduced global strategic reserve buffers: Post-2022 SPR drawdowns across major consuming nations have left emergency buffer inventories at structurally lower levels than during previous crisis episodes
- Tighter non-OPEC supply growth: The expected offset supply from U.S. shale and other non-OPEC producers has been insufficient to compensate for the Gulf volume shortfall at the required pace
- A more fragmented OPEC+ alliance: The UAE's departure from OPEC, combined with ongoing compliance divergence among member states, creates a less unified institutional response capacity than in prior crises
- Concurrent energy transition investment acceleration: The price shock is landing in a period where alternative energy economics are already competitive in many market segments, potentially accelerating permanent demand substitution
In addition, the broader trade war impact on oil markets compounds these structural pressures, as elevated tariff regimes are already squeezing industrial activity in key consuming economies before the Hormuz disruption fully feeds through into demand data.
The 2027 Recovery Thesis and Its Counter-Arguments
OPEC's decision to upgrade its 2027 demand growth forecast to 1.54 million bpd reflects a base case assumption that the current disruption resolves within a defined timeframe and that the underlying demand recovery drivers remain structurally intact. The non-OECD growth thesis, particularly centred on India's industrial expansion, Southeast Asian transportation fuel demand growth, and Sub-Saharan African consumption increases, provides the structural foundation for this optimism.
The counter-thesis rests on a well-documented historical pattern. Major oil price shocks have consistently functioned as catalysts for structural demand shifts rather than purely cyclical interruptions. The 1970s energy crisis catalysed serious government investment in solar and nuclear energy programmes across developed economies. The 2022 European energy price surge materially accelerated renewable energy deployment and heat pump adoption across the continent.
Whether the 2026 shock will similarly embed permanent demand impairment depends on the duration of elevated prices, the policy responses of major consuming governments, and the pace of electric vehicle and industrial electrification adoption in the economies most exposed to import price volatility. Import-dependent Asian economies in particular face a structural incentive to accelerate energy independence investments when fuel import costs consume an enlarged share of GDP.
This is the core uncertainty that separates OPEC's maintained optimism from the IEA's more cautious multi-year outlook. Neither position is unreasonable given current information. The gap between them defines the risk band within which market participants must operate. For a broader view of how these dynamics are unfolding, the latest geopolitical oil price analysis provides useful context on how these forces have been building since 2025.
Frequently Asked Questions
Why did OPEC cut its global oil demand growth forecast?
OPEC revised its Q2 2026 demand projection downward in response to the economic impact of the Iran conflict, which has functionally closed the Strait of Hormuz and sent fuel prices significantly higher. The resulting suppression of consumer and industrial consumption across global markets drove two consecutive monthly downward revisions to the Q2 estimate.
By how much did OPEC cut its oil demand forecast?
The May 2026 revision reduced the Q2 2026 global demand projection by 500,000 bpd to 104.57 million bpd. This followed an identical 500,000 bpd downward revision in the prior monthly report. The full-year 2026 demand growth forecast was held at 1.38 million bpd, while the 2027 outlook was upgraded by 200,000 bpd to 1.54 million bpd. Reuters has also reported on the details of this revision, providing additional context on the organisation's reasoning.
Which agency has the most bearish 2026 oil demand forecast?
The U.S. Energy Information Administration issued the most pessimistic revision among the three major forecasting bodies, reportedly cutting its 2026 demand growth projection by approximately half. The IEA adopted a more severe downward stance than OPEC whilst remaining less bearish than the EIA, and additionally projected that global oil supply would fall below demand in 2026.
What happened to OPEC+ output in April 2026?
OPEC+ crude production averaged 33.19 million bpd in April 2026, a decline of 1.74 million bpd from March levels as measured by the secondary sources the organisation uses for independent production monitoring. The figure reflects the combined impact of Hormuz export restrictions and the inability to execute the group's previously agreed output increase schedule. The April data includes the UAE, which formally departed OPEC as a member organisation on May 1, 2026.
Why is the Strait of Hormuz so important to global oil markets?
The Strait is the world's most critical maritime oil chokepoint, historically facilitating the transit of approximately 20 to 21 million barrels per day. No alternative routing exists at comparable capacity. Any sustained closure therefore creates an immediate and severe supply shortfall that cannot be rapidly offset through alternative channels, making it uniquely consequential for global energy security.
This article contains forward-looking statements and forecasts drawn from institutional reports and publicly available data. Oil demand projections involve inherent uncertainty and actual outcomes may differ materially from current estimates. Nothing in this article constitutes financial advice.
Want To Stay Ahead of the Next Major Resource Discovery?
While geopolitical shocks reshape global energy markets, Discovery Alert's proprietary Discovery IQ model delivers real-time alerts on significant ASX mineral discoveries, turning complex resource data into actionable investment insights — explore historic discoveries and their returns to see what early positioning can mean, and begin your 14-day free trial today to secure your market-leading edge.