August 3, 2026
The Hidden Architecture of Global Uranium Supply: Why Kazakhstan's Output Surge Matters More Than the Headlines Suggest
When the world's single largest supplier of any critical commodity increases production by nearly one-tenth in a single half-year period, the implications extend well beyond a quarterly production report. Uranium markets operate with structural characteristics that make this kind of supply shift unusually consequential, particularly for the long-term fuel procurement strategies of nuclear utilities, the economics of junior explorers, and the geopolitical calculus of energy-importing nations. Understanding why Kazakhstan uranium output up 9% year on year represents more than a statistical milestone requires examining the layers of market architecture that sit beneath the headline number.
When big ASX news breaks, our subscribers know first
Kazakhstan's Position as the Gravitational Centre of Global Uranium Supply
No other commodity market is as heavily concentrated in a single national producer as uranium. Kazakhstan alone accounts for roughly 45% of global primary uranium mine output, a dominance that has no equivalent in oil, copper, or iron ore. This structural reality means that production movements from Kazatomprom, the state-controlled enterprise that manages the country's uranium operations, carry disproportionate weight across the entire nuclear fuel cycle. Kazakhstan uranium dominance is, furthermore, a phenomenon that analysts across the nuclear fuel sector continue to grapple with.
The scale of this concentration becomes clearer when measured against competing producers:
| Country | Estimated Annual Output Range | Approximate Global Share |
|---|---|---|
| Kazakhstan | 27,500–29,000 tonnes (2026 guidance) | ~45% |
| Canada | ~7,000–8,000 tonnes | ~12–13% |
| Namibia | ~5,500–6,000 tonnes | ~9–10% |
| Australia | ~4,500–5,500 tonnes | ~8–9% |
| Uzbekistan | ~3,500–4,000 tonnes | ~6% |
| Russia | ~2,800–3,500 tonnes | ~5% |
Note: Figures represent approximate ranges based on publicly available production data and should be treated as indicative estimates.
The gap between Kazakhstan and its nearest competitors is not marginal. Canada, historically the world's second-largest producer, operates at roughly one-quarter of Kazakhstan's output scale. This asymmetry shapes everything from spot price discovery to long-term contract negotiation leverage. Considering the global uranium reserves picture, Kazakhstan's position becomes even more striking.
H1 2026 Production Data: The Numbers Behind the Trend
Kazatomprom's first-half 2026 results confirmed a meaningful acceleration in output, building on the company's earlier guidance signals about near-term capacity additions.
| Metric | H1 2025 | H1 2026 | Change |
|---|---|---|---|
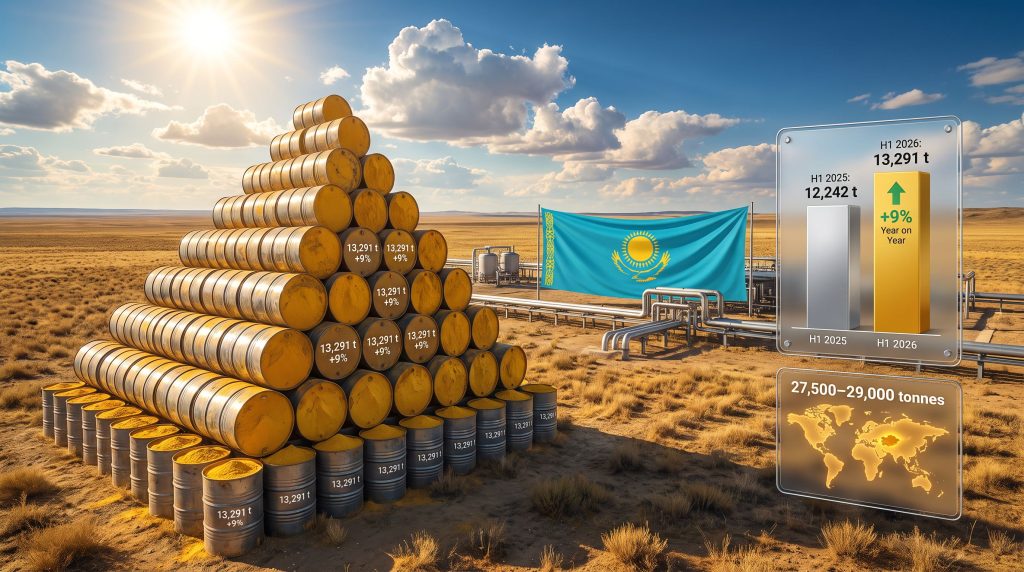
| Uranium Output (tonnes) | 12,242 | 13,291 | +1,049 tonnes |
| Year-on-Year Growth | Baseline | +9% | Significant |
| Full-Year 2026 Guidance | N/A | 27,500–29,000 tonnes | Upper-end trajectory |
The 1,049-tonne incremental gain from a single half-year period is not trivial in the context of global supply. Annual global primary uranium production has historically ranged between roughly 55,000 and 65,000 tonnes. An annualised version of H1 2026's trajectory would place Kazatomprom near the upper boundary of its full-year guidance, suggesting that the ramp-up underway is not merely front-loaded.
Structural Signal: The H1 2026 production run-rate, if sustained, would position Kazakhstan to deliver output that exceeds its prior-year annual total, reinforcing the country's expanding market share at a time when global nuclear demand is itself accelerating.
What Is Actually Driving the Ramp-Up: Budenovskoye and ISR Economics
The Budenovskoye Joint Venture: Long-Cycle Capacity Addition
The primary operational catalyst behind the 2026 production growth is the phased ramp-up of the Budenovskoye deposit, one of Kazakhstan's largest uranium resources currently in active development. This is not a short-term operational optimisation. Budenovskoye represents a multi-year capacity addition that was flagged in earlier guidance commentary as the principal contributor to anticipated output growth.
Its development cycle reflects the long lead times inherent in bringing major uranium assets online, even under Kazakhstan's comparatively efficient operating conditions. What makes this significant from an investor and market perspective is the distinction between cyclical and structural supply additions. Budenovskoye's contribution is structural, meaning the incremental tonnes it adds will not automatically reverse with commodity price movements.
In-Situ Recovery: The Operational Edge Most Analysts Underweight
Kazakhstan's uranium extraction relies almost entirely on in-situ recovery (ISR) mining, also known as in-situ leaching (ISL). This technique involves injecting an acidic or alkaline leaching solution directly into the uranium-bearing ore body through a network of injection and recovery wells, dissolving the uranium underground and pumping the uranium-enriched solution to the surface for processing. No underground mining galleries, no large-scale ore haulage, and no conventional milling circuits are required. The in-situ leaching benefits extend beyond cost savings, moreover encompassing meaningful environmental advantages over conventional mining methods.
The strategic implications of ISR dominance are often underappreciated:
- Lower capital intensity: ISR operations require significantly less upfront infrastructure investment than conventional mines, reducing the break-even uranium price needed to justify expansion.
- Faster ramp-up timelines: New ISR wellfields can be brought into production more rapidly than equivalent conventional mine developments, giving Kazatomprom greater flexibility to respond to demand signals.
- Scalability without proportional cost growth: Expanding ISR production typically involves drilling additional wellfields rather than constructing entirely new mining infrastructure, enabling incremental capacity additions at relatively predictable costs.
- Acid consumption as a hidden variable: Kazakhstan's sandstone-hosted uranium deposits are generally well-suited to sulphuric acid leaching, but acid consumption rates and subsurface geology variability can influence recovery efficiency in ways that are not always visible in headline production data.
This operational model is structurally distinct from the high-grade hard-rock deposits that dominate Canadian uranium production, particularly in the Athabasca Basin. Canadian operations like Cigar Lake and McArthur River produce uranium at grades that can exceed 15–20% U3O8, astronomically higher than the typical Kazakh ISR deposit grades of roughly 0.01–0.05% U3O8. However, the cost-per-pound economics of ISR at scale can be competitive with high-grade conventional mining due to lower mining costs, making direct grade comparisons misleading without a full cost-stack analysis.
Ownership Architecture and Its Strategic Implications
Kazatomprom operates under a dual accountability structure that shapes its production strategy in ways purely commercial producers would not replicate. Samruk-Kazyna, Kazakhstan's sovereign wealth fund, holds a 75% controlling stake, while the remaining shares have been publicly listed on the London Stock Exchange since 2019.
This structure means:
- Production decisions reflect national energy and economic policy priorities alongside shareholder returns.
- The sovereign shareholder has long-term geopolitical incentives to maintain market share that a purely profit-maximising company might not prioritise during low-price environments.
- Institutional investors accessing the listed shares must price in sovereign policy risk alongside conventional mining operational risk.
How Kazatomprom Actually Sells Its Uranium: The Contract Architecture
Yellowcake and the Long-Term Contract Ecosystem
Kazatomprom produces and sells uranium oxide concentrate (UOC), commonly called yellowcake, as its primary commercial product. This is the intermediate form of natural uranium traded between mine operators and conversion facilities before further processing into nuclear fuel.
The vast majority of this output is sold under long-term supply contracts with nuclear utilities globally. Only a small proportion reaches the spot market. This sales structure has critical implications that are frequently misunderstood:
| Sales Channel | Volume Share | Price Exposure | Market Sensitivity |
|---|---|---|---|
| Long-Term Contracts | Dominant majority | Fixed or formula-linked | Low immediate volatility |
| Spot Market | Minor volumes | Full spot price exposure | Visible but limited scale |
Key Analytical Point: Because Kazatomprom absorbs the majority of its production growth into long-term contract fulfilment rather than spot market sales, a 9% production increase does not create direct near-term downward pressure on spot uranium prices. Uranium market participants who interpret Kazakh production data purely through a spot-price lens are likely to draw incorrect conclusions.
Supply, Demand, and the Structural Deficit Question
Does 1,049 Extra Tonnes Close the Gap?
The uranium market has been characterised by a broadly tightening supply-demand balance over the medium term, driven by several converging forces. The uranium supply-demand volatility observed in recent years consequently underscores why even incremental production shifts attract considerable market attention:
- New reactor construction in Asia, particularly in China and India, is adding nuclear capacity at a pace that outstrips incremental primary supply growth globally.
- Life extensions of existing Western reactors, reversing earlier decommissioning timelines in countries including the United States, France, and Belgium, are sustaining uranium demand from assets that were previously expected to wind down.
- The emerging small modular reactor (SMR) pipeline represents a longer-dated but increasingly credible source of additional demand, with multiple demonstration projects progressing toward commercial operation.
- Secondary supply contraction, as government stockpile drawdowns and underfeeding economics from enrichment operations continue to diminish, removes a historical buffer that partially offset primary supply shortfalls.
Against this backdrop, Kazatomprom's additional 1,049 tonnes in H1 2026 is meaningful but not market-transforming in isolation. The structural supply deficit narrative that has supported uranium price appreciation in recent years is not resolved by a single producer's half-year ramp-up, even when that producer controls nearly half of global supply.
The Downstream Bottleneck Dimension
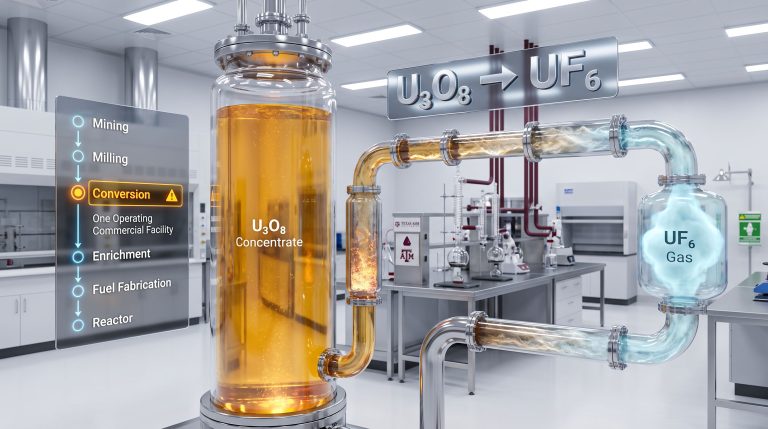
A subtlety that pure uranium production data obscures is the distinction between primary uranium output and enriched uranium product (EUP) availability. The nuclear fuel cycle involves multiple sequential steps:
- Mining: Uranium ore extracted and processed to UOC (yellowcake).
- Conversion: UOC converted to uranium hexafluoride (UF6) for enrichment.
- Enrichment: UF6 enriched to increase the proportion of fissile U-235.
- Fuel fabrication: Enriched uranium converted into fuel assemblies for reactor use.
Capacity constraints in the conversion and enrichment sectors, particularly outside Russia following geopolitical disruptions, mean that increases in primary uranium output do not automatically translate into additional reactor fuel availability. Utilities entering long-term contracting negotiations in 2026 may find a modestly more supplied environment at the yellowcake stage while still facing genuine tightness further downstream.
The next major ASX story will hit our subscribers first
Implications for Junior Uranium Explorers and Developers
Incremental supply growth from a low-cost, established producer like Kazatomprom applies indirect competitive pressure on higher-cost greenfield uranium projects globally. Junior explorers and developers in Canada, Australia, and emerging African uranium jurisdictions must continuously benchmark their project economics against the ISR cost structure of Kazakh production.
However, this competitive dynamic is partially offset by a structural reality that is increasingly influencing utility procurement strategies: geopolitical supply diversification. Western nuclear utilities have demonstrated growing appetite for supply agreements with non-Russian, non-Kazakh producers, even at a modest cost premium, to reduce concentration risk in their fuel portfolios. Understanding broader uranium market dynamics is therefore essential for investors assessing junior uranium opportunities in this environment.
Speculative Consideration: If geopolitical risk premiums continue to factor into utility procurement decisions, projects in politically stable jurisdictions such as Canada and Australia may command a structural price premium over Kazakh spot-equivalent volumes that partially insulates them from competition based solely on production cost. This remains a developing dynamic rather than an established market mechanism, and investors should approach it with appropriate caution.
Frequently Asked Questions: Kazakhstan Uranium Production 2026
How much uranium did Kazakhstan produce in H1 2026?
Kazakhstan produced 13,291 tonnes of uranium in the first half of 2026, representing a 9% increase compared to 12,242 tonnes produced during the same period in 2025.
What is Kazatomprom's full-year 2026 uranium production guidance?
Kazatomprom has guided for full-year 2026 uranium output in the range of 27,500 to 29,000 tonnes.
Why is Kazakhstan the world's largest uranium producer?
Kazakhstan benefits from large, geologically accessible uranium deposits hosted in permeable sandstone formations, which are ideally suited to low-cost ISR mining. According to the World Nuclear Association, decades of state investment in nuclear fuel infrastructure through Kazatomprom have further cemented this production advantage.
Does Kazatomprom sell uranium on the spot market?
Kazatomprom primarily sells uranium oxide concentrate under long-term supply contracts with nuclear utilities. Only a small proportion of total output is transacted on the spot market, limiting the company's direct exposure to short-term price volatility.
Who owns Kazatomprom?
Kazakhstan's sovereign wealth fund, Samruk-Kazyna, owns 75% of Kazatomprom. The company has maintained a public listing on the London Stock Exchange since 2019, giving international institutional investors direct equity access.
What is driving Kazatomprom's production growth in 2026?
The primary operational driver is the ramp-up of the Budenovskoye joint venture, one of Kazakhstan's largest uranium deposits currently in phased development, supported by the inherent scalability of Kazakhstan's ISR mining infrastructure.
Key Takeaways
- H1 2026 output reached 13,291 tonnes, up from 12,242 tonnes in H1 2025, a year-on-year gain of 1,049 tonnes (+9%)
- Full-year 2026 guidance of 27,500–29,000 tonnes positions Kazakhstan to maintain approximately 45% of global primary uranium supply
- Budenovskoye ramp-up represents a structural, multi-year capacity addition rather than a temporary operational swing
- ISR mining economics give Kazakhstan production flexibility and cost advantages that conventional mining jurisdictions cannot easily replicate at scale
- Long-term contract dominance means production increases are largely absorbed without creating immediate spot market price disruption
- Downstream conversion and enrichment bottlenecks persist independently of primary uranium supply growth, limiting the translation of additional Kazakh tonnes into finished reactor fuel
- Geopolitical diversification incentives continue to support investment in non-Kazakh uranium supply chains despite competitive cost pressure from Kazatomprom's scale
This article is for informational purposes only and does not constitute financial advice or a solicitation to invest in any securities or commodities. Uranium market forecasts, production estimates, and supply-demand projections involve significant uncertainty and should not be relied upon as the sole basis for investment decisions. Readers should conduct independent research and seek qualified financial advice before making investment decisions.
Want to Identify the Next Major Uranium Discovery Before the Market Does?
Discovery Alert's proprietary Discovery IQ model delivers real-time alerts on significant ASX mineral discoveries — cutting through complex commodity data to surface actionable opportunities the moment they emerge on the ASX. Explore historic discoveries and their exceptional returns to understand what's possible, then begin your 14-day free trial to position yourself ahead of the broader market.