August 20, 2026
When Pricing Cycles Turn: What Titanium Feedstock Markets Reveal About Mining's Boom-Bust Reality
Few sectors demonstrate the brutal arithmetic of commodity cyclicality quite like mineral sands. When downstream demand softens and supply continues to flow uninterrupted from multiple global sources, the pricing mechanism that underpins entire mining operations can deteriorate with startling speed. Titanium feedstock markets, which supply the raw materials for everything from paint pigments to aerospace-grade titanium metal, are not immune to this reality. Their structural complexity, spanning ilmenite, rutile, and zircon across multiple end-use industries, makes them particularly susceptible to prolonged pricing troughs when multiple negative forces converge simultaneously.
Understanding how Kenmare weak market conditions financial performance intersected in the first half of 2026 requires more than a reading of headline numbers. It demands an appreciation of the geological constraints, market dynamics, and operational timing factors that combined to compress margins to their lowest levels in recent memory.
When big ASX news breaks, our subscribers know first
The Titanium Feedstock Value Chain: More Complex Than It Appears
The mineral sands industry sits at the beginning of a long and technically demanding value chain. Heavy mineral concentrate (HMC) extracted from ore bodies contains a mixture of titanium-bearing minerals, predominantly ilmenite, alongside rutile and zircon, each serving distinct industrial purposes.
- Ilmenite is the primary feedstock for titanium dioxide (TiO2) pigment production, which gives white paint, plastics, and coatings their opacity and brightness. It also serves as a precursor to synthetic rutile and titanium slag through upgrading processes.
- Rutile is a higher-grade titanium feedstock used in welding electrodes, specialty pigment production, and as a direct feed for titanium metal and sponge production targeting aerospace and defence applications. The rutile price assessment landscape has undergone notable shifts in recent years, adding further complexity for market participants.
- Zircon is chemically distinct, serving ceramic tile glazes, refractory materials, and increasingly, advanced nuclear and chemical applications. Its price cycle often diverges from ilmenite, making it a critical revenue diversifier for mineral sands producers.
The pricing of these minerals does not move in lockstep. Zircon can strengthen while ilmenite weakens, as has been observed entering the second half of 2026. This divergence has significant implications for producers whose revenue mix spans all three products, because a strengthening zircon market can partially buffer the damage inflicted by ilmenite oversupply.
Why Ilmenite Oversupply Is a Structural Problem, Not a Temporary Blip
Global ilmenite markets have been navigating an extended oversupply phase driven by the convergence of two opposing forces. On the supply side, several significant projects have progressively ramped up output over recent years, adding meaningful tonnes to an already well-supplied market. On the demand side, the post-pandemic normalisation of construction activity and consumer goods manufacturing has moderated TiO2 pigment consumption growth, reducing the urgency with which downstream processors need to replenish feedstock inventories.
A critical but less-discussed dynamic is the role of Chinese TiO2 pigment producers, who collectively represent the largest single consumer of ilmenite globally. Their procurement behaviour, which involves strategic inventory building during price troughs and drawdowns during peaks, amplifies price volatility. When Chinese buyers perceive that prices have further to fall, they delay restocking, which deepens the trough and extends its duration beyond what supply-demand fundamentals alone might suggest.
This behavioural dynamic is a key reason why mineral sands pricing troughs tend to overshoot on the downside before recovering, creating investment opportunities for patient capital while inflicting genuine financial pain on producers operating through the cycle.
Kenmare's H1 2026 Financials: Anatomy of a Pricing Collapse
The H1 2026 results announcement reflects the full force of these market dynamics applied to a single-asset producer navigating a simultaneous operational transition. Furthermore, the commodity price impact on earnings was severe enough to draw widespread analyst attention across the sector.
Revenue and Earnings: The Numbers Behind the Headlines
| Financial Metric | H1 2026 | H1 2025 (Adjusted) | Change |
|---|---|---|---|
| Mineral Product Revenue | $134.5M | ~$160M | -16% |
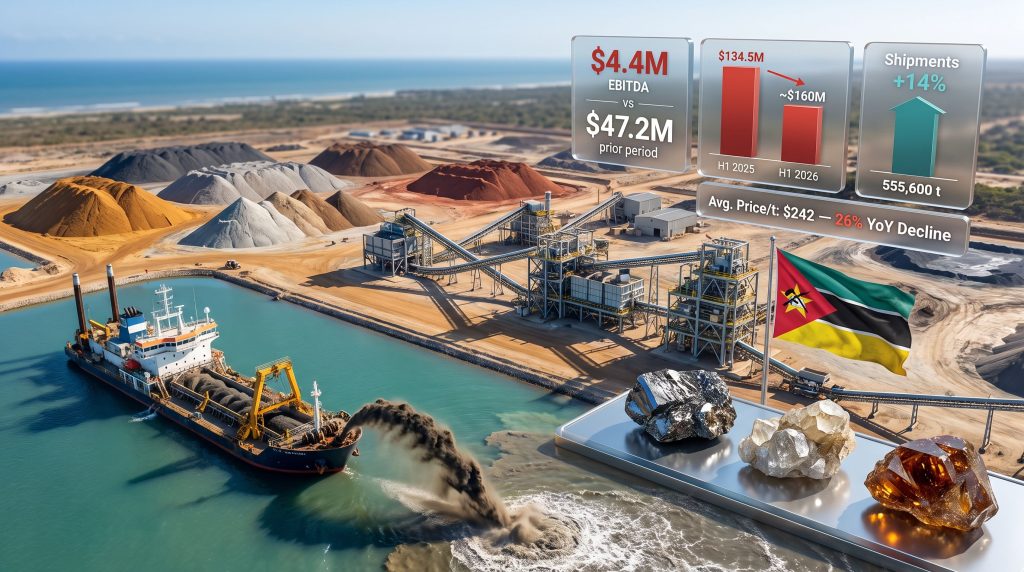
| Adjusted EBITDA | $4.4M | $47.2M | -91% |
| Net Profit / (Loss) After Tax | -$34.1M | +$6.1M | Swing to loss |
| Average Price Per Tonne | ~$242 | ~$327 | -26% |
| Cash Operating Cost Per Tonne | $255 | ~$247 | +3% |
The most striking figure is not the revenue decline itself but the near-complete obliteration of EBITDA margin. A 16% revenue reduction produced a 91% compression in adjusted EBITDA, from $47.2 million to just $4.4 million. This disproportion reveals the operating leverage embedded in mineral sands businesses: when prices fall below a certain threshold relative to the cost base, margins collapse disproportionately because a large portion of costs are relatively fixed.
The average price received per tonne fell to approximately $242, representing a 26% year-on-year decline. This is not a marginal pricing adjustment. At $242 per tonne against a cash operating cost of $255 per tonne for finished product, Kenmare was effectively selling below its cash production cost during portions of the reporting period, a situation that cannot persist without balance sheet consequences.
The near-total erosion of EBITDA margin illustrates that a producer's cost base, however well managed, cannot absorb a 26% pricing collapse without fundamental financial stress. The question for investors is not whether damage occurred, but whether the damage is temporary and recoverable.
The broader commodity price impact on company performance is well documented, and Kenmare's results serve as a stark illustration of how quickly earnings can evaporate when pricing cycles turn against a producer.
Operational Complexity: The Namalope Transition and WCP A Commissioning
Beyond pricing, Kenmare's H1 2026 results were compounded by a geological and operational transition that was anticipated but proved more disruptive than planned.
The Geology Behind the Grade Decline
WCP A, one of two wet concentrator plants operating at the Moma mine in Mozambique, is approaching the end of its current mine path through the Namalope deposit. This is a scheduled geological transition, not an unexpected event, but its timing and the magnitude of the associated grade decline have had a meaningful impact on production metrics.
Ore grade declined approximately 26% year-on-year as WCP A mined progressively lower-grade material toward the end of the Namalope path. In mineral sands mining, ore grade economics are the foundational variable that determines how much heavy mineral concentrate can be extracted per tonne of ore processed. A 26% grade decline essentially means the plant must move significantly more ore to produce the same quantity of HMC, increasing unit costs and reducing throughput efficiency simultaneously.
This geological reality is well understood within the mineral sands industry but is less familiar to generalist investors. The concept of a mine path refers to the planned route a dredge follows through an ore body, optimised to balance grade, depth, water availability, and infrastructure constraints. As a dredge approaches the end of one mine path, grades typically taper before the operation transitions to a new, higher-grade starting point. The transition period is where financial and operational vulnerability peaks.
Production Performance Summary
| Operational Metric | H1 2026 | H1 2025 | Change |
|---|---|---|---|
| HMC Production | 442,200 t | ~669,700 t | -34% |
| Total Finished Products | 430,100 t | ~500,100 t | -14% |
| Total Shipments | 555,600 t | ~487,400 t | +14% |
| Ilmenite Production | Down ~39% YoY | Baseline | -39% |
Dredge Commissioning: Why New Equipment Takes Longer Than Expected
The WCP A upgrade introduced two new dredges designed to enhance mining efficiency and support the transition to the next mine path. However, commissioning these dredges proved more time-consuming than anticipated due to the calibration requirements of integrating new equipment into an existing operational system.
Dredge commissioning in mineral sands operations is technically demanding. Dredges must be calibrated to optimise suction pressure, slurry concentration, and pump performance relative to the specific characteristics of the ore body being mined. Variations in ore hardness, clay content, and water depth all affect how a dredge performs, and achieving stable, efficient operation typically requires iterative adjustment over weeks or months.
The extended commissioning timeline at WCP A reflects this technical complexity rather than any fundamental design flaw. Importantly, WCP B delivered strong performance throughout H1 2026, providing a partial operational offset. This distinction matters because it demonstrates that the Moma mine's broader production infrastructure remains capable, with the H1 challenges concentrated specifically in the WCP A transition.
Cost Structure: Efficiency Gains Overwhelmed by Volume Dilution
One of the more nuanced aspects of Kenmare's H1 2026 results is the distinction between total cost performance and unit cost performance. These two measures tell very different stories.
- Total cash operating costs fell 12% in absolute terms, demonstrating genuine cost discipline and efficiency improvements across the operation.
- Cash operating cost per tonne of finished product rose 3% to $255/t, because the 12% cost reduction was more than offset by a 14% decline in finished product volume.
- Cash operating cost per tonne of ilmenite (net of co-products) rose 7% to $226/t, driven by a 39% decline in ilmenite production specifically, which amplified unit cost metrics sharply.
This distinction is critical for investors assessing the quality of the cost performance. The absolute cost reduction demonstrates that management successfully reduced expenditure in response to the difficult environment. The unit cost increase is a mathematical consequence of lower throughput, not evidence of cost blowout. As WCP A ramps up and production volumes recover, unit costs should normalise without requiring structural cost changes.
2026 Full-Year Cost Guidance
| Cost Metric | 2026 Guidance | 2025 Actual | Reduction |
|---|---|---|---|
| Total Cash Operating Costs | $215M – $225M | $243M | 7% – 12% |
| H2 Capital Expenditure | ~$30M | – | – |
| WCP A Upgrade Capex (H2 Only) | ~$7M | – | – |
The full-year cost guidance range of $215 million to $225 million represents a meaningful reduction from 2025's $243 million, signalling that the absolute cost discipline achieved in H1 is expected to be maintained and extended through the remainder of the year.
Liquidity Management: How Kenmare Is Protecting Its Balance Sheet
With EBITDA compressed to near-zero levels and net debt at $175.8 million at June 30, 2026, the adequacy of Kenmare's liquidity framework has become a central concern for investors assessing balance sheet risk.
| Liquidity Lever | Detail |
|---|---|
| Revolving Credit Facility | $230M (following $30M upsize) |
| Net Debt at June 30, 2026 | $175.8M |
| Covenant Status | Amended to provide additional flexibility |
| Cash Flow Support | Inventory drawdown and shipment performance |
| Post Period-End Receipts | Strong, as confirmed by management |
The $30 million upsize of the revolving credit facility to a total of $230 million, accompanied by amendments to financial covenants, provides meaningful headroom during what is acknowledged as a period of simultaneous market weakness and operational transition. The willingness of lenders to extend and amend the facility reflects an assessment that the underlying Moma asset retains long-term value even as near-term financial metrics are under pressure.
Cash generation during the period was supported by an important mechanism: the drawdown of finished product stockpiles. When production falls but shipments increase, inventory accumulated in prior periods converts to cash, providing a buffer that does not show up in EBITDA but is very real in terms of liquidity support. Total shipments of 555,600 tonnes grew 14% year-on-year, substantially supported by this inventory unwinding alongside consistent transshipment execution from the Moma port facility.
The next major ASX story will hit our subscribers first
The H2 2026 Recovery Thesis: Zircon, Product Mix, and Ramp-Up Progress
The investment case for Kenmare through the second half of 2026 rests on three intersecting catalysts, each of which is advancing at a different pace.
Zircon Price Recovery: The Higher-Value Product Advantage
Zircon pricing has begun to strengthen entering H2 2026. This is particularly significant for Kenmare because zircon typically commands a substantially higher price per tonne than ilmenite, meaning even modest volume contributions from zircon can have an outsized positive effect on blended average revenue per tonne. A strengthening zircon market improves the revenue mix without requiring any change in total production volumes, making it one of the most capital-efficient tailwinds available to the business.
Higher-Value Ilmenite Product Mix in Q3
Beyond zircon, management has indicated that a higher-value ilmenite product mix is expected in Q3 2026. This reflects the reality that not all ilmenite is priced equally. Ilmenite with higher TiO2 content, lower impurity levels, and optimal particle size distribution commands premium pricing in the market. As WCP A transitions to a new mine path, the ore characteristics and resulting product specifications may shift favourably, contributing to improved average revenue per tonne.
WCP A Commissioning Progress Accelerating
Management has confirmed that commissioning progress at WCP A accelerated through July and early August 2026, with production improving during this period. The fact that only $7 million of the anticipated $30 million in H2 capital expenditure relates to the WCP A upgrade reflects how substantially the investment phase of the project has been completed. The project execution risks associated with this transition remain a watchpoint, however the transition from capital deployment to production ramp-up is an important inflection point for free cash flow generation.
2026 Full-Year Guidance Overview
| Guidance Metric | Target | Context |
|---|---|---|
| Total Shipments | At least 1.1M tonnes | +15% vs. 2025 actuals |
| Total Cash Operating Costs | $215M – $225M | 7%-12% below 2025 |
| Ilmenite Production | ~800,000 t | Moderated from prior guidance |
| H2 Capital Expenditure | ~$30M | WCP A component only $7M |
Regulatory Engagement and the Moma Implementation Agreement
An aspect of Kenmare's situation that has received relatively limited attention in market commentary is the ongoing engagement with the government of Mozambique regarding the Moma mine's implementation agreement. This agreement governs the legal and fiscal framework under which Kenmare operates, and renegotiations or amendments can have long-term implications for operating costs, royalty obligations, and operational certainty.
Management has reported constructive engagement with the Mozambican government throughout H1 2026, with significant progress made on key issues in recent weeks. While the specific terms under discussion have not been publicly disclosed, the fact that progress has been characterised as meaningful suggests that the two parties are navigating toward resolution. For a single-asset producer operating in an emerging market jurisdiction, clarity on the implementation agreement framework represents an important element of long-term investment risk management.
The Two-Year Decline Trajectory: Context for Recovery Expectations
It is worth situating H1 2026 within the broader multi-year financial trajectory to properly calibrate recovery expectations. According to Mining Weekly's coverage of the results, Kenmare weak market conditions financial performance has been a defining theme across consecutive reporting periods.
| Period | Revenue | Adjusted EBITDA | Key Factor |
|---|---|---|---|
| FY 2025 | $312.1M (-20% YoY) | Fell 63% YoY | Pricing deterioration begins |
| H1 2026 | $134.5M (-16% YoY) | $4.4M | Pricing + operational headwinds |
The two consecutive years of significant revenue decline confirm that Kenmare's current challenges reflect a sustained market correction rather than an isolated event. Mineral sands pricing cycles have historically lasted three to five years from peak to recovery, meaning that the current trough, which intensified through 2025 and into 2026, may have further to run before a sustained recovery in ilmenite pricing takes hold.
This context does not diminish the significance of the zircon recovery signal or the operational progress at WCP A. However, it does suggest that investors expecting a rapid return to 2024-level financial performance may be working with an optimistic timeline. The more defensible recovery scenario is a gradual improvement in H2 2026 financial performance driven by zircon pricing, product mix, and volume growth, followed by a more material recovery contingent on ilmenite market rebalancing.
Disclaimer: This article contains forward-looking statements and financial projections based on publicly available information as of August 2026. Mineral commodity markets are inherently volatile and unpredictable. Nothing in this article constitutes financial advice. Investors should conduct their own due diligence and consult qualified financial advisers before making investment decisions.
Frequently Asked Questions: Kenmare Weak Market Conditions and Financial Performance
What caused Kenmare's revenue to fall 16% in H1 2026?
The primary driver was a 26% year-on-year decline in the average price received per tonne of mineral products, reflecting persistent weakness across titanium feedstock markets, particularly for ilmenite. Lower production volumes due to WCP A commissioning delays and geological grade decline at Namalope compounded the pricing impact, though the revenue decline was predominantly price-driven rather than volume-driven.
How significant is the EBITDA compression compared to prior periods?
Adjusted EBITDA of $4.4 million in H1 2026 compares to $47.2 million in H1 2025 on an adjusted basis, excluding a $100.3 million impairment charge recorded in that period. This represents a 91% reduction in EBITDA, illustrating the operating leverage inherent in mineral sands production when prices fall toward or below cash costs.
Is Kenmare at risk of a liquidity crisis?
Available information indicates that Kenmare retains meaningful liquidity through its $230 million revolving credit facility, amended financial covenants, and cash generation from shipment performance and inventory drawdown. Net debt of $175.8 million at June 30, 2026 is elevated, but the lender community's willingness to upsize the facility by $30 million provides a credibility signal regarding the perceived quality of the underlying asset.
What does the WCP A mine path transition mean for future production?
As WCP A completes its traversal of the Namalope deposit and transitions to a new mine path, ore grades are expected to improve from the trough levels experienced in H1 2026. This geological transition is the primary reason why near-term production guidance has been moderated while longer-term production capacity remains intact. The new mine path should ultimately deliver higher-grade ore than the tail-end of Namalope.
Why is the zircon market recovery particularly important for Kenmare?
Zircon commands a significantly higher price per tonne than ilmenite in normal market conditions, meaning its contribution to blended average revenue per tonne is disproportionate to its volume share. Furthermore, a strengthening zircon market improves Kenmare's revenue mix and overall financial performance without requiring additional capital investment or production growth, making it one of the most efficient near-term financial levers available to the business. For additional context on Kenmare's performance metrics and key indicators, the company's investor KPI disclosures provide a useful historical reference.
Want to Spot the Next Major Mineral Discovery Before the Market Does?
Discovery Alert's proprietary Discovery IQ model scans ASX announcements in real time, delivering actionable alerts on significant mineral discoveries — including those spanning commodities like titanium feedstocks, zircon, and rutile — so investors can act ahead of the broader market. Explore historic examples of discoveries that generated exceptional returns and begin a 14-day free trial to gain a genuine market-leading edge.