July 24, 2026
The global energy transition has created unprecedented dependencies on critical mineral supply chains, with Argentina and Chile supplying 97% of US lithium imports according to the latest USGS data. This concentration represents one of the most significant strategic vulnerabilities in the clean energy infrastructure, fundamentally altering traditional resource security calculations as nations race toward electrification.
How Dependent is the United States on South American Lithium Supply?
Current Import Dependency Statistics and Market Share Analysis
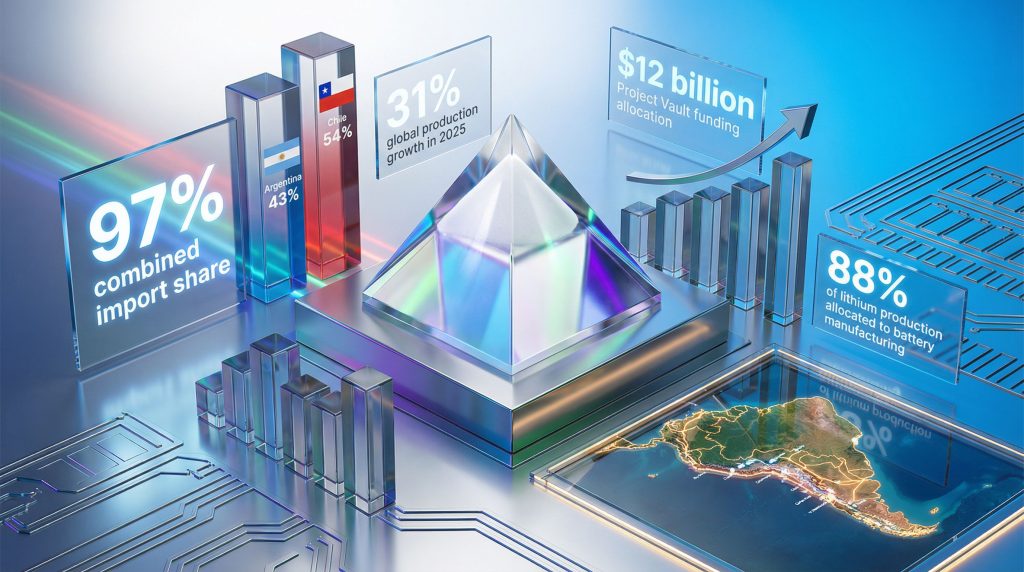
The United States demonstrates remarkable concentration in its lithium sourcing, with Argentina and Chile supplying 97% of US lithium imports according to the USGS Mineral Commodity Summaries 2026. This dependency breaks down to Argentina providing 43% and Chile contributing 54% of total import volumes, creating what analysts describe as a dual-source concentration risk unprecedented among critical minerals energy transition.
Global lithium production excluding US domestic output reached approximately 290,000 tonnes in 2025, representing a substantial 31% increase from 2024's 222,000 tonnes. This production surge occurred alongside a 20% consumption increase year-over-year, indicating tight supply-demand fundamentals despite capacity expansions.
The scale of battery sector dominance becomes clear when examining end-use allocation. Furthermore, 88% of global lithium production was directed toward battery manufacturing in 2025. Secondary applications included ceramic and glass refinement (4%), lubricating greases (2%), air treatment (2%), and medical applications comprising the remainder.
| Application Sector | Percentage Share | Volume (tonnes) |
|---|---|---|
| Battery Manufacturing | 88% | ~255,200 |
| Ceramic & Glass | 4% | ~11,600 |
| Lubricating greases | 2% | ~5,800 |
| Air Treatment | 2% | ~5,800 |
| Other (Medical, etc.) | 4% | ~11,600 |
US domestic production remained constrained to a single commercial-scale brine operation in Nevada. However, two undisclosed companies producing lithium carbonate, lithium chloride, and lithium hydroxide from both domestic and imported feedstock. This limited domestic capacity underscores the strategic significance of South American import concentration.
The metric confusion inherent in lithium reporting creates additional complexity for strategic planners. In addition, one tonne of lithium metal equals 5.28 tonnes of lithium carbonate equivalent (LCE), the industry standard measurement. Argentina's production increase from 13,800 tonnes lithium metal in 2024 to 23,000 tonnes in 2025 translates to approximately 73,000 tonnes LCE growing to 121,440 tonnes LCE, representing a 66% annual increase.
Strategic Vulnerability Assessment for Critical Battery Supply Chains
Supply chain vulnerability extends beyond raw material extraction into processing bottlenecks that amplify import dependency risks. Consequently, China controls more than 60% of global lithium processing capacity, creating downstream dependency despite upstream sourcing from South America.
This processing concentration means the US lacks meaningful lithium refining infrastructure. Furthermore, forcing reliance on Chinese facilities to convert raw lithium carbonate and spodumene concentrates into battery-grade materials. The vulnerability operates across three critical nodes:
• Raw material extraction: 97% import dependency from two countries
• Intermediate processing: Chinese processing dominance exceeding 60%
• Battery cell manufacturing: Limited US capacity with significant foreign partnerships
Battery recycling infrastructure development accelerated during 2025, with partnerships forming between automotive manufacturers and recycling companies. However, recycling cannot meaningfully offset primary lithium demand until sufficient end-of-life battery volumes accumulate over the coming decade.
The USGS assessment emphasises geopolitical alignment advantages in raw material sourcing. Despite processing vulnerabilities, Argentina and Chile represent politically stable suppliers aligned with US strategic interests, contrasting with Chinese-aligned African suppliers in Zimbabwe and Mali.
Emergency supply protocols remain underdeveloped compared to petroleum strategic reserves. The Project Vault initiative, allocated $12 billion in funding, represents the most significant federal commitment to critical mineral supply security, though specific lithium stockpiling targets remain classified.
Comparative Analysis: US vs. Global Lithium Import Patterns
Global lithium reserve distribution reveals Argentina and Chile's combined 36% share of world reserves, positioning them ahead of Australia's 22.7% and China's 12.4%. This geographic concentration creates both opportunity and risk for importing nations worldwide.
| Country | Reserve Share | Geopolitical Alignment | Production Method |
|---|---|---|---|
| Australia | 22.7% | US-aligned | Hard-rock spodumene |
| Argentina | ~18%* | US-aligned | Brine extraction |
| Chile | ~18%* | US-aligned | Brine extraction |
| China | 12.4% | Strategic competitor | Mixed methods |
| Others | ~29% | Varied | Various |
*Combined Argentina-Chile total of 36% split approximately equally
Resource assessments beyond economically viable reserves show even greater South American dominance. The Lithium Triangle (Argentina, Chile, Bolivia) contains 64 million tonnes of lithium resources, exceeding China's 10 million tonnes by more than six-fold.
Geopolitical analysis suggests more than 90% of global lithium reserves are located in countries closer to US strategic interests than Chinese influence. This includes established allies (Australia, Canada, Chile) and partners (Argentina, Brazil) versus Chinese-aligned suppliers in Africa and some Asian markets.
European Union import patterns show similar South American dependency. However, with greater diversification efforts through Australian suppliers and African development partnerships. Japan and South Korea pursue alternative strategies including strategic reserves and battery recycling investments to reduce import vulnerability.
When big ASX news breaks, our subscribers know first
What Makes Argentina and Chile Dominant Lithium Suppliers to the US Market?
Geological Advantages of the South American Lithium Triangle
The Andes high plateau region contains unique geological formations that create ideal conditions for lithium extraction through natural concentration processes spanning millions of years. Salt-flat deposits (salares) in Argentina and Chile represent the world's most cost-effective lithium resources due to specific hydrogeological advantages.
Argentina's production surge validates geological potential. Furthermore, with output increasing from 13,800 tonnes lithium metal (approximately 73,000 tonnes LCE) in 2024 to 23,000 tonnes lithium metal (121,440 tonnes LCE) in 2025. This 66% annual growth exceeded most industry projections and positioned Argentina for continued ranking improvements among global producers, as detailed in our argentina lithium brine insights analysis.
The South American Lithium Triangle (Argentina, Chile, Bolivia) contains 64 million tonnes of lithium resources, representing the world's largest concentration of economically viable deposits. These formations result from specific geological processes:
• Andean uplift: Mountain formation created closed basins capturing lithium-rich groundwater
• Arid climate conditions: High evaporation rates naturally concentrate brines
• Quaternary lacustrine deposits: Ancient lake beds containing dissolved lithium salts
• Hydrogeological stability: Consistent brine flow supporting sustained extraction
Brine extraction methods offer significant advantages over hard-rock spodumene mining. Energy requirements remain minimal through passive evaporation pond systems, while hard-rock operations require energy-intensive crushing, flotation, and thermal processing.
Despite arid surface conditions, subsurface brine reserves provide direct access to lithium-bearing fluids, reducing processing complexity compared to ore concentration and chemical extraction methods.
Major deposits driving US import dependency include Chile's Atacama Salt Flat operated by SQM and Albemarle. In addition, Argentina's Olaroz-Caucharí developments in Jujuy Province, and expanding operations in Catamarga Province contributing to the documented production surge.
Production Cost Competitiveness and Processing Infrastructure
Argentina achieved the world's highest production growth rate in 2025. The USGS reported "important expansions of production capacity" completed across Argentina, Brazil, Canada, Chile, China, Mali, USA, and Zimbabwe. Argentina's 66% production increase exceeded growth rates in all other producing nations.
Cost competitiveness stems from several operational advantages inherent to South American brine operations:
Energy Efficiency Comparison:
• Brine evaporation: Passive solar energy with minimal active inputs
• Hard-rock processing: High-energy crushing and thermal treatment required
• Transportation costs: Proximity to US markets reduces logistics expenses
• Infrastructure maturity: Established processing facilities and supply chains
Production expansion timelines indicate sustained growth potential. Unlike other producing regions where price volatility forced project delays and closures, Argentina maintained operational expansion throughout the 2023-2024 price depression period.
Processing infrastructure development accelerated during 2025, with new facilities coming online to handle increased brine extraction volumes. The integration of extraction and processing operations within Argentina provides supply chain control advantages over competitors requiring separate mining and processing phases.
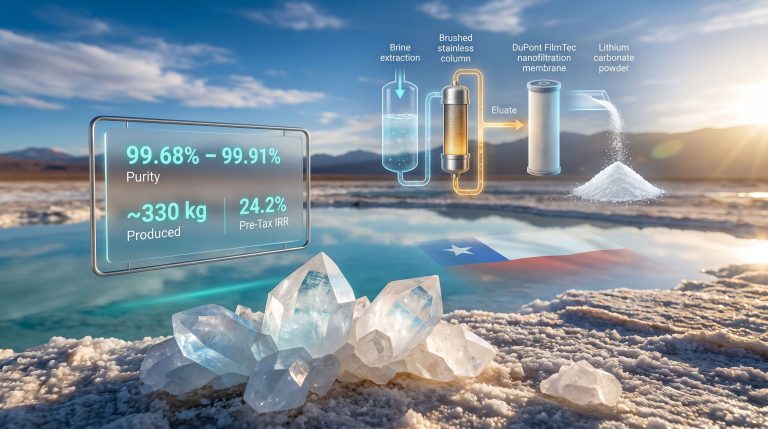
Furthermore, quality specifications for battery-grade lithium require precise chemical composition control, achieved more readily through brine processing than hard-rock concentration methods. South American operations can produce lithium carbonate and lithium hydroxide meeting automotive battery specifications without additional purification steps common in other extraction methods.
Trade Relationship Dynamics and Logistical Efficiency
Geographic proximity between South American producers and US consumption centres creates logistical advantages that reinforce supply relationship stability. Shipping distances from Chilean and Argentine ports to US Gulf Coast facilities provide cost and time advantages over Australian or African alternatives.
Trade agreement frameworks between the United States and both Argentina and Chile facilitate streamlined import procedures and reduce regulatory barriers. These established commercial relationships provide predictability for long-term supply contracts essential to battery manufacturing planning.
| Supply Route | Transit Time | Shipping Cost | Regulatory Complexity |
|---|---|---|---|
| Argentina-US Gulf | 14-18 days | Low | Established framework |
| Chile-US West Coast | 12-16 days | Low | USMCA integration |
| Australia-US | 20-25 days | Higher | Additional compliance |
| Africa-US | 25-30 days | Highest | Emerging frameworks |
Currency relationship dynamics provide additional stability. Both Argentina and Chile maintain dollar-linked trade mechanisms that reduce foreign exchange risk in lithium transactions, supporting price stability for US importers.
Port infrastructure development in South America specifically supports lithium export capacity. Chilean and Argentine facilities have invested in specialised handling equipment and storage capacity designed for lithium compound transportation requirements.
How Does US Lithium Import Concentration Compare to Other Critical Minerals?
USGS Critical Minerals List: Import Dependency Rankings
The USGS Mineral Commodity Summaries 2026 examined 84 mineral commodities, significantly expanding beyond the 24 minerals comprising the most recent official Critical Minerals List. This comprehensive assessment places lithium among minerals where imports exceed 50% of domestic consumption, triggering strategic vulnerability classifications.
Lithium's 97% import dependency from two countries represents extreme concentration even within the critical minerals category. Comparative analysis reveals varying dependency patterns across strategic materials:
Critical Mineral Import Dependency Rankings:
• Rare earth elements: >90% from China (single-source concentration)
• Lithium: 97% from Argentina/Chile (dual-source concentration)
• Cobalt: ~80% from Democratic Republic of Congo (single-source concentration)
• Graphite: >70% from China (single-source concentration)
• Nickel: ~40% from multiple sources (distributed sourcing)
The assessment methodology considers both import percentage and source concentration when evaluating strategic vulnerability. Lithium's dual-source dependency creates different risk profiles than single-source concentrations, providing some supply chain resilience through supplier diversification within the South American region.
Geographic clustering of lithium suppliers in South America presents unique risk characteristics. Unlike rare earth elements where Chinese dominance spans both reserves and processing, lithium vulnerability concentrates in geologically stable, politically aligned nations with established US trade relationships.
Strategic Risk Assessment Across 84 Mineral Commodities
The expanded USGS analysis incorporates insights from the Departments of State, Defense, Energy, and Interior to assess strategic vulnerability across mineral categories. This interagency approach evaluates multiple risk factors beyond simple import dependency percentages.
Multi-factor Risk Assessment Criteria:
• Import concentration levels and source country diversification
• Substitute material availability and technological feasibility
• Stockpile adequacy and strategic reserve maintenance
• Allied nation production capacity and reliability
• Supply chain disruption historical precedent
Lithium demonstrates mixed vulnerability characteristics when assessed across these dimensions. High import concentration and limited substitute availability create significant risk, while geopolitical alignment with suppliers and expanding allied production capacity provide mitigation factors.
Processing bottlenecks emerge as critical vulnerability amplifiers across multiple mineral categories. Chinese processing dominance affects lithium (>60%), rare earths (>90%), and graphite (>70%), creating common chokepoints despite diverse raw material sourcing strategies.
Strategic stockpile requirements vary significantly across mineral categories based on consumption patterns and supply chain lead times. Lithium's rapid consumption growth and limited recycling availability necessitate larger strategic reserves relative to consumption than materials with established circular economy infrastructure.
Comparative Vulnerability: Lithium vs. Rare Earth Elements
Rare earth elements represent the benchmark case for critical mineral supply chain vulnerability, with Chinese dominance spanning mining, processing, and manufacturing applications. Lithium presents contrasting vulnerability patterns that illuminate different strategic risk management approaches.
Supply Chain Control Comparison:
| Element | Mining Control | Processing Control | Manufacturing Integration |
|---|---|---|---|
| Rare Earths | China: ~70% | China: >90% | China: >80% |
| Lithium | Argentina/Chile: 97% (US imports) | China: >60% | Distributed globally |
Chinese strategy toward lithium differs markedly from rare earth market control. Rather than dominating upstream production, China focuses on processing capacity and downstream battery manufacturing, creating different strategic vulnerabilities and opportunities for Western nations.
Reserve distribution advantages favour Western interests more strongly in lithium than rare earths. The USGS assessment indicates more than 90% of lithium reserves are located in countries geopolitically aligned with US interests, compared to Chinese control of approximately 70% of rare earth reserves.
Substitution possibilities provide another differentiation factor. Rare earth elements often lack viable alternatives for specific high-technology applications, while lithium faces emerging competition from sodium-ion battery technologies, though with significant performance trade-offs.
What Are the Economic Implications of This Supply Chain Concentration?
Price Volatility Analysis: 2023-2025 Market Dynamics
Lithium markets experienced dramatic price swings that demonstrate the economic consequences of concentrated supply chains combined with rapidly growing demand. The price trajectory from 2021 peaks through 2024 lows and subsequent 2025 recovery illustrates vulnerability to market manipulation and supply disruption.
Between 2021 and early 2023, surging electric vehicle demand drove lithium prices to historic peaks before experiencing a severe correction through 2024. This volatility pattern reflected insufficient supply chain elasticity to respond rapidly to demand fluctuations, characteristic of concentrated supplier markets, as explored in our comprehensive lithium market downturn analysis.
2025 Price Recovery Indicators:
• China spot carbonate price increased 11% through November 2025
• Spodumene concentrate prices rose 21% during the same period
• Annual spot price gains reached 88% over twelve-month periods
• Price recovery outpaced gold appreciation by significant margins
The considerable growth in Chinese and European electric vehicle sales, combined with increased demand for grid-scale energy storage systems, contributed to the lithium price recovery in the second half of 2025. This demand acceleration occurred despite previous predictions of oversupply conditions.
Market psychology shifted as industry analysts recognised that Chinese price depression strategies from early 2023 through 2024 were reaching exhaustion. According to industry experts, 2025-2026 represents the critical period when artificial price suppression would prove unsustainable.
However, spot lithium price increases of 21% year-to-date and 88% over the trailing twelve months substantially exceeded gold's 17% and 75% gains over identical periods. This outperformance indicates fundamental supply-demand tightening beyond speculative trading activity.
Impact on US Electric Vehicle Manufacturing Costs
Electric vehicle manufacturing cost structures demonstrate significant sensitivity to lithium price volatility due to battery pack cost components. Lithium typically represents 15-20% of total battery cell costs, creating direct transmission of commodity price changes to vehicle production economics.
Battery Cost Structure Analysis:
• Lithium compounds: 15-20% of cell costs
• Processing and manufacturing: 35-40% of cell costs
• Other materials (cobalt, nickel, graphite): 25-30% of cell costs
• Labour and overhead: 10-15% of cell costs
Import dependency amplifies cost volatility through currency exchange rate exposure and transportation cost variations. The 97% import reliance from Argentina and Chile creates dual exposure to South American economic conditions and global shipping cost fluctuations.
Automotive manufacturers respond to lithium price volatility through long-term supply contracts and vertical integration strategies. However, the limited number of suppliers constrains negotiating leverage and forces acceptance of pricing terms favouring producers.
Battery recycling initiatives gain economic attractiveness as primary lithium costs increase. The construction of recycling facilities accelerated during 2025, with partnerships between automakers and recycling companies targeting cost reduction and supply chain independence.
Manufacturing location decisions increasingly incorporate lithium supply chain proximity considerations. US battery manufacturing investments consider transportation costs and supply security from South American sources when evaluating facility locations.
Strategic Reserve Requirements and Project Vault Initiative
The Project Vault initiative represents the most ambitious US federal commitment to critical mineral supply security. Furthermore, with $12 billion in allocated funding designed to guarantee strategic mineral provision through minimum price guarantees and strategic stockpile accumulation.
Strategic reserve sizing calculations for lithium must account for rapid consumption growth and limited recycling capacity during the initial electric vehicle adoption phase. Unlike petroleum reserves supporting relatively stable consumption patterns, lithium requirements continue expanding exponentially.
Reserve Sizing Considerations:
• Annual consumption growth rates exceeding 20%
• Limited domestic production capacity expansion timelines
• Recycling infrastructure development lag times
• Geopolitical supply disruption scenario planning
• Industrial capacity maintenance requirements
The Strategic Petroleum Reserve model provides limited guidance for lithium stockpiling due to fundamental differences in consumption patterns and supply chain structure. Petroleum reserves target temporary supply disruptions, while lithium reserves must bridge longer-term capacity development periods.
Cost-benefit analysis of strategic reserves must weigh storage and inventory carrying costs against supply security benefits. Lithium compounds require specialised storage conditions and periodic quality testing, creating ongoing operational expenses beyond initial procurement costs.
Private sector coordination mechanisms enable government strategic reserves to complement commercial inventory management. Public-private partnerships can leverage federal funding to accelerate domestic capacity development while maintaining competitive market dynamics.
How is Global Lithium Production Reshaping Supply Chain Dynamics?
Production Growth Analysis by Country (2024-2025 Performance)
Global lithium production expansion during 2025 reached unprecedented levels, with world output excluding US domestic production increasing 31% to approximately 290,000 tonnes from 2024's 222,000 tonnes. This growth occurred despite previous industry predictions of oversupply conditions and price depression effects.
Argentina led global production growth with a 66% increase from 13,800 tonnes lithium metal (73,000 tonnes LCE) in 2024 to 23,000 tonnes lithium metal (121,440 tonnes LCE) in 2025. The USGS revised 2024 production data upward, confirming Argentina's emergence as a major global supplier.
2025 Production Growth by Major Producers:
| Country | 2024 Production | 2025 Production | Growth Rate | Method |
|---|---|---|---|---|
| Argentina | 73,000 tonnes LCE | 121,440 tonnes LCE | +66% | Brine |
| Australia | Data withheld | Data withheld | Moderate growth | Hard-rock |
| Chile | Data withheld | Data withheld | Steady expansion | Brine |
| China | Data withheld | Data withheld | Capacity additions | Mixed |
| Zimbabwe | Data withheld | Data withheld | Significant growth | Hard-rock |
The USGS reported "important expansions of production capacity were completed in Argentina, Brazil, Canada, Chile, China, Mali, USA and Zimbabwe" during 2025, indicating broad-based global capacity additions across multiple producing regions and extraction methodologies.
Production resilience during the 2023-2024 price depression period demonstrated varying operational cost structures across global suppliers. Argentina maintained expansion investments throughout the downturn, while other regions experienced project delays and temporary shutdowns, creating competitive positioning advantages.
Despite Argentina's rapid growth, the country has not yet surpassed Australia, China, Chile, and Zimbabwe in absolute production volumes. However, projections indicate Argentina could advance in global rankings during 2026 and subsequent years due to continued ramp-up of existing projects and new operations entering production.
Emerging Suppliers: Zimbabwe, Mali, and African Market Entry
African lithium production expansion represents a significant shift in global supply chain geography, with Zimbabwe and Mali emerging as substantial contributors to world output during 2025. These developments alter traditional South American and Australian supply dominance patterns.
Zimbabwe's production growth accelerated through Chinese investment partnerships and infrastructure development supporting hard-rock spodumene extraction. The Great Dyke geological formation provides substantial lithium resources amenable to large-scale mining operations.
Mali's entry into commercial lithium production through the Goulamina project demonstrates Chinese strategic investments in African mineral development. These partnerships create alternative supply chains potentially competing with established South American and Australian operations.
African Production Characteristics:
• Hard-rock spodumene extraction requiring higher processing costs
• Chinese partnership and investment predominance
• Infrastructure development requirements for export capability
• Geopolitical alignment considerations affecting market access
The emergence of African suppliers creates supply chain diversification opportunities for consuming nations while potentially introducing new geopolitical complexity. Chinese influence in African lithium development contrasts with Western alignment in South American production.
Production cost comparisons between African hard-rock operations and South American brine extraction reveal different economic optimisation strategies. Higher African production costs may be offset by Chinese processing integration and strategic supply chain control objectives.
China's Processing Dominance vs. Raw Material Dependency
China's lithium strategy demonstrates sophisticated supply chain control through downstream processing dominance rather than upstream mining control. With more than 60% of global lithium processing capacity, China leverages conversion capabilities to maintain strategic influence despite limited domestic reserves.
This processing bottleneck creates vulnerability for Western nations even when sourcing raw materials from aligned suppliers. Argentina and Chilean lithium carbonate requires Chinese processing to achieve battery-grade specifications for most applications.
Chinese Strategic Positioning:
• Processing capacity: >60% of global refining capability
• Domestic reserves: 12.4% of global total (relatively limited)
• Raw material imports: Substantial dependence on Australian spodumene
• Technology development: Advanced battery manufacturing integration
The Chinese approach contrasts with rare earth element strategy, where upstream mining control provides comprehensive supply chain dominance. Lithium processing concentration creates different leverage points and competitive dynamics.
Chinese investment in African lithium mining (Zimbabwe, Mali) represents efforts to secure upstream raw material supply while maintaining downstream processing control. This vertical integration strategy reduces dependency on Australian and South American suppliers.
Processing technology advantages enable China to maintain market influence despite weaker reserve positions. Advanced lithium hydroxide production capabilities and quality control systems create barriers for competing processing development.
What Diversification Strategies is the US Pursuing for Lithium Security?
Domestic Production Expansion: Nevada Operations and Future Projects
US domestic lithium production remains constrained to one commercial-scale brine operation in Nevada, highlighting the limited scope of current domestic capability relative to consumption requirements. Two American companies produce lithium carbonate, chloride, and hydroxide from both domestic brine and imported raw materials, demonstrating hybrid sourcing strategies.
Nevada's lithium potential centres on the thacker pass lithium project, which represents the most significant domestic development initiative. Upon completion, this project would address approximately 5-7% of US lithium import needs, illustrating the scale challenges facing domestic supply development.
Domestic Production Development Challenges:
• Environmental permitting complexity and timeline uncertainty
• Indigenous land rights consultation and approval processes
• Water rights allocation in arid regions with competing uses
• Infrastructure development requirements for remote locations
• Economic competitiveness compared to South American brine operations
The Salton Sea region in California presents additional domestic production potential through geothermal brine extraction. This approach combines renewable energy production with lithium recovery, creating potentially attractive economics and environmental profiles.
Permitting timeline extensions continue to delay domestic project development, with regulatory review processes often requiring multiple years for final approval. These delays perpetuate import dependency and limit strategic supply chain diversification progress.
Capital intensity requirements for domestic lithium development exceed South American brine operations due to higher labour costs, environmental compliance standards, and infrastructure development needs. Federal support through Project Vault funding aims to address economic competitiveness challenges.
Strategic Partnership Development with Allied Nations
Recent critical minerals alliances include Argentina as a key partner, recognising South American supply chain importance while seeking to strengthen bilateral cooperation frameworks beyond simple commercial relationships. These partnerships reflect the strategic importance of maintaining access to essential battery materials.
Australia represents the most significant allied nation lithium partnership opportunity, with substantial hard-rock spodumene reserves and established mining expertise. Australian operations provide supply chain diversification from South American brine sources while maintaining geopolitical alignment, supporting australia lithium innovations development.
Allied Nation Partnership Framework:
• Australia: Hard-rock lithium mining and processing development
• Canada: Domestic production expansion and processing capability
• Chile: Enhanced bilateral trade agreements and investment protection
• Argentina: Strategic partnership formalisation and infrastructure support
Canadian lithium development initiatives receive US government support through bilateral cooperation agreements and cross-border investment facilitation. Quebec and Ontario provinces contain lithium deposits amenable to North American supply chain integration.
Processing capacity development represents critical partnership requirements beyond raw material production. Allied nations must develop lithium refining capabilities to reduce Chinese processing dependency and create vertically integrated Western supply chains.
Technology sharing agreements enable allied nations to accelerate domestic lithium development through shared expertise and reduced development risks. US mining technology and processing equipment exports support partner nation capacity building.
Investment protection and financing mechanisms provide security for multinational lithium development projects spanning multiple allied nations. Government-backed financing reduces private sector risk and accelerates project development timelines.
Battery Recycling Infrastructure Investment and Circular Economy Initiatives
Battery recycling plant construction accelerated significantly during 2025, with partnerships forming between automotive manufacturers and recycling companies to address long-term supply chain security. This infrastructure development targets eventual import dependency reduction through circular economy approaches.
Current recycling capacity remains insufficient to meaningfully impact primary lithium demand. Electric vehicle adoption continues expanding faster than end-of-life battery availability. However, recycling will become more significant as EV fleets mature over the coming decade.
Recycling Infrastructure Development:
• Automotive manufacturer partnerships with recycling companies
• Federal funding support for recycling facility construction
• Technology development for improved lithium recovery rates
• Logistics systems for used battery collection and processing
• Quality standards for recycled lithium in new battery production
Economic viability of battery recycling improves as primary lithium costs increase, creating market-driven incentives for circular economy investment. Recycling becomes cost-competitive with primary production at higher price levels.
Recycling technology development focuses on improving lithium recovery rates and reducing processing costs. Advanced separation techniques and chemical recovery processes aim to achieve higher yields from used battery materials.
Regulatory frameworks for battery recycling continue evolving. Potential mandates for recycled content in new batteries and extended producer responsibility requirements for automotive manufacturers and battery producers are under consideration.
Supply chain integration between recycling and manufacturing requires coordination across multiple industry participants. Automotive companies, battery manufacturers, and recycling facilities must develop seamless material flow systems.
The next major ASX story will hit our subscribers first
How Do Reserve Distributions Impact Long-term Strategic Planning?
Global Lithium Reserve Analysis: Geographic Distribution Patterns
Global lithium reserves demonstrate significant geographic concentration. Argentina and Chile controlling a combined 36% share of world reserves, positioning South America as the dominant long-term supply region. This concentration creates both strategic opportunities and dependency risks for consuming nations.
Australia maintains 22.7% of global reserves through hard-rock deposits. This provides the largest individual nation reserve base but requiring more energy-intensive extraction methods than South American brine operations. China holds 12.4% of reserves, creating strategic vulnerability for Western supply chains.
Global Reserve Distribution:
| Region | Reserve Share | Extraction Method | Geopolitical Alignment |
|---|---|---|---|
| South America | 36% | Brine (low cost) | US-aligned |
| Australia | 22.7% | Hard-rock (higher cost) | US-aligned |
| China | 12.4% | Mixed methods | Strategic competitor |
| Other regions | ~29% | Various | Mixed alignment |
The distinction between reserves (economically extractable at current prices) and resources (identified but not economically viable) reveals even greater South American advantages. The Lithium Triangle contains 64 million tonnes of resources, exceeding China's 10 million tonnes by more than six-fold.
Reserve quality assessments favour South American deposits due to brine extraction cost advantages and processing efficiency. Higher-grade brines require less processing to achieve battery-grade specifications, creating sustainable cost competitiveness over alternative sources.
Long-term planning must account for reserve development timelines and infrastructure requirements. South American deposits offer shorter development periods and lower capital intensity compared to hard-rock alternatives, supporting faster capacity expansion.
Resource Quality Assessment: Brine vs. Hard Rock Operations
Lithium extraction methodology fundamentally determines operational economics and scalability potential. Furthermore, brine operations demonstrating significant advantages over hard-rock mining across multiple performance metrics.
Operational Comparison: Brine vs. Hard-Rock:
Brine Operations (Argentina/Chile):
• Energy requirements: Minimal (passive solar evaporation)
• Water usage: High evaporation rates but closed-loop systems
• Processing complexity: Direct precipitation to battery-grade compounds
• Capital intensity: Lower infrastructure requirements
• Environmental impact: Surface disruption in remote salt flats
Hard-Rock Operations (Australia/Africa):
• Energy requirements: High (crushing, flotation, thermal processing)
• Water usage: Significant freshwater requirements for processing
• Processing complexity: Multi-stage concentration and chemical treatment
• Capital intensity: Higher infrastructure and equipment costs
• Environmental impact: Underground/open-pit mining disruption
Lithium concentration levels in high-quality brines exceed 1,000 mg/L in premium South American deposits. Consequently, spodumene ore grades typically ranging 1-2% lithium oxide content. Higher brine concentrations reduce processing costs and improve recovery rates.
Processing time differences create inventory and working capital advantages for brine operations. Evaporation pond systems require 12-18 months for initial production but provide continuous output, while hard-rock operations involve batch processing with higher variability.
Scalability potential differs significantly between extraction methods. Brine operations can expand through additional pond construction with relatively low incremental capital requirements, while hard-rock mining requires proportional increases in expensive processing equipment.
Environmental permitting and community relations present different challenges for each extraction method. Brine operations typically occur in remote, arid regions with minimal population impact, while hard-rock mining often affects established communities and ecosystems.
Exploration Pipeline and Future Supply Potential
Global lithium exploration activity continues expanding as demand projections support higher long-term prices and improved project economics. The exploration pipeline indicates substantial future supply potential, though development timelines extend multiple years.
South American exploration focuses on expanding known salt flat deposits and identifying additional brine resources in the Andes plateau region. Advanced exploration techniques including remote sensing and geochemical analysis accelerate prospect identification.
Exploration Pipeline by Region:
• Argentina: Multiple salt flat prospects under evaluation
• Chile: Expansion of existing deposits and new concession areas
• Australia: Hard-rock deposit development and processing optimisation
• North America: Nevada, California, and Canadian prospect advancement
• Africa: Zimbabwe and Mali expansion plus new country entry
Technology development enables previously uneconomic deposits to achieve commercial viability. Enhanced brine processing methods and improved hard-rock extraction efficiency expand the economic resource base.
Exploration success rates remain high for lithium projects due to established geological understanding. However, permitting and development timelines often extend 5-10 years from discovery to commercial production, creating inevitable supply lag periods.
Resource development priorities increasingly consider processing integration and supply chain security alongside traditional economic metrics. Projects offering vertical integration opportunities and aligned geopolitical positioning receive preferential development attention.
The concentration of Argentina and Chile supplying 97% of US lithium imports represents both a strategic vulnerability and an opportunity for enhanced cooperation with aligned nations. As global demand accelerates, the importance of these relationships will only intensify, making strategic diversification and domestic capacity development increasingly critical for long-term energy security. The ongoing developments in battery recycling, domestic production, and processing capabilities will determine how successfully the US can reduce this dependency while maintaining the competitive advantages that South American suppliers currently provide.
Understanding these dynamics becomes essential as the energy transition accelerates. For additional insights on global lithium supply developments, consult the US Energy Information Administration comprehensive mineral commodity summaries that track these critical supply chain relationships in detail.
Looking to Invest in the Next Major Lithium Discovery?
With Argentina and Chile controlling 97% of US lithium imports and global production expanding by 31% in 2025, positioning yourself ahead of significant lithium discoveries has never been more crucial. Discovery Alert's proprietary Discovery IQ model delivers real-time alerts on major ASX mineral discoveries, including lithium projects that could benefit from this unprecedented demand surge. Begin your 14-day free trial today to gain the market-leading advantage in identifying actionable opportunities before the broader market responds.