August 24, 2026
When Commodity Cycles Turn: Understanding the Asymmetric Power of Lithium Price Recoveries
Commodity markets have a well-documented tendency to punish patience and reward resilience. Lithium, perhaps more than any other battery mineral, epitomises this dynamic. The 2023–2025 lithium market downturn erased billions in market capitalisation across the sector, forced high-cost producers into care and maintenance, and pushed even well-capitalised operators deep into loss-making territory. Yet embedded within that destruction was the architecture of recovery — and FY26 has delivered that recovery with considerable force.
For investors tracking the ASX lithium sector, the FY26 financial results from Pilbara Minerals (ASX: PLS) represent more than a single company returning to profitability. They represent a structural validation point: evidence that the lithium price recovery has sufficient depth and durability to translate into real earnings, not just improved sentiment. The phrase PLS back into profit on lithium recovery encapsulates a moment the sector had been anticipating for the better part of two years.
When big ASX news breaks, our subscribers know first
The Financial Architecture of a Dramatic Turnaround
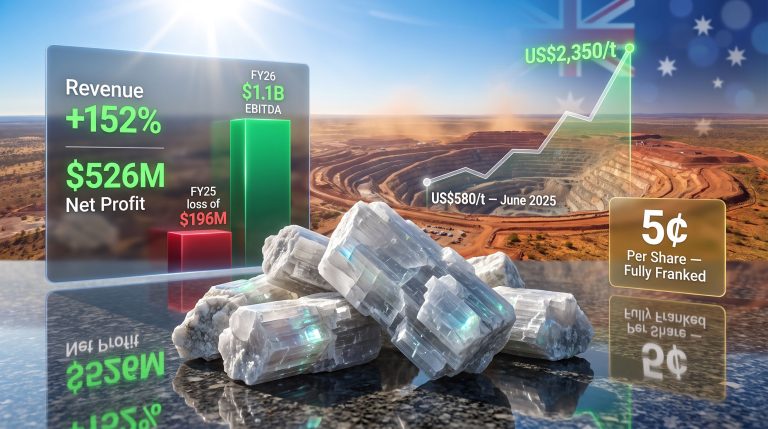
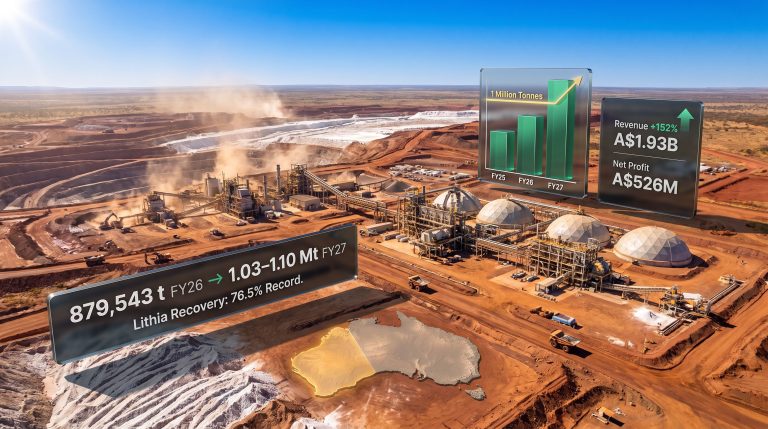
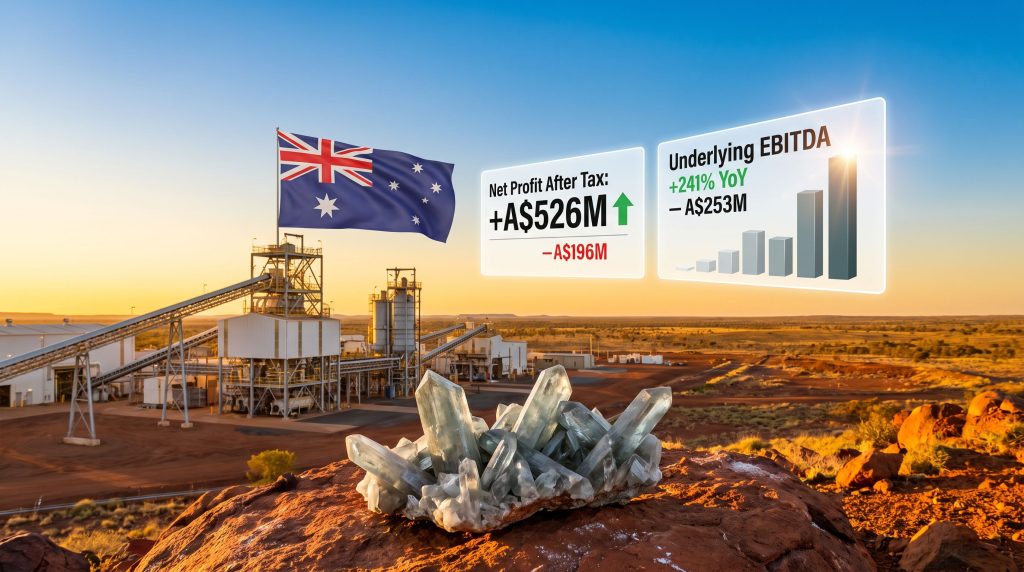
The scale of the earnings reversal at Pilgangoora is difficult to overstate. Moving from a A$196 million net loss in FY25 to a A$526 million net profit after tax in FY26 represents one of the most significant single-year earnings swings in recent ASX mining history. Full-year revenue reached A$1.93 billion, while underlying EBITDA for the first half alone surged 241% year-on-year to A$253 million.
Key Financial Snapshot: Pilbara Minerals FY26 vs FY25
| Metric | FY25 | FY26 | Change |
|---|---|---|---|
| Net Profit After Tax | -A$196M | +A$526M | Full turnaround |
| Full-Year Revenue | Lower base | A$1.93B | Record |
| Underlying EBITDA (H1) | Suppressed | A$253M | +241% YoY |
| H1 NPAT | -A$69M | +A$33M | Reversed |
| H1 Revenue | Lower base | A$624M | +47% YoY |
| Q2 Revenue | Lower base | A$373M | +49% QoQ |
| Realized Spodumene Price (Q2) | Prior quarter base | Recovered level | +57% QoQ |
What makes this turnaround analytically interesting is not just the magnitude but the mechanism. In capital-intensive hard-rock mining, fixed costs represent a significant proportion of the total cost base. Once those fixed costs are covered by revenue, incremental price gains flow disproportionately into operating earnings. This is the operating leverage effect, and it explains why EBITDA can expand by hundreds of percentage points even when revenue growth appears more modest on a percentage basis.
In commodity mining, the relationship between price recovery and earnings recovery is rarely linear. Fixed-cost structures mean that margin expansion accelerates dramatically once a producer crosses its breakeven threshold, creating the conditions for outsized earnings surprises relative to commodity price moves.
The first half of FY26 functioned as the visible inflection point. The swing from a H1 NPAT loss of A$69 million in the prior corresponding period to a H1 NPAT gain of A$33 million signalled unambiguously that the cost structure had been cleared, and that subsequent quarters would build on an already profitable base.
Three Converging Drivers Behind the Recovery
Attributing the FY26 result to a single variable would misrepresent the complexity of what actually occurred at Pilgangoora. Three distinct forces converged simultaneously, and their interaction is what amplified individual gains into a transformative earnings outcome.
Spodumene Price Rebound: The Primary Revenue Engine
Spodumene extraction at Pilgangoora produces a lithium-bearing mineral that serves as the feedstock for lithium chemical refining. Its pricing is directly tied to downstream lithium carbonate and lithium hydroxide market conditions, but with an important structural nuance: spodumene contract pricing typically operates on a lag relative to spot lithium chemical prices. This lag can range from one to three months depending on contract structures, meaning that a recovery in spot lithium carbonate prices takes time to fully flow through to a hard-rock producer's realised revenue.
In Q2 FY26, realised spodumene prices rose approximately 57% quarter-on-quarter, reflecting the unwinding of the most severe phase of the 2024–2025 price trough. This single variable was the dominant earnings catalyst, but its impact was multiplied significantly by what was happening simultaneously on the operational side.
Lithium Recovery Rates: The Often-Overlooked Margin Lever
Lithium recovery rate is one of the most consequential and least discussed metrics in hard-rock lithium operations. It refers to the percentage of lithium contained in the raw ore feed that is successfully captured in the final spodumene concentrate product after processing. At Pilgangoora, recovery rates improved into the 75%–78% range across recent quarters, a performance level that sits in the upper tier of hard-rock spodumene operations globally.
To understand why this matters so profoundly, consider the following:
- A recovery rate of 70% means 30% of the lithium in the ore is lost in the tailings stream
- Improving that rate to 78% effectively generates an additional 8 percentage points of saleable product from the same ore volume
- This improvement requires no additional ore to be mined, no additional haulage, and minimal incremental processing cost
- The additional revenue generated flows almost entirely into operating margin
Lithium Recovery Rate Performance Assessment
| Recovery Rate Range | Operational Assessment | Margin Impact |
|---|---|---|
| Below 65% | Underperforming | Significant cost drag |
| 65%–70% | Industry baseline | Moderate margins |
| 70%–75% | Competitive | Improving unit economics |
| 75%–78%+ | Strong performance | Substantial margin expansion |
The technical levers driving recovery rate improvements at Pilgangoora include flotation circuit optimisation, feed grade consistency management, reagent regime calibration, and processing plant throughput tuning. Flotation is the primary beneficiation method used in spodumene processing: crushed ore is conditioned with chemical reagents that cause lithium-bearing spodumene particles to attach to air bubbles and float to the surface, where they are collected. Small improvements in reagent chemistry, pulp density, or air flow rates can meaningfully shift recovery outcomes across an entire production period.
Recovery rate optimisation is a compounding advantage. Each percentage point of improvement that becomes embedded in standard operating procedure adds permanently to the revenue base without requiring capital expenditure or increased mining activity.
Record Production Volume: The Compounding Factor
The third driver was production volume. Record annual output at Pilgangoora meant that the price and recovery rate improvements were being applied across a larger quantity of shipped product. This compounding interaction between all three variables is what transformed what might otherwise have been a modest earnings improvement into a dramatic full-year reversal.
The Spodumene Pricing Mechanism: What Most Investors Miss
One structural characteristic of the spodumene market that is not widely understood outside specialist circles is the layered pricing relationship between spodumene concentrate, lithium carbonate equivalent (LCE), and battery-grade lithium hydroxide. Furthermore, the lithium carbonate market dynamics mean spodumene concentrate is typically quoted per tonne at a defined Li₂O content, commonly 6% Li₂O. Lower-grade concentrates trade at discounts to this benchmark, which means that ore feed grade management at the mine site has a direct and immediate impact on the price received per tonne of concentrate shipped.
Pilgangoora's ore body is notable for containing both spodumene and petalite, another lithium-bearing mineral with different chemical characteristics and end-market applications. This gives the operation a degree of product flexibility that single-mineral deposits lack, though the primary revenue driver remains spodumene concentrate sold into the lithium chemical conversion market.
Is This Recovery Structurally Durable?
Validating a single year of strong results is meaningfully different from assessing whether the conditions that generated those results will persist. A balanced assessment requires examining both the demand-side tailwinds and the supply-side risks that could moderate or reverse the current trajectory.
Structural demand drivers supporting a sustained floor include:
- Electric vehicle penetration rates continuing to expand across China, Europe, and North America, with China's NEV market having crossed 50% market share of new passenger vehicle sales in recent months
- Battery energy storage systems (BESS) emerging as a demand pillar that is structurally independent of the EV cycle, driven by grid-scale renewables integration
- Supply-side rationalisation during the 2024–2025 trough: high-cost producers curtailed or suspended operations, reducing available global supply
Supply-side risks that could temper further price appreciation include:
- Potential restart of mothballed operations if prices remain above incentive cost thresholds for several consecutive quarters
- New projects progressing through development pipelines in the Lithium Triangle (Chile, Argentina, Bolivia) and in hard-rock jurisdictions including Canada and Zimbabwe
- Chinese domestic lithium chemical production capacity, which operates with different cost structures and strategic mandates than Western commercial producers
Three Scenario Framework: Price Trajectories and Earnings Implications
| Scenario | Spodumene Price Direction | Implied EBITDA Trajectory | Key Risk Factor |
|---|---|---|---|
| Bear Case | Retreat below incentive cost | Return to losses possible | Chinese oversupply, demand miss |
| Base Case | Stabilisation at recovery levels | Sustained profitability | Balanced supply additions |
| Bull Case | Continued upward trajectory | Significant further expansion | Supply deficit deepens |
Disclaimer: Scenario modelling involves inherent uncertainty. Commodity price forecasting is subject to a wide range of macro, geopolitical, and market-specific variables. Nothing in this analysis should be construed as financial advice.
What PLS's Result Signals for the Broader ASX Lithium Sector
Pilbara Minerals analysis reveals the company's unique position in the ASX lithium landscape. As one of the sector's largest pure-play producers, its financial performance functions as a leading indicator for sector-wide earnings conditions. A return to profitability at PLS's scale validates that the lithium price recovery has crossed a threshold of commercial significance, not just a technical market bounce.
Several dynamics are worth noting for investors assessing the broader sector:
- Hard-rock producers respond faster to price recovery than brine operations because their processing cycles are shorter and their offtake contracts are repriced more frequently
- Australia's dominance in global spodumene supply positions ASX-listed operators as early-cycle beneficiaries when the lithium market turns
- Operating leverage in mining means earnings recover faster than revenue as fixed cost coverage is restored, creating conditions for earnings surprises relative to consensus expectations
- Producers that maintained operational continuity through the trough rather than suspending production are positioned to capture the full upside of recovery without the ramp-up costs and delays that come with restarting mothballed operations
The next major ASX story will hit our subscribers first
Four Metrics That Telegraph Earnings Performance Before Results Are Released
For investors who want to track Pilgangoora's financial trajectory in real time rather than waiting for half-year and full-year results, quarterly operational reports provide early signal. The four leading indicators to monitor are:
- Realised spodumene price per tonne (CIF) — the single most important revenue variable, and one that is directly disclosed in quarterly activity reports
- Lithium recovery rate (%) — the key operational efficiency metric; sustained performance above 75% indicates strong unit economics
- Tonnes of spodumene concentrate shipped — the volume indicator that, when multiplied by realised price, gives a direct revenue proxy
- All-in sustaining cost (AISC) per tonne — the margin health indicator that determines how much of the realised price converts into free cash flow
In commodity mining, quarterly operational reports often telegraph earnings outcomes weeks before financial results are released. Investors who track recovery rates and realised prices in quarterly updates gain an early signal of whether profitability is expanding or contracting, reducing reliance on consensus estimates that may lag real-time operational conditions.
Australia's Critical Minerals Sector and the Significance of a Profitable Lithium Industry
Australia's lithium industry supplies a substantial proportion of global spodumene concentrate, making the financial health of its hard-rock lithium producers directly relevant to export revenues, royalty streams, and the economic viability of downstream processing ambitions. When major producers operate at a loss, investment in beneficiation capacity, value-adding refining, and workforce development contracts. When profitability is restored, these investment decisions become commercially viable again.
The FY26 result also carries a message about asset resilience. Producers that maintained operational discipline through the trough — continuing to improve recovery rates and optimise processing efficiency rather than simply cutting costs and waiting — emerged from the downcycle with demonstrably stronger operational platforms. This approach is increasingly aligned with what institutional investors and offtake counterparties look for when assessing long-term commodity exposure.
The broader policy context around critical minerals processing, offtake arrangements, and downstream integration continues to evolve. However, the foundation for any of those ambitions rests on the commercial viability of upstream production, and FY26 has confirmed that viability in a meaningful way. For further context on global battery materials trends, the International Energy Agency's critical minerals outlook provides a useful reference point on long-term demand trajectories.
Frequently Asked Questions
What caused Pilbara Minerals to return to profit in FY26?
Three converging factors drove the turnaround: a significant recovery in realised spodumene prices (up approximately 57% quarter-on-quarter in Q2 FY26), improved lithium recovery rates at Pilgangoora reaching 75%–78%, and record annual production volumes that amplified the earnings impact of higher prices across a larger product base.
How significant was the FY26 earnings reversal?
The shift was substantial. Full-year net profit after tax reached A$526 million compared with a A$196 million loss in FY25. In the first half alone, underlying EBITDA rose 241% year-on-year to A$253 million, while H1 revenue of A$624 million represented a 47% year-on-year increase.
What is spodumene and why does its price matter to PLS?
Spodumene is a lithium-bearing silicate mineral extracted from hard-rock pegmatite deposits. When processed, it forms spodumene concentrate, typically grading at approximately 6% Li₂O, which is then sold to lithium chemical converters who refine it into battery-grade lithium carbonate or lithium hydroxide. Because spodumene concentrate is Pilbara Minerals' primary revenue-generating product, its realised price per tonne is the dominant driver of the company's top-line financial performance.
What is a lithium recovery rate and why does it affect profitability so significantly?
Lithium recovery rate measures the percentage of lithium present in the raw ore feed that is successfully captured in the final saleable concentrate product. Rates above 75% are considered operationally strong in hard-rock operations. Because recovery improvements generate additional saleable product without requiring additional ore to be mined, they represent one of the most cost-efficient margin levers available to a spodumene producer.
Is the lithium recovery sustainable beyond FY26?
This depends on the balance between structural demand growth from electric vehicles and battery storage systems, and supply-side responses including the potential restart of curtailed operations and the progression of new development projects. While demand fundamentals remain supportive, supply additions represent a meaningful risk to the pace and extent of further price appreciation. Consequently, investors should monitor quarterly operational disclosures — alongside resources such as the S&P Global Commodity Insights platform — for early signals of how the earnings trajectory is evolving.
Further coverage of Australia's resources sector, including ongoing lithium market developments, production updates, and commodity price analysis, is available through the Australian Mining Review at australianminingreview.com.au.
Want to Catch the Next Major ASX Mineral Discovery Before the Market Does?
Discovery Alert's proprietary Discovery IQ model delivers real-time alerts on significant ASX mineral discoveries — turning complex data across more than 30 commodities into a single, actionable insight — so investors can act decisively when the next major opportunity emerges, whether in lithium or beyond. Explore Discovery Alert's discoveries page to see how historic discoveries have generated substantial returns, and start a 14-day free trial today to gain a market-leading edge.