July 14, 2026
Understanding the Global Lithium Supply Chain Architecture
The lithium mining sector represents one of the most strategically significant extractive industries in the modern economy, with global production networks spanning continents and technologies. Understanding these operations requires examining the complex interplay between geological endowments, technological capabilities, and market positioning that determines long-term competitive advantages.
Market Fundamentals and Production Metrics
Global lithium production reached approximately 1.4 million tonnes of lithium carbonate equivalent (LCE) in 2024, representing a substantial 22% increase from the previous year according to U.S. Geological Survey data. This expansion reflects the sector's response to accelerating demand from battery manufacturers and energy storage applications.
Production capacity measurement distinguishes between theoretical maximum output and actual realized production, which faces constraints from ore grade variations, processing efficiency limitations, operational maintenance requirements, and cyclical market demand. Current global nameplate capacity exceeds actual output by approximately 18-25%, indicating significant underutilization during market downturns.
Key Performance Indicators for Mining Operations:
• Reserve-to-production ratios measuring operational longevity
• Processing yield rates reflecting technological efficiency
• Unit cost metrics measured in USD per tonne LCE
• Geographic distribution across major producing regions
• Capital efficiency metrics for large-scale operations
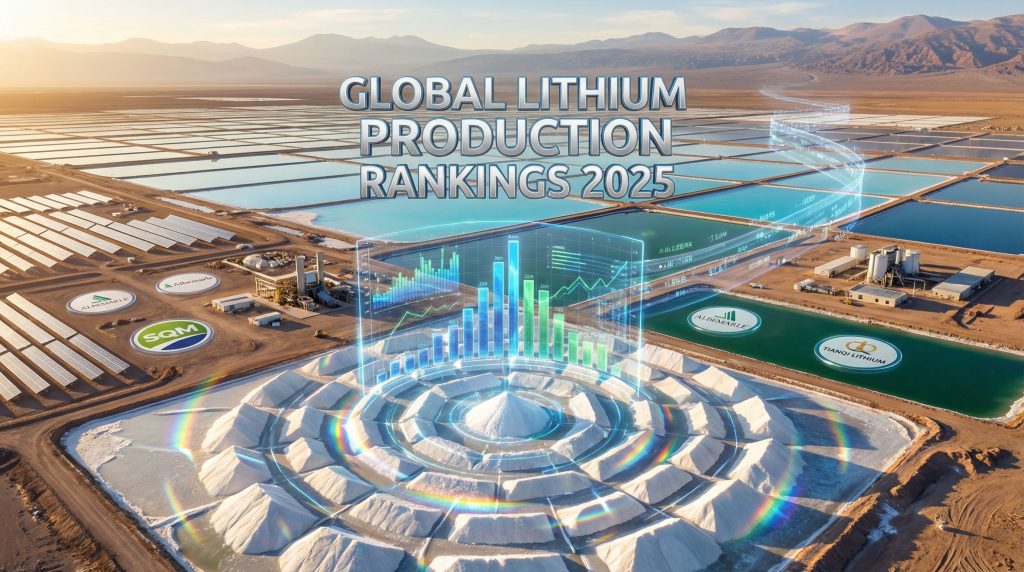
The geographic distribution reveals three primary production clusters: South America accounts for 55% of global production through predominantly brine operations, Australia contributes 35% via hard rock spodumene extraction, and China provides 8% using mixed methodologies. However, reserve distribution differs significantly from current production patterns, with South America holding approximately 62% of global reserves, Australia 18%, and China 8%.
Investment Grade Classification Systems
Lithium operations are increasingly categorised using sophisticated classification frameworks that evaluate multiple operational and strategic dimensions. Tier 1 operations typically demonstrate annual production exceeding 50,000 tonnes LCE, while Tier 2 operations range between 20,000-50,000 tonnes annually, and Tier 3 operations produce less than 20,000 tonnes.
Reserve Quality Assessment Framework:
| Classification | Production Threshold | Reserve Base | Strategic Value |
|---|---|---|---|
| Tier 1 | >50,000 tonnes LCE | >30 year horizon | Global supply impact |
| Tier 2 | 20,000-50,000 tonnes | 15-30 year horizon | Regional significance |
| Tier 3 | <20,000 tonnes | <15 year horizon | Niche market focus |
Capital efficiency metrics have become increasingly sophisticated, incorporating not only traditional return on invested capital measures but also environmental compliance costs, technological advancement requirements, and geopolitical risk adjustments. Operations with downstream processing capabilities command 15-25% production price premiums compared to concentrate-only producers.
When big ASX news breaks, our subscribers know first
What Drives Lithium Mine Rankings in 2025?
Contemporary lithium mine evaluation frameworks have evolved beyond simple production volume assessments to incorporate multidimensional strategic value metrics. These frameworks recognise that sustainable competitive advantage in lithium mining derives from the intersection of geological endowments, technological capabilities, and strategic positioning within global supply chains.
Production Volume Analysis Framework
Lithium carbonate equivalent standardisation enables direct comparison across diverse production methodologies. One tonne of lithium metal equals approximately 5.32 tonnes of lithium carbonate or 8.56 tonnes of lithium hydroxide, providing the foundation for consistent performance measurement across brine and hard rock operations.
Processing capacity calculations incorporate multiple efficiency factors including ore grade, extraction technology performance, and downstream processing throughput. Hard rock operations typically achieve 85-92% lithium recovery rates, while brine operations demonstrate more variable performance ranging from 50-85% depending on evaporation cycle effectiveness and brine chemistry.
The global reserve-to-production ratio currently approximates 93 years at existing extraction rates, significantly exceeding fossil fuel extraction horizons that average 40-50 years. This extended timeframe indicates lithium supply sustainability relative to projected demand growth, though individual operation sustainability varies considerably based on specific geological characteristics.
Technology Impact on Production Efficiency:
• Direct lithium extraction technologies increasing hard rock efficiency by 15-30%
• Advanced brine concentration methods reducing evaporation timelines
• Automated processing systems improving yield consistency
• Environmental remediation technologies reducing regulatory compliance costs
Major producers currently operate at 70-85% nameplate capacity as of Q2 2025, reflecting cyclical market conditions and contracted customer demand patterns. This utilisation rate indicates potential for rapid production increases when market conditions warrant capacity expansion.
Strategic Value Assessment Criteria
Supply chain integration capabilities represent fundamental strategic moats in lithium mining operations. Companies controlling extraction through refining and chemical processing create customer lock-in effects and demonstrate superior margin resilience during market volatility periods.
Geopolitical stability analysis encompasses political risk evaluation, regulatory predictability assessment, treaty compliance history, and dispute resolution effectiveness. Regions with established democratic institutions and rule of law frameworks demonstrate measurably lower operational disruption risk profiles.
Environmental Compliance Impact Analysis:
| Operation Type | Water Consumption | Carbon Intensity | Regulatory Complexity |
|---|---|---|---|
| Brine Operations | 65-400 m³/tonne Li | 5-8 tonnes CO2-eq/tonne LCE | High (water rights) |
| Hard Rock Mining | 15-50 m³/tonne Li | 8-12 tonnes CO2-eq/tonne LCE | Medium (tailings) |
Environmental compliance in lithium mining directly impacts operational sustainability through water consumption requirements, carbon intensity considerations, and tailings management obligations. Water-intensive brine operations in arid regions face increasing regulatory scrutiny, while hard rock operations encounter tailings containment and acid mine drainage concerns.
Regional Market Dynamics and Competitive Landscape
Regional specialisation in lithium extraction reflects geological endowments, technological capabilities, and infrastructure development patterns that have evolved over decades of mining operations. These regional advantages create sustainable competitive positioning that influences global supply chain architecture.
South American Brine Operations Dominance
South American lithium production totaled approximately 561,000 tonnes LCE in 2024, representing roughly 40% of global production. Argentina contributed approximately 145,000 tonnes, Chile produced 380,000 tonnes, and Bolivia added 36,000 tonnes with emerging capacity development. Furthermore, the Argentine lithium market insights reveal significant expansion potential across major brine operations.
The Lithium Triangle spanning Argentina, Chile, and Bolivia contains approximately 385 million tonnes of lithium reserves, representing 62% of the global total. This concentration creates both supply security and geopolitical risk considerations for downstream battery manufacturers.
Salar-Based Extraction Economic Advantages:
• Production costs of $3,000-$4,500 per tonne LCE
• Natural brine concentrations reducing initial processing requirements
• Solar evaporation minimising energy consumption
• High-altitude salar locations providing optimal evaporation conditions
Brine extraction leverages natural lithium concentrations in salt flats at elevations of 3,500-4,500 meters, reducing extraction depth requirements and initial capital investments. The Atacama region's salar deposits contain lithium brines with concentrations of 600-1,200 mg/L, substantially higher than most global alternatives.
Climate dependency creates inherent supply-side volatility in South American operations. Drought conditions reduce evaporation-based extraction cycles, while heavy precipitation disrupts brine concentration processes. This structural volatility differentiates salar operations from hard rock mining alternatives.
The brine extraction process requires 12-24 months for solar evaporation to concentrate lithium from initial concentrations of 0.3-0.8% to refined lithium carbonate at 95-99% purity. This extended timeline minimises processing costs but maximises land and water requirements, creating environmental and community conflicts in water-scarce Andean regions.
Hard Rock Mining Operations: Australian Leadership
Australian lithium production reached approximately 500,000 tonnes LCE in 2024, representing 36% of global production through predominantly spodumene-based hard rock mining. Australia dominates global spodumene concentrate production with approximately 65% market share, particularly through Australian lithium industry innovations that enhance operational efficiency.
Australian hard rock operations benefit from geological advantages including large, high-grade deposits with lithium concentrations in spodumene ore of 5-8% lithium oxide. Established mining infrastructure, regulatory certainty, and developed downstream processing ecosystems create sustainable competitive advantages.
Spodumene Processing Technology Framework:
• Conventional underground and open-pit extraction methods
• Ore crushing to 10-30mm particle size specifications
• Flotation separation producing 5-6% Li2O concentrate
• Thermal roasting at 900-1,100°C for chemical activation
• Downstream conversion to battery-grade lithium compounds
Modern spodumene processing achieves lithium extraction rates of 85-92%, representing a 12-15% improvement over processing methods deployed prior to 2015. These technological advances directly impact production economics and competitive positioning.
Export logistics present both challenges and opportunities for Australian producers. Shipping costs of $200-400 per tonne for delivery to Asian processing facilities, with European delivery adding $350-500 per tonne, influence strategic partnership development and downstream integration decisions.
Australian producers increasingly develop coordinated relationships with Asian battery material manufacturers, creating supply chain advantages through integrated transportation and chemical conversion processes. This vertical integration reduces total supply chain costs by 8-12% compared to spot market transactions.
Market Leaders: Production Excellence and Strategic Positioning
Contemporary lithium mining evaluation employs sophisticated analytical frameworks that extend beyond traditional production volume metrics to encompass strategic value creation, operational resilience, and long-term sustainability factors.
What Makes a Tier 1 Lithium Operation?
Comprehensive Assessment Matrix:
| Evaluation Criteria | Weighting | Measurement Methodology | Industry Benchmarks |
|---|---|---|---|
| Annual Production Volume | 40% | LCE tonnes verified output | >50,000 tonnes (Tier 1) |
| Reserve Base Quality | 25% | Geological assessment & longevity | >30 year operational horizon |
| Cost Efficiency Leadership | 20% | USD per tonne total cost analysis | Bottom quartile industry costs |
| Strategic Market Value | 15% | Supply chain integration & partnerships | Downstream processing capabilities |
Tier 1 operations demonstrate sustained production excellence through consistent operational performance, technological innovation deployment, and strategic market positioning that influences global lithium supply chains. These operations typically maintain production costs in the bottom quartile of industry benchmarks while demonstrating superior operational reliability.
Critical Success Factors for Market Leadership
Market-leading lithium operations exhibit common characteristics that differentiate them from mid-tier competitors. These include geological advantages providing long-term resource security, technological capabilities enabling superior extraction efficiency, and strategic positioning within global battery supply chains. However, emerging projects like the Thacker Pass lithium mine demonstrate how strategic locations can create new market leaders.
Operational Excellence Indicators:
• Production consistency exceeding 95% nameplate capacity utilisation
• Unit cost performance in bottom 25% of industry benchmarks
• Reserve replacement exceeding annual production through exploration
• Environmental compliance maintaining regulatory approval status
• Customer contract portfolios spanning multiple end-market applications
Financial performance metrics for leading operations typically demonstrate superior return on invested capital, margin stability during commodity price volatility, and successful capital allocation for expansion projects. These financial characteristics reflect operational efficiency and strategic market positioning advantages.
Technology deployment distinguishes market leaders through advanced processing methods, automation implementation, and environmental performance optimisation. Leading operations invest 3-5% of annual revenue in research and development activities focused on efficiency improvements and environmental impact reduction.
Investment Implications and Market Outlook
Contemporary lithium mining investment analysis requires sophisticated evaluation of multiple risk and return factors that extend beyond traditional commodity investment frameworks. The sector's strategic importance to global energy transition creates unique investment dynamics combining traditional mining fundamentals with technology sector growth characteristics.
Capital Allocation Trends Across Producer Tiers
Investment priorities vary significantly across operational tiers, reflecting different strategic objectives and market positioning requirements. Tier 1 producers focus on capacity expansion and technological advancement, while emerging producers prioritise market entry and operational optimisation.
Investment Priority Framework by Operational Tier:
| Operational Tier | Primary Investment Focus | Capital Intensity | Expected ROI Timeline |
|---|---|---|---|
| Tier 1 Leaders | Capacity expansion & technology | High ($500M-2B) | 3-5 years |
| Tier 2 Operations | Processing optimisation & efficiency | Medium ($100M-500M) | 2-4 years |
| Emerging Producers | Market entry & infrastructure | Variable ($50M-300M) | 5-7 years |
Tier 1 operations demonstrate superior capital allocation efficiency through integrated expansion strategies that simultaneously increase production capacity and improve operational efficiency. These investments typically generate returns exceeding 15-20% internal rate of return under base case demand scenarios.
Supply Chain Risk Assessment Framework
Geopolitical concentration represents a fundamental risk factor in lithium supply chains, with South America accounting for 60% of current production. Sustained disruption in this region would create significant global supply chain vulnerability requiring strategic diversification initiatives.
Multi-Dimensional Risk Analysis:
• Geographic concentration risk across producing regions
• Political stability factors and regulatory environment volatility
• Environmental compliance requirements and operational constraints
• Technology disruption potential and adaptation capabilities
• Market demand volatility and cyclical pricing patterns
Environmental compliance requirements increasingly influence operational sustainability through water consumption regulations, carbon intensity targets, and community impact considerations. Operations in water-stressed regions face particular scrutiny regarding aquifer depletion and agricultural water competition.
Technology disruption potential encompasses both opportunity and risk dimensions. Geothermal lithium extraction technologies offer processing efficiency improvements while potentially reducing environmental impact, but require substantial capital investment and operational expertise development.
Future Market Evolution and Strategic Considerations
The lithium mining sector approaches a critical inflection point characterised by accelerating demand growth, technological innovation deployment, and evolving regulatory frameworks that will reshape competitive dynamics over the next decade.
Emerging Technologies and Production Methodologies
Direct lithium extraction (DLE) technology represents the most significant technological advancement in lithium production since the development of modern brine evaporation methods. DLE technologies potentially reduce production timelines from 12-24 months to 30-90 days while improving extraction efficiency.
Technology Innovation Impact Areas:
• Processing timeline reduction through advanced extraction methods
• Water consumption minimisation via recycling and efficiency improvements
• Energy intensity reduction through renewable power integration
• Waste stream optimisation reducing environmental impact
• Automation deployment improving operational consistency
Recycling integration creates circular economy opportunities as lithium-ion battery waste streams mature. Battery recycling could contribute 10-15% of global lithium supply by 2030, potentially reducing primary extraction requirements and creating new competitive dynamics.
Alternative brine processing innovations focus on reducing evaporation dependence through membrane separation, selective precipitation, and electrochemical extraction methods. These technologies address climate dependency concerns while potentially improving extraction efficiency.
Hard rock mining efficiency improvements concentrate on ore sorting technologies, flotation process optimisation, and integrated processing facility design that reduce unit costs and environmental impact simultaneously. Moreover, advanced battery-grade lithium refinery facilities are increasingly important for meeting growing demand.
Market Demand Projections and Capacity Planning
Electric vehicle adoption rate impacts create the primary demand driver for lithium markets, with global EV sales projected to reach 30-40 million units annually by 2030. Each vehicle requires approximately 8-15 kg of lithium depending on battery chemistry and pack size.
Demand Growth Scenario Analysis:
| Application Sector | 2024 Demand | 2030 Projection | Growth Rate |
|---|---|---|---|
| Electric Vehicles | 850,000 tonnes LCE | 2,200,000 tonnes LCE | 14.5% CAGR |
| Energy Storage Systems | 180,000 tonnes LCE | 550,000 tonnes LCE | 17.2% CAGR |
| Consumer Electronics | 120,000 tonnes LCE | 160,000 tonnes LCE | 4.9% CAGR |
Energy storage system growth requirements represent the fastest-growing demand segment, driven by renewable energy integration and grid stabilisation requirements. Utility-scale battery storage installations could require 550,000 tonnes LCE annually by 2030.
Supply-demand balance scenarios through 2030 suggest potential supply constraints developing if project development timelines extend beyond current expectations. New lithium operations typically require 5-8 years from discovery to production, creating supply response delays relative to demand acceleration.
Strategic reserve considerations reflect government recognition of lithium's critical mineral status. Several jurisdictions implement strategic stockpiling programmes and domestic production incentives to reduce import dependency and supply chain vulnerability.
The next major ASX story will hit our subscribers first
Frequently Asked Questions About Global Lithium Mining
Understanding lithium mining evaluation requires familiarity with industry-specific terminology, assessment methodologies, and market dynamics that differ substantially from conventional commodity mining sectors.
How Are Lithium Mine Rankings Determined?
Lithium mine rankings employ multidimensional evaluation frameworks that incorporate production volume, reserve quality, operational efficiency, and strategic market positioning. Production volume methodology measures verified annual output in lithium carbonate equivalent terms, enabling direct comparison across different extraction methods.
Ranking Methodology Components:
• Annual production verification through independent audits and company reporting
• Reserve quality assessment incorporating geological surveys and proven reserves
• Operational efficiency analysis including cost structure and capacity utilisation
• Strategic market value evaluation considering supply chain integration and customer relationships
Data verification processes rely on company financial reports, geological survey publications, industry analysis platforms, and regulatory filing requirements. Third-party verification ensures ranking accuracy and consistency across global operations.
Reserve quality assessment evaluates not only total lithium content but also extraction complexity, processing requirements, and long-term operational viability. High-grade deposits with favourable geology command premium valuations despite potentially smaller absolute reserve sizes.
What Factors Drive Lithium Production Costs?
Production cost structures vary dramatically between extraction methodologies, with brine operations demonstrating lower unit costs but higher capital intensity, while hard rock mining requires higher operating costs but offers production timeline advantages.
Cost Structure Analysis by Extraction Method:
| Cost Component | Brine Operations | Hard Rock Mining |
|---|---|---|
| Direct Extraction | $800-1,200/tonne | $1,500-2,200/tonne |
| Processing & Refining | $1,200-1,800/tonne | $2,000-2,800/tonne |
| Infrastructure & Logistics | $400-800/tonne | $600-1,200/tonne |
| Environmental Compliance | $300-600/tonne | $500-900/tonne |
| Total Production Cost | $3,000-4,500/tonne | $5,000-7,500/tonne |
Geographic location influences production costs through labour availability, energy costs, transportation requirements, and regulatory compliance expenses. Operations in remote locations face higher logistics costs but may benefit from lower labour and land acquisition expenses.
Processing technology advancement directly impacts unit costs through improved extraction efficiency, reduced energy consumption, and enhanced automation deployment. Leading operations achieve 8-12% cost advantages through technological superiority.
Regulatory compliance costs encompass environmental monitoring, water management, community relations, and government royalty payments. These costs typically represent 10-15% of total production expenses and continue increasing in most jurisdictions.
Which Regions Dominate Global Lithium Production?
Regional production dominance reflects geological endowments, technological capabilities, and infrastructure development that create sustainable competitive advantages for specific extraction methodologies.
South American salar operations leverage exceptional geological conditions including high-altitude salt flats with concentrated lithium brines, favourable evaporation climates, and substantial reserve bases. The Lithium Triangle countries collectively control 62% of global lithium reserves.
Regional Production Characteristics:
• South America: Brine-based extraction, low unit costs, climate-dependent production
• Australia: Hard rock spodumene mining, technological leadership, export orientation
• China: Mixed extraction methods, downstream processing dominance, domestic market focus
• Emerging Regions: North America, Africa development projects with strategic government support
Australian spodumene mining maintains leadership through geological advantages, established infrastructure, regulatory stability, and technological innovation. Western Australia contains high-grade spodumene deposits with favourable extraction characteristics.
Geopolitical considerations increasingly influence production location strategies as governments recognise lithium's strategic importance. Supply security concerns drive domestic production incentives and international partnership development.
Emerging production regions including North America and Africa develop projects focused on supply chain diversification and regional market supply. These projects typically emphasise technological advancement and environmental performance optimisation.
Investment Disclaimer: This analysis contains forward-looking statements and market projections that involve inherent risks and uncertainties. Lithium mining operations face commodity price volatility, regulatory changes, environmental compliance requirements, and operational risks that can significantly impact financial performance. Investors should conduct independent due diligence and consider consulting qualified financial advisors before making investment decisions. For comprehensive SEO strategy insights and market analysis frameworks, professional consultation is recommended. Past performance does not guarantee future results, and all mining investments carry substantial risk of loss.
Ready to Position Yourself for the Next Major Lithium Discovery?
Discovery Alert instantly delivers real-time notifications on significant ASX mineral discoveries using its proprietary Discovery IQ model, transforming complex lithium and commodity data into actionable investment insights. Explore why major mineral discoveries can generate substantial returns through the dedicated discoveries page, showcasing historic examples of exceptional market outcomes, and begin your 14-day free trial today to secure your competitive advantage in the rapidly evolving lithium market.