
August 3, 2026
When Input Costs Defy Metal Prices: A Structural Tension in Aluminium Markets
The global aluminium industry operates across a vertically integrated supply chain where the economics of each stage can diverge sharply from those above and below it. Bauxite is mined, refined into alumina, and then smelted into primary aluminium metal. Each transition involves distinct cost structures, market participants, and pricing mechanisms. When these layers move in opposite directions simultaneously, the signal is worth examining carefully.
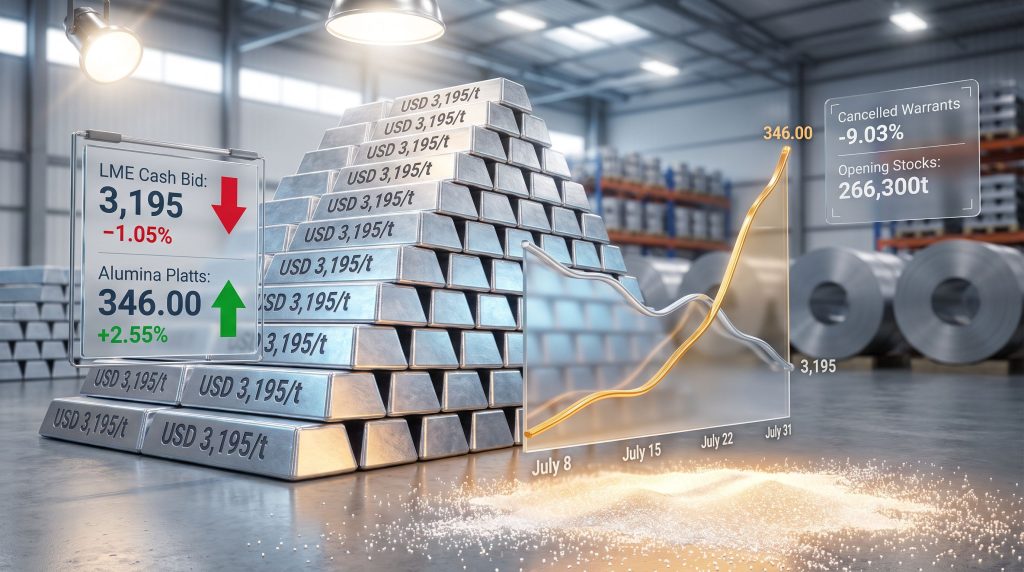
That is precisely what occurred on July 31, 2026. LME aluminium prices and alumina Platts rise events diverged in a meaningful way, with the upstream feedstock gaining ground at the same time as the finished metal retreated. This kind of divergence is not simply a curiosity. It is a margin compression event with measurable consequences for producers, traders, and downstream buyers alike.
When big ASX news breaks, our subscribers know first
What the July 31 Price Data Actually Reveals
LME Aluminium Contract Performance Across All Tenors
Every aluminium contract on the LME closed lower on July 31, 2026, reversing the gains recorded in the prior session. The pullback was most pronounced at the front of the curve, where immediate delivery contracts carry the highest sensitivity to daily market sentiment.
| Contract | Previous Price (USD/t) | July 31 Price (USD/t) | Change |
|---|---|---|---|
| Cash Bid | 3,229 | 3,195 | -1.05% |
| Cash Offer | 3,231 | 3,196 | -1.08% |
| 3-Month Bid | 3,185 | 3,178.50 | -0.20% |
| 3-Month Offer | 3,187 | 3,179 | -0.25% |
| Dec-27 Bid | 3,118 | 3,108 | -0.32% |
| Dec-27 Offer | 3,123 | 3,113 | -0.32% |
| Asian Reference | 3,195.50 | 3,184 | -0.36% |
The cash contracts bore the sharpest decline at roughly 1.05 to 1.08 percent, while longer-dated December 2027 contracts fell a more moderate 0.32 percent. This shape of movement, where spot prices correct harder than deferred contracts, often reflects short-term sentiment shifts rather than a fundamental reassessment of long-term supply and demand.
Alumina Platts: Moving in the Opposite Direction
While the metal price was retreating across all tenors, the upstream feedstock was doing the opposite. The LME aluminium prices and alumina Platts rise dynamic was particularly striking when viewed against recent price history.
| Instrument | Previous Price (USD/t) | July 31 Price (USD/t) | Change |
|---|---|---|---|
| LME Alumina Platts | 337.38 | 346.00 | +2.55% |
A 2.55 percent single-session gain in alumina is a notable move. To put this in context, alumina had touched USD 368.52 per tonne on July 23 before correcting back toward the USD 337 range on July 30. The July 31 rebound to USD 346 suggests the earlier correction may have been temporary rather than the beginning of a sustained downtrend.
Alumina typically represents approximately 30 to 35 percent of the total cash cost of producing primary aluminium. When alumina prices rise disproportionately relative to the metal, the margin available to smelters narrows, which has historically preceded production curtailments at higher-cost facilities.
Furthermore, the implications of this divergence extend well beyond a single trading session, particularly given broader shifts in aluminum and alumina markets that have been reshaping smelter economics across multiple regions.
How July 2026 Prices Trended Through the Month
A Month in Review: Key Price Milestones
Examining the broader July 2026 price arc provides important context for interpreting the July 31 session.
| Date | LME Cash Price (USD/t) | LME 3-Month Price (USD/t) | Alumina Platts (USD/t) |
|---|---|---|---|
| 8 July 2026 | 3,141.00 | 3,147.00 | – |
| 17 July 2026 | 3,159.80 | – | – |
| 23 July 2026 | Rising session | Rising session | 368.52 |
| 27 July 2026 | – | – | 346.25 |
| 30 July 2026 | 3,229 | 3,185 | 337.38 |
| 31 July 2026 | 3,195 | 3,178.50 | 346.00 |
The month began with LME cash prices near USD 3,141 per tonne before climbing steadily through mid-July. By July 30, aluminium cash prices had reached USD 3,229 per tonne, representing a gain of roughly 2.8 percent from the early-month level. The July 31 pullback to USD 3,195 effectively gave back a portion of that advance.
The alumina trajectory tells a different story. The spike to USD 368.52 per tonne on July 23 was a significant intra-month high. The subsequent correction to USD 337.38 by July 30 was sharp, and the partial recovery to USD 346 on July 31 leaves the market in an uncertain position, with alumina still elevated relative to early-month levels.
Where USD 3,195 Per Tonne Sits Historically
The current LME aluminium cash price of USD 3,195 per tonne sits well above the multi-year trough levels recorded in 2015 and 2016, when prices dipped below USD 1,500 per tonne. It also sits below the post-invasion commodity spike of early 2022, when aluminium briefly exceeded USD 3,800 per tonne before retreating.
The current price range of roughly USD 3,100 to USD 3,250 represents a historically elevated but not extraordinary level by recent standards. At the same time, an alumina price of USD 346 per tonne implies a raw alumina cost of approximately USD 1,038 to USD 1,212 per tonne of finished aluminium, depending on conversion ratios. This leaves smelter economics under meaningful pressure, particularly for facilities without captive refinery supply.
Warehouse Inventories: A Bullish Signal Overridden by Macro Sentiment
LME Inventory Metrics: July 31 Snapshot
| Metric | Previous Level | July 31 Level | Change |
|---|---|---|---|
| Opening Stocks | 267,800 t | 266,300 t | -0.56% |
| Live Warrants | 245,250 t | 245,250 t | 0.00% |
| Cancelled Warrants | 21,050 t | 19,150 t | -9.03% |
Why the Cancelled Warrant Decline Deserves Attention
Within LME warehouse data, the distinction between live warrants and cancelled warrants is critical and often underappreciated by those outside the physical metals market.
- Live warrants represent metal sitting in LME-approved warehouses that is available for delivery against exchange contracts.
- Cancelled warrants represent metal that has been earmarked for physical withdrawal, meaning a buyer has formally requested delivery and the metal is in the process of leaving the warehouse system.
- A sharp decline in cancelled warrants, such as the 9.03 percent single-session drop recorded on July 31, typically signals active demand from industrial end-users or merchants withdrawing metal for immediate use.
"A 9 percent single-session fall in cancelled warrants is a meaningful physical demand signal. Industrial consumers do not cancel warrants speculatively. When this metric falls sharply, it generally reflects genuine pull from the manufacturing sector."
The Inventory-Price Paradox
Despite this bullish physical demand signal, aluminium prices declined on the same day. This apparent contradiction reflects a well-documented dynamic in commodity markets: financial market sentiment can and frequently does override physical supply signals over short timeframes.
Macro factors — including currency movements, risk-off positioning, and broader equity market sentiment — can overwhelm what the inventory data is telling participants about underlying demand. Historical precedents for this dynamic are numerous, particularly during periods of heightened macroeconomic uncertainty when institutional traders reduce commodity exposure regardless of physical fundamentals. Consequently, commodity hedging strategies have become increasingly relevant tools for participants seeking to manage this kind of price dislocation.
The Structural Economics of Alumina Price Volatility
Why Alumina and Aluminium Prices Can Diverge So Sharply
The pricing mechanisms governing alumina and primary aluminium are structurally distinct, which explains why divergences like the one observed on July 31 can emerge and persist.
Aluminium trades on the LME through a continuous electronic and open-outcry system, where prices respond in real time to global financial flows, positioning, and macroeconomic news. Alumina, by contrast, is assessed daily by S&P Global Platts through a methodology that aggregates reported transaction prices and producer assessments from refinery-level market participants. The two systems respond to different inputs at different speeds.
Additionally, a significant proportion of global alumina supply moves under long-term indexed supply contracts rather than spot market transactions. This creates pricing rigidity in the alumina market that amplifies short-term divergence from aluminium metal prices.
Supply Chain Factors Driving Alumina Cost Pressure
Several structural forces can push alumina prices higher independently of LME aluminium dynamics. In addition, China industrial demand patterns continue to exert significant upstream pressure across the supply chain:
- Bauxite supply concentration in a small number of producing nations creates geopolitical risk exposure for global refinery feedstock supply.
- Energy costs, particularly natural gas and coal used in the Bayer refining process, represent a large and volatile component of alumina production costs.
- Freight and logistics costs compound the delivered cost of alumina for smelters located far from refineries, adding a further layer of price sensitivity.
- Regulatory constraints on bauxite exports in producing nations can create sudden tightness in alumina refinery feedstock availability with limited warning.
The Smelter Margin Framework: Who Bears the Most Risk?
Not all aluminium producers are equally exposed to alumina price volatility. Understanding the cost structure determines which category of producer faces the greatest margin pressure.
| Producer Type | Alumina Exposure | Margin Risk Under Rising Alumina |
|---|---|---|
| Fully integrated (mine to metal) | Captive supply, internal transfer pricing | Low direct exposure |
| Partially integrated (own refinery, not mine) | Exposed to bauxite costs | Moderate exposure |
| Merchant smelter (buys alumina on market) | Fully exposed to spot and index pricing | High direct exposure |
Merchant smelters purchasing alumina at or near the Platts index face the most immediate margin compression when alumina prices rise while aluminium prices fall. However, even among the world's largest aluminium producers, the degree of vertical integration varies considerably, and that variation increasingly defines competitive positioning under current market conditions.
Forward Curve Interpretation and Market Positioning
Reading the Dec-27 Contracts as a Structural Signal
The December 2027 contract settling at USD 3,108 to USD 3,113 per tonne represents a meaningful discount to the current cash price of USD 3,195 per tonne. This structure indicates that the market currently prices in modest price weakness over an 18-month horizon — a mild backwardation between the cash and the long-dated forward.
This curve shape can reflect several considerations:
- Expectations that current supply tightness will ease as new smelting capacity comes online.
- Anticipated easing of energy cost pressures that currently underpin production cost floors.
- Market discounting of potential demand weakness from slower-than-expected industrial activity.
None of these interpretations carry certainty. Forward curves reflect the weighted average of market participant expectations at a given moment, and those expectations shift continuously as new information arrives.
The next major ASX story will hit our subscribers first
What This Means for Different Market Participants
For Aluminium Producers
The combination of falling output prices and rising feedstock costs is the most challenging operating environment for standalone smelters. Those with fixed-price or hedged alumina supply contracts are partially insulated. Those purchasing alumina at prevailing spot or index prices face real margin compression that may influence production decisions over coming months.
For Industrial Buyers and Downstream Users
A pullback in LME cash prices to USD 3,195 per tonne may present a procurement opportunity for industrial consumers with flexible purchasing windows. However, the broader context of aluminium tariff impacts must also be factored into effective cost calculations, particularly for buyers operating across international supply chains.
Buyers operating under the European Carbon Border Adjustment Mechanism framework must furthermore factor in the embedded carbon cost of imported aluminium on top of the LME price, which alters the effective cost calculation meaningfully depending on the origin of the metal.
For Traders and Investors
The July 31 session presents a mixed technical picture. The cash price pullback from USD 3,229 to USD 3,195 represents a retracement within what had been a constructive uptrend from the early July level of USD 3,141. The three-month price at USD 3,178.50 represents a near-term technical reference level, and the behaviour of alumina Platts in coming sessions will be critical for assessing whether smelter margin pressure intensifies or stabilises.
The persistence of LME aluminium prices and alumina Platts rise divergence across multiple sessions would represent a significantly more bearish signal for smelter profitability than a single-day event.
Disclaimer: This article contains forward-looking analysis, price interpretation, and market commentary for informational purposes only. It does not constitute financial advice. Commodity markets are inherently volatile, and past price behaviour does not predict future outcomes. Readers should conduct independent research before making any investment or procurement decisions.
Frequently Asked Questions: LME Aluminium and Alumina Platts
What is the LME aluminium cash price?
The LME cash price is the benchmark settlement price for aluminium delivered immediately, typically within two business days. It is established daily through a combination of open-outcry ring trading and electronic platform activity at the London Metal Exchange. The spread between the cash price and the three-month forward price — known as contango when forward prices are higher or backwardation when they are lower — provides information about the immediate supply-demand balance in physical markets.
How does the Platts alumina price index work?
S&P Global Platts constructs its daily alumina price assessment by compiling reported transaction prices, bids, and offers from producers, traders, and consumers active in the physical alumina market. The methodology is separate from LME price discovery and reflects conditions in the upstream alumina trade rather than the downstream metal market. Many long-term alumina supply contracts use the Platts index as a pricing reference, meaning that index movements have direct contractual implications for refinery-to-smelter supply agreements.
Why do cancelled warrants matter for aluminium price forecasting?
Cancelled warrants are a leading indicator of physical metal withdrawals from the LME warehouse system. When a market participant cancels a warrant, they have committed to removing metal from the exchange inventory, typically because they have an immediate industrial use for it. Tracking cancelled warrant trends gives market participants an early signal of physical demand intensity that precedes the actual stock reduction visible in total inventory figures.
What does a 2.55 percent single-session alumina rise mean for smelters?
At a starting price of USD 337.38 per tonne, a 2.55 percent gain adds approximately USD 8.62 per tonne of alumina. Given that producing one tonne of primary aluminium requires roughly 1.9 to 2.0 tonnes of alumina depending on process efficiency, a single-session alumina move of this magnitude adds approximately USD 16 to USD 17 per tonne to the raw material cost of metal production. Across a smelter producing hundreds of thousands of tonnes annually, this cost impact accumulates rapidly.
Want to Stay Ahead of ASX Mineral Discoveries Before the Market Moves?
Discovery Alert's proprietary Discovery IQ model delivers real-time alerts on significant ASX mineral discoveries, cutting through complex data to surface actionable investment opportunities the moment they are announced — explore historic discovery returns to understand the magnitude of what early positioning can mean, then begin your 14-day free trial at Discovery Alert to gain a market-leading edge across commodities, exploration, and beyond.