June 16, 2026
When Metal Markets Send Mixed Signals: Reading the LME Aluminium Playbook
Commodity markets rarely move in straight lines. The most revealing moments in any metals cycle are not the dramatic price swings that capture headlines, but the quieter sessions where spot prices edge lower while underlying structural data continues tightening. These divergences, subtle on the surface, often contain the most instructive signals for traders, procurement teams, and long-term market participants alike.
The LME aluminium cash offer dips as inventories slide further, and this specific combination of events creates exactly that kind of analytically rich environment. Understanding what these simultaneous signals mean, and crucially what they do not mean, requires looking beyond the single-session price movement and examining the broader architecture of the forward curve, warehouse dynamics, and supply-side fundamentals. Furthermore, the aluminum and alumina markets are increasingly interconnected, meaning that shifts in one area can rapidly influence the other.
When big ASX news breaks, our subscribers know first
The April 27, 2026 Price Snapshot: What the Numbers Actually Reveal
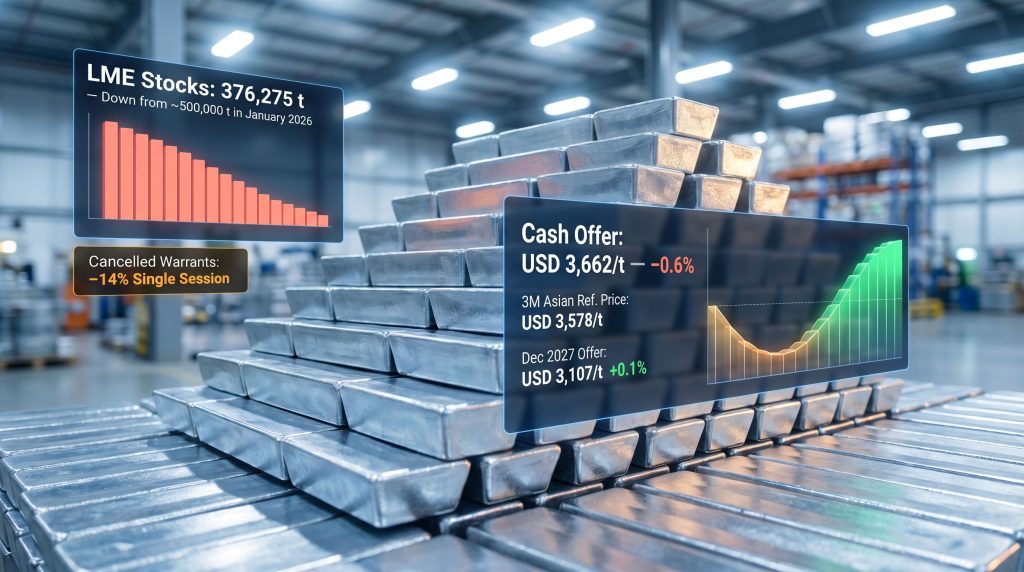
On April 27, 2026, LME aluminium cash pricing softened modestly across the board. The cash bid moved from USD 3,683 per tonne to USD 3,660 per tonne, while the cash offer shifted from USD 3,685 per tonne to USD 3,662 per tonne, representing a decline of USD 23 per tonne or approximately 0.6% in each case.
At the three-month contract level, the bid fell USD 10.5 per tonne (0.3%) to USD 3,587.5 per tonne, and the offer declined USD 12 per tonne (0.33%) to USD 3,588 per tonne. The three-month Asian Reference Price also retreated, dropping USD 13 per tonne (0.4%) from USD 3,591 per tonne to USD 3,578 per tonne.
The full pricing picture for this session is captured below:
| Contract Type | Previous Level | Updated Level | Change |
|---|---|---|---|
| Cash Bid | USD 3,683/t | USD 3,660/t | -USD 23/t (-0.6%) |
| Cash Offer | USD 3,685/t | USD 3,662/t | -USD 23/t (-0.6%) |
| 3-Month Bid | USD 3,598/t | USD 3,587.5/t | -USD 10.5/t (-0.3%) |
| 3-Month Offer | USD 3,600/t | USD 3,588/t | -USD 12/t (-0.33%) |
| Dec 2027 Bid | USD 3,098/t | USD 3,102/t | +USD 4/t (+0.1%) |
| Dec 2027 Offer | USD 3,103/t | USD 3,107/t | +USD 4/t (+0.1%) |
| 3M Asian Ref. Price | USD 3,591/t | USD 3,578/t | -USD 13/t (-0.4%) |
| LME Alumina Platts | USD 307.5/t | USD 307.5/t | No change |
What is immediately notable in this data is the divergence between near-term and long-dated contracts. While spot and three-month pricing softened, the December 2027 contracts rose by USD 4 per tonne across both bid and offer. This is not a random anomaly. It is a structural signal that warrants careful interpretation.
Decoding the Forward Curve: Why Contango Divergence Matters
The LME operates a continuous forward curve where prices at different delivery dates reflect the market's collective view of future supply, demand, and carry costs. Two primary structures define this curve at any given time:
- Backwardation: Spot prices trade above forward prices, typically signalling immediate physical tightness and strong near-term demand
- Contango: Forward prices trade above spot prices, reflecting expectations of future tightness or higher carrying costs over time
The April 27, 2026 session presents a nuanced variation of contango. Near-term prices (cash and three-month) softened, while longer-dated contracts (December 2027) strengthened. This particular shape suggests that market participants are not concerned about immediate supply shortfalls but are pricing in meaningful tightness over the medium-to-long term.
The spread between the cash offer (USD 3,662 per tonne) and the three-month offer (USD 3,588 per tonne) sits at approximately USD 74 per tonne. For physical buyers using forward contracts to hedge procurement costs, this spread is a direct input into hedging economics. A wider cash-to-three-month spread in a declining spot environment can present strategic opportunities for locking in forward purchases at levels below current physical market pricing. In addition, those exploring commodity hedging strategies will find this spread particularly instructive when evaluating forward purchase decisions.
A softening Asian Reference Price alongside declining LME cash offers can indicate either demand-side caution from major consuming regions or a temporary repositioning by traders ahead of macro data releases, rather than a definitive sign of structural weakness in physical demand.
The Three-Month Asian Reference Price as a Regional Demand Indicator
The three-month Asian Reference Price serves a distinct function from the standard LME benchmark. It is specifically calibrated for use in physical trade contracts across Asia-Pacific markets, where the bulk of global aluminium consumption is concentrated. A USD 13 per tonne decline in this figure carries implications for downstream buyers operating in China, Japan, and South Korea.
When this benchmark softens independently of broader LME movements, it can reflect:
- Reduced spot buying activity from large downstream processors
- Inventory building by regional consumers in prior periods, reducing urgency for fresh purchases
- Freight cost adjustments that influence regional delivered pricing
- Short-term risk-off positioning ahead of economic data or policy announcements
Importantly, a single-session decline in the Asian Reference Price does not constitute a demand reversal. Context across multiple sessions and alongside physical import data provides a far more reliable read on actual regional consumption trends.
LME Inventory Dynamics: The More Important Story Behind the Price Headline
While price movements capture immediate attention, the inventory data from this session contains the more strategically significant information. LME aluminium opening stocks declined by 2,550 tonnes (0.7%) from 378,825 tonnes to 376,275 tonnes on April 27, 2026.
| Inventory Category | Previous Level | Updated Level | Change |
|---|---|---|---|
| LME Opening Stocks | 378,825 t | 376,275 t | -2,550 t (-0.7%) |
| Live Warrants | ~335,000 t | ~335,000 t | No change |
| Cancelled Warrants | 43,825 t | 37,700 t | -6,125 t (-14%) |
The headline stock decline is notable, but the cancelled warrant figure deserves particular focus. Cancelled warrants fell by 6,125 tonnes, representing a 14% single-session decline from 43,825 tonnes to 37,700 tonnes.
Understanding How LME Warrants Work
The warrant system is central to how physical metal moves through the LME ecosystem. Here is how the process works step by step:
- Metal is delivered into an LME-registered warehouse and a warrant is issued, representing ownership of that physical parcel
- The warrant remains a live warrant while the metal sits in storage and is available for delivery against exchange contracts
- When a holder decides to withdraw physical metal from the warehouse, they cancel the warrant, triggering a withdrawal instruction
- Once cancelled, that metal is removed from the LME's visible inventory count as it transitions into physical delivery chains
A sharp decline in cancelled warrant volumes on a given day, such as the 14% drop observed on April 27, does not mean the metal was returned to the exchange. Rather, it reflects a reduction in the queue of metal already earmarked for withdrawal. This can occur when some withdrawal instructions are completed and not replaced by new cancellation orders at the same rate.
What it signals collectively, particularly within a multi-month declining inventory trend, is that physical demand for exchange-delivered metal remains active enough to consistently draw down visible stocks without a compensating flow of fresh metal into LME warehouses.
The Multi-Month Inventory Drawdown in Context
The April 27 inventory reading does not exist in isolation. LME aluminium stocks have been on a sustained downward trajectory through the first four months of 2026:
| Period | Approximate LME Stock Level | Key Context |
|---|---|---|
| Early January 2026 | ~497,000-500,000 t | Near recent peak levels |
| Late January 2026 | ~497,725 t | Pre-rally positioning |
| Early February 2026 | ~492,975 t | Post-rally correction begins |
| April 23, 2026 | ~376,000 t range | Continued drawdown |
| April 27, 2026 | 376,275 t | Latest reading |
From approximately 500,000 tonnes in January 2026 to 376,275 tonnes by late April, total LME aluminium inventories have contracted by roughly 25% in under four months. Historically, drawdowns of this magnitude and consistency have preceded periods of sustained price support, as the buffer of freely available exchange metal diminishes and physical buyers face reduced optionality in sourcing.
The Apparent Paradox: Falling Stocks and Softening Spot Prices
One of the more intellectually interesting aspects of the April 27 session is the surface-level contradiction it presents. How can spot prices decline on the same day that inventories fall further and cancelled warrant volumes remain elevated?
The answer lies in the distinction between physical market fundamentals and financial market sentiment. LME aluminium pricing is not determined solely by physical supply and demand. It is also influenced by:
- US dollar strength: Aluminium, like most dollar-denominated commodities, faces headwinds when the USD appreciates, as it increases the cost for non-USD buyers
- Macro risk-off positioning: Ahead of economic data releases or geopolitical developments, traders reduce exposure across commodity markets regardless of physical conditions
- Profit-taking and position squaring: After a significant rally (spot prices moved from roughly USD 3,014 per tonne in early February to USD 3,662 per tonne by late April, an increase of approximately 21.5%), profit-taking is a natural and technically driven response
- Algorithmic trading signals: Momentum-based trading systems can amplify short-term corrections even when fundamental signals remain constructive
The alumina price stability at USD 307.5 per tonne provides an important reference point in this context. Alumina is the primary feedstock for primary aluminium smelting, typically representing 30 to 40 percent of cash production costs at most smelters. When alumina prices remain stable, it suggests that input cost floors for primary producers are intact, which in turn limits the structural downside for aluminium pricing over the medium term. Smelters facing stable input costs have less incentive to pursue distressed selling.
Supply-Side Pressures Adding to the Structural Tightening Narrative
The inventory drawdown is not occurring in a vacuum. Global primary aluminium production contracted by 1.6% quarter-on-quarter in Q1 2026, according to AL Circle reporting, with output declines recorded across multiple regions including Africa, the Gulf Cooperation Council, South America, and Oceania.
This is a meaningful data point for several reasons:
- Production contractions reduce the flow of new metal into the global supply chain, meaning LME warehouse restocking is less likely to offset ongoing drawdowns
- Regional output declines in energy-intensive smelting areas frequently reflect smelter curtailments driven by elevated energy costs or grid reliability constraints
- Lagged production cuts typically translate into LME inventory impacts weeks to months after the curtailment occurs, meaning the full effect of Q1 2026 production declines may not yet be fully reflected in current stock levels
With global primary aluminium output contracting 1.6% in Q1 2026 and LME inventories declining from approximately 500,000 tonnes in January to under 377,000 tonnes by late April, the structural supply picture is tightening even as short-term price corrections create apparent contradictions in day-to-day market readings.
The aluminium smelting industry is uniquely sensitive to energy economics. Smelting is one of the most electricity-intensive manufacturing processes in existence, with modern smelters consuming approximately 13 to 15 megawatt-hours per tonne of aluminium produced. When electricity costs rise in key producing regions, curtailment becomes economically rational before it becomes operationally necessary. Consequently, this creates supply responses that are gradual but structurally persistent.
However, broader policy pressures are also shaping the supply landscape. The ongoing impact of US aluminium tariffs continues to influence trade flows and production economics, adding another layer of complexity to the tightening narrative. Furthermore, advances in green metals production may eventually alter smelting economics, though such transitions remain medium-to-long-term considerations.
The next major ASX story will hit our subscribers first
Practical Implications for Physical Buyers and Market Participants
For Procurement and Sourcing Teams
The combination of declining LME inventories, active warrant cancellations, and reduced primary production creates a procurement risk environment that warrants proactive management:
- Monitor cancelled warrant trends weekly: This is arguably the most forward-looking indicator of physical availability tightening at the exchange level
- Use the cash-to-three-month spread (currently approximately USD 74 per tonne) to evaluate whether locking in forward purchases offers meaningful cost certainty relative to spot procurement
- Track the three-month Asian Reference Price as a benchmark for physical trade in the Asia-Pacific region, where divergences from LME pricing can signal emerging regional tightness or softness ahead of broader market moves
For Market Participants and Traders
The current forward curve structure and inventory trajectory suggest several considerations for positioning. The top aluminium producers are already responding to these structural shifts, and monitoring their output decisions provides valuable context for forward price expectations.
- The December 2027 contract rising to USD 3,102-3,107 per tonne while spot softens reflects genuine long-dated market confidence, not speculative excess
- Key technical levels to monitor include cash offer support around USD 3,600 per tonne and resistance approaching USD 3,700 per tonne
- The approximately 21.5% price appreciation from early February to late April 2026 creates a statistically elevated probability of consolidation periods; short-term dips within this structural uptrend have historically represented positioning opportunities rather than reversal signals
Frequently Asked Questions: LME Aluminium Prices and Inventory Mechanics
What does a declining LME aluminium cash offer actually mean?
A lower cash offer reflects sellers accepting reduced pricing for immediate physical delivery. This can stem from profit-taking after a sustained rally, temporary macro headwinds, or reduced urgency from physical buyers in the spot window. It does not automatically indicate a change in the underlying price trend. Indeed, the LME aluminium cash offer dips as inventories slide further in this instance, which underscores the importance of reading multiple signals simultaneously.
Why do LME warehouse inventories matter so much for price direction?
Exchange-registered stocks represent the most visible and fungible buffer of physical metal available to the global market. As these stocks decline, the market's ability to absorb demand spikes or supply disruptions diminishes, creating a structural floor under pricing. Sustained multi-month drawdowns, like the one observed through early-to-mid 2026, historically precede tighter physical market conditions.
What is the practical significance of a warrant cancellation?
When a warrant holder cancels their warrant, they are formally initiating the removal of physical metal from an LME-registered warehouse. This metal exits the exchange's visible inventory system and enters physical delivery or downstream processing channels. High cancellation rates within a declining inventory environment indicate genuine physical demand absorption rather than purely financial position adjustments.
Is a stable alumina price bullish or bearish for aluminium?
A stable alumina price, as observed at USD 307.5 per tonne on April 27, 2026, is generally interpreted as neutral-to-supportive for primary aluminium. It confirms that smelter input costs are not escalating further, protecting producer margins and reducing incentives for distressed output selling. It also removes a specific downside risk scenario in which falling alumina costs might allow producers to profitably increase output and rebuild exchange inventories.
Does a falling spot price contradict the bullish inventory signal?
Not necessarily. Financial positioning, USD movements, and algorithmic trading can override physical market signals in the short term. The key analytical discipline is distinguishing between single-session noise driven by financial flows and multi-week or multi-month structural trends driven by physical fundamentals. In early-to-mid 2026, the LME aluminium cash offer dips as inventories slide further in a pattern that has been consistently and unambiguously downward, while spot prices have shown periodic corrections within a broader upward trajectory.
Disclaimer: This article is intended for informational purposes only and does not constitute financial, investment, or trading advice. All price data and inventory figures referenced are sourced from AL Circle's market reporting. Commodity markets are subject to rapid change, and past price trajectories do not guarantee future performance. Readers should consult qualified financial advisors before making any investment or procurement decisions based on market data.
Want to Stay Ahead of the Next Major Commodity Discovery?
Discovery Alert's proprietary Discovery IQ model scans ASX announcements in real time, instantly identifying significant mineral discoveries across aluminium, copper, gold, and more than 30 other commodities — converting complex data into clear, actionable investment insights. Explore how historic mineral discoveries have generated substantial market returns, or begin your 14-day free trial today to position yourself ahead of the broader market.