June 16, 2026
When Commodity Logic Breaks Down: Reading the Aluminium Market's Mixed Signals
There is a well-worn assumption embedded in commodity markets: falling inventories support rising prices. Shrinking supply of a physical material should, in theory, tighten availability and push buyers to pay more. But aluminium markets periodically challenge this assumption in ways that reveal the deeper forces shaping industrial metal prices. When the LME aluminium price drops below USD 3,500 per tonne at the same time warehouse stocks are declining, traders and analysts are forced to look beyond supply-side mechanics and ask harder questions about demand, macro sentiment, and the psychology driving forward positioning.
That is precisely the situation that unfolded across the week of June 11 to 15, 2026. The LME aluminium price drops below USD 3,500 per tonne became the defining headline of the session, sending ripple effects across the entire contract curve and raising pointed questions about where the market is headed next. Furthermore, the scale of the move caught many market participants off guard, given that inventory signals were pointing in the opposite direction.
When big ASX news breaks, our subscribers know first
The USD 3,500/t Threshold: Why This Price Level Commands Attention
Understanding Price Floors and Psychological Resistance in Base Metal Trading
Round-number price levels carry disproportionate significance in futures markets, far beyond what pure supply-demand arithmetic would justify. For aluminium, USD 3,500 per tonne has functioned as one of those psychologically anchored thresholds where traders, producers, and procurement teams have historically recalibrated their strategies.
When prices hold above this level, producer confidence tends to remain intact and hedging activity stabilises. When prices breach it to the downside, it often triggers a cascade of stop-loss orders, revised procurement strategies, and downward revision of near-term smelter output assumptions.
This is not merely a technical artefact. The USD 3,500/t level carries real-world weight because primary aluminium smelting is an energy-intensive, capital-heavy process with narrow margins. Many smelters operating in higher-cost jurisdictions sit close to breakeven at these price levels, making the threshold a genuine operational pivot point rather than just a chart line. In addition, the aluminium tariffs impact felt across global trade flows have further complicated the margin environment for producers navigating this threshold.
How the LME Benchmark Functions as a Global Pricing Reference
The London Metal Exchange aluminium contract remains the world's dominant pricing benchmark for primary aluminium, underpinning physical contracts across Asia, Europe, and the Americas. Cash prices, three-month contracts, and long-dated forwards traded on the LME serve as the base reference onto which regional premiums are layered to arrive at real-world transaction prices.
This means that a sharp move in the LME cash price is not an abstract financial event; it directly affects the economics of physical aluminium delivery contracts across every major consuming region. The three-month contract, in particular, acts as the primary speculative and hedging instrument, while the cash price reflects near-term physical availability.
Divergences between these two, or between the LME benchmark and the Asian Reference Price, often expose regional imbalances that can persist for weeks or months. Consequently, understanding how these benchmarks interact is essential for anyone operating along the aluminium value chain.
A Detailed Look at Pricing Movements: June 11 to 15, 2026
Key Price Movements Across Contract Tenors
The breadth of the June 15 decline was striking, affecting every segment of the LME aluminium pricing structure simultaneously. The table below captures the full scope of the movement:
| Contract Type | June 11-12 Price (USD/t) | June 15 Price (USD/t) | Change (%) |
|---|---|---|---|
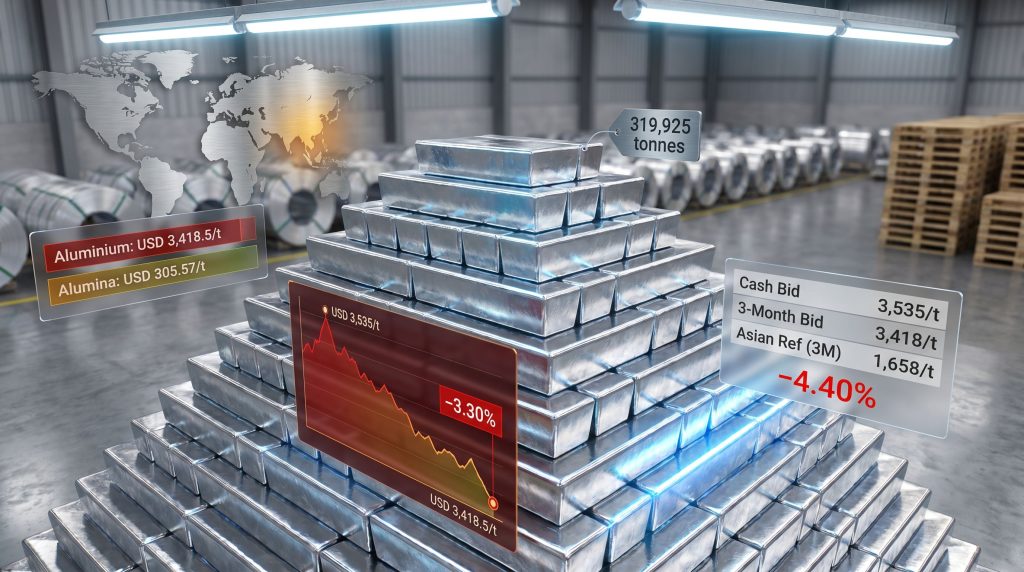
| Cash Bid | 3,535 | 3,418.5 | -3.30% |
| Cash Offer | 3,536 | 3,419.5 | -3.30% |
| 3-Month Bid | 3,531 | 3,430 | -2.86% |
| 3-Month Offer | 3,532 | 3,431 | -2.86% |
| Dec-27 Bid | 3,250 | 3,208 | -1.29% |
| Dec-27 Offer | 3,255 | 3,213 | -1.29% |
| Asian Reference (3M) | 3,535 | 3,379.5 | -4.40% |
Several features of this data are worth examining closely. The fact that the steepest single-session decline occurred in the Asian Reference Price, which fell 4.40% from USD 3,535/t to USD 3,379.5/t, suggests that demand weakness was most acutely felt in Asia-Pacific markets. China remains the world's largest consumer and producer of primary aluminium, and softness in Asian buying appetite carries outsized influence over global price direction.
Near-Term vs. Long-Dated Contracts: The Flattening Forward Curve
One of the more technically revealing features of the June 15 session was the differential rate of decline across tenors. Near-term contracts fell considerably harder than long-dated ones, with the cash price dropping 3.30% compared to just 1.29% for the December 2027 contract.
This relative resilience in the back end of the curve can be interpreted in two ways: either the market believes current weakness is transitory, or longer-dated prices are simply slower to reprice due to thinner liquidity in those contracts. The absolute level of the Dec-27 contract at USD 3,208/t is nonetheless telling. It suggests that the market does not anticipate a return to structurally elevated prices within an eighteen-month horizon, pricing in a subdued medium-term outlook rather than a sharp recovery.
The Inventory-Price Paradox: When Shrinking Stocks Cannot Support Prices
Breaking Down the LME Inventory Data: June 15, 2026
Key Market Insight: Standard commodity economics holds that inventory drawdowns are bullish for prices. Yet on June 15, LME aluminium prices fell sharply even as total warehouse stocks declined further. This disconnect between supply signals and price action is a powerful indicator that demand-side weakness was the dominant force in this session.
| Inventory Metric | Previous Level | June 15 Level | Change |
|---|---|---|---|
| Opening Stocks | 322,000 t | 319,925 t | -0.64% |
| Live Warrants | 250,525 t | 250,300 t | +0.90%* |
| Cancelled Warrants | 69,400 t | 69,200 t | -0.29% |
Note: The increase in live warrants alongside a decline in total stocks reflects a conversion dynamic between cancelled and live warrant categories.
What Cancelled Warrants Actually Signal
Cancelled warrants represent aluminium that has been earmarked for physical removal from LME-registered warehouses. When cancelled warrant levels are elevated or rising, it typically indicates genuine physical demand, with buyers pulling metal off the exchange to feed downstream industrial processes.
Conversely, a slight softening in cancelled warrants, as seen on June 15 where they eased from 69,400 tonnes to 69,200 tonnes, can suggest that the urgency of physical offtake is moderating. This nuance is often overlooked in headline price analysis.
The LME warrant system is a critical bridge between financial futures markets and the physical delivery chain. Rising live warrants alongside falling total stocks can indicate that previously earmarked metal is being converted back into the deliverable pool rather than removed — a subtle shift in physical market dynamics that can precede broader price directional changes. For further context on how these dynamics feed into the broader picture, aluminum and alumina markets have been navigating similarly complex cross-currents throughout 2025 and into 2026.
Mapping the June 2026 Downward Trajectory
From Resistance to Breakdown: A Timeline of Key Price Points
The June 15 session did not occur in isolation. It was the culmination of a week-long price struggle around the USD 3,500/t level:
- June 11: Cash price at USD 3,498/t, testing but failing to hold the USD 3,500/t threshold convincingly
- June 11: The three-month reference price briefly reclaimed USD 3,502/t, suggesting speculative interest at that level
- June 12: Cash bid recovered to USD 3,535/t, a short-lived move above resistance that proved unsustainable
- June 15: Cash bid collapsed to USD 3,418.5/t, representing a 3.3% single-session decline and a clean breakdown below the threshold
- June 15: Trading economics data recorded aluminium at USD 3,375.65/t, reflecting a 4.72% decline on the day across broader market data
Technical Correction or Structural Repricing?
The velocity of the June 15 move matters considerably. A 4.72% single-session decline in a major industrial metal is not routine noise. For context, aluminium's average daily price volatility typically sits well below 2% under normal market conditions.
A move of this magnitude suggests that something more than routine profit-taking or thin liquidity was at work. It points toward a rapid reassessment of the demand outlook, potentially triggered by macro data releases, shifts in Chinese production or export expectations, or deteriorating forward order books in key end-use sectors such as automotive, construction, and packaging.
Alumina Pricing and What It Means for Smelter Margins
The Widening Cost-Revenue Squeeze
Market Note: While aluminium prices faced severe downward pressure on June 15, LME alumina (Platts) moved in the opposite direction, closing at USD 305.57/t, a 0.19% gain from USD 305/t recorded at the June 12 close. This divergence between the cost of the primary input material and the price of the finished metal creates a direct margin compression signal for primary aluminium smelters worldwide.
The alumina-to-aluminium price ratio is a critical metric for assessing smelter economics. Alumina typically represents between 15% and 20% of the total cash cost of producing primary aluminium, with energy costs accounting for the largest share. When aluminium prices fall while alumina prices hold steady or rise, the cost-to-revenue spread tightens, placing pressure on smelter operating margins.
For higher-cost smelters, particularly those in markets with elevated electricity tariffs, this dynamic can quickly move from margin compression to genuine loss-making territory. The sustainability of smelting capacity at prices below USD 3,500/t therefore depends heavily on individual cost structures, energy contract arrangements, and hedging positions. Leading aluminium mining companies with diversified operations and lower-cost assets are better positioned to weather these margin pressures than smaller, single-asset operators.
The next major ASX story will hit our subscribers first
Macro Forces Amplifying Aluminium's Price Vulnerability
Demand Sector Pressures and Currency Dynamics
Multiple macro forces converged in mid-2026 to create a hostile environment for aluminium prices. Key among them:
- Construction sector slowdown: Housing and infrastructure activity, a major driver of aluminium extrusion demand, has faced headwinds in several major economies due to elevated interest rates and cautious capital expenditure
- Automotive sector uncertainty: The transition to electric vehicles is reshaping aluminium demand patterns, with some near-term disruption as automakers reconfigure supply chains and component specifications
- USD strength: As a USD-denominated commodity, aluminium prices face an inverse relationship with dollar strength. A firmer dollar increases the effective cost of aluminium for non-USD buyers, dampening purchasing activity
- Chinese export dynamics: China's continued capacity expansion and periodic surges in semi-fabricated aluminium exports create a structural supply overhang that periodically weighs on global prices, regardless of LME inventory movements
- Trade policy uncertainty: Unresolved tariff frameworks and shifting bilateral trade arrangements continue to discourage forward buying by downstream manufacturers seeking price visibility
Furthermore, China industrial demand trends continue to cast a long shadow over base metal markets broadly, as Chinese consumption patterns remain the single most consequential variable shaping global commodity price direction.
Reading the Forward Curve and Investor Positioning
What Dec-27 Prices at USD 3,208/t Reveal
The forward curve structure offers one of the clearest windows into collective market expectations. With the December 2027 contract trading at USD 3,208/t, the market is effectively pricing aluminium at a significant discount to current spot levels over an eighteen-month forward horizon.
This is a contango structure, where future prices sit below current spot prices in real-adjusted terms, suggesting that the market anticipates either improved supply availability, lower demand, or both over the medium term. Contango in aluminium markets also creates carry trade incentives for warehouse operators and financial intermediaries, who can buy physical metal, store it in LME warehouses, and simultaneously sell forward contracts to lock in a profitable spread.
This dynamic can paradoxically support physical inventory levels even as end-use demand softens, masking real consumption trends behind financial positioning. It is worth noting that similar dynamics have been observed across the global steel market outlook, where contango structures have also complicated the interpretation of inventory and demand signals.
Implications for Producers, Buyers, and Processors
Strategic Considerations Across the Value Chain
The June 15 price break carries different implications depending on where a market participant sits along the aluminium value chain:
For primary producers: Margin compression becomes acute below USD 3,500/t for mid-to-high cost smelters. Producers with legacy energy contracts or access to low-cost hydropower retain buffer room, but those reliant on spot energy markets face an increasingly difficult operating environment.
For downstream manufacturers: A price dip of this nature can represent a genuine strategic procurement opportunity, particularly for buyers who consume aluminium in large volumes and have flexibility in their purchasing timing. Locking in forward supply at prices approaching USD 3,400/t or below carries potential cost advantages if the current weakness is temporary.
For secondary and recycled aluminium operators: Scrap-based producers benefit from a lower LME benchmark to the extent that secondary metal premiums compress proportionally. However, if LME weakness persists, it can erode scrap collection economics as sellers hold material back, tightening the feedstock side of the secondary supply chain.
For physical market hedgers: Volatility of the magnitude seen on June 15 reinforces the importance of disciplined hedging programmes. Participants without structured price risk management in place are exposed to significant mark-to-market swings that can destabilise procurement budgets or production cost assumptions.
Frequently Asked Questions: LME Aluminium Price Drop Below USD 3,500/t
What does it mean when LME aluminium falls below USD 3,500 per tonne?
It signals a shift in market sentiment, often driven by demand concerns outweighing supply constraints. For producers, it represents a narrowing of operating margins. For buyers, it can create procurement opportunities. For the broader market, it typically triggers a reassessment of forward price expectations.
Why did aluminium prices fall even though LME inventories were declining?
Falling inventories are a supply-side signal, but price formation in commodity markets reflects the balance between supply and demand expectations simultaneously. When demand weakness is severe enough, it overrides bullish inventory signals, as buyers pulling back from the market are a more powerful near-term force than the inventory drawdown itself.
What is the LME aluminium three-month Asian Reference Price and why does it matter?
The Asian Reference Price is a separate pricing benchmark derived from LME three-month aluminium prices but calculated during Asian trading hours. It reflects the pricing of aluminium as it relates to Asian demand and trading activity, making it particularly relevant for contracts priced in reference to Asian market conditions. Its steeper 4.40% decline on June 15 compared to the broader three-month contract underscores concentrated demand softness in the Asia-Pacific region.
What are cancelled warrants and why are they relevant to aluminium price direction?
Cancelled warrants are warehouse receipts for aluminium that has been earmarked for physical removal from LME-approved storage. High and rising cancelled warrants suggest active physical demand, while declining or low cancelled warrants indicate that buyers are not urgently pulling metal from the system — a bearish signal for near-term physical demand.
How does the alumina price affect aluminium smelter profitability?
Alumina is the primary feedstock for primary aluminium production, typically representing 15% to 20% of total production costs. When alumina prices remain firm while aluminium prices fall, the cost-revenue margin for smelters compresses, reducing or eliminating operating profitability for higher-cost producers.
Is the June 2026 aluminium price drop a short-term correction or a longer-term trend?
The forward curve pricing Dec-27 contracts at USD 3,208/t suggests the market does not expect a rapid recovery to the USD 3,500/t level within the near to medium term. Whether this constitutes a structural repricing or a temporary correction will depend on the trajectory of Chinese demand, global manufacturing activity, energy costs, and the broader macroeconomic environment in the second half of 2026. For a broader perspective, recent LME aluminium analysis highlights that stocks continuing to decline alongside price weakness remains a key theme to monitor.
Key Takeaways From the June 15 LME Aluminium Session
- The USD 3,500/t level transitioned from price support to resistance following the June 15 breakdown, a technically significant shift for market participants tracking trend direction
- A 3.3% single-session decline in cash prices, and a broader 4.72% fall reflected in wider market data, exceeds normal daily volatility ranges and signals a meaningful demand-sentiment shift
- The Asian Reference Price's 4.40% decline to USD 3,379.5/t was the steepest move across all contract segments, pointing to concentrated selling pressure originating from or directed at Asia-Pacific market conditions
- Alumina's marginal 0.19% gain to USD 305.57/t on the same day that aluminium fell sharply creates a narrowing cost-revenue spread that will weigh on smelter margins globally
- Declining warehouse stocks proved insufficient to offset macro-driven selling pressure, confirming that demand expectations are the dominant price-forming force in the current environment
- Dec-27 contract pricing at USD 3,208/t embeds a cautious medium-term outlook into the forward curve, with no rapid recovery to prior highs priced into the market at this stage
Disclaimer: This article is intended for informational purposes only and does not constitute financial advice, investment recommendations, or trading guidance. Commodity prices are subject to significant volatility driven by macroeconomic conditions, geopolitical events, and market sentiment. Past price levels are not indicative of future performance. Readers should conduct their own due diligence and consult qualified financial professionals before making any investment or procurement decisions. All price data referenced is sourced from publicly available LME and market data platforms and is accurate as of the dates stated.
Want to Stay Ahead of the Next Major Mineral Discovery on the ASX?
While aluminium markets navigate complex demand signals and margin pressures, Discovery Alert's proprietary Discovery IQ model scans ASX announcements in real time, instantly identifying significant mineral discoveries and translating complex data into actionable opportunities for traders and investors at every experience level. Explore historic discoveries and their remarkable returns, then begin your 14-day free trial to position yourself ahead of the broader market.