
August 10, 2026
Why Aluminium Inventory Levels Are More Powerful Than They Appear
Most commodity observers focus on price movements as the primary signal of market health. But in the aluminium market, the volume of metal sitting in certified warehouses often tells a more nuanced and forward-looking story. Inventory dynamics at the London Metal Exchange function less like a passive ledger and more like a real-time barometer of physical supply and demand tension. When stocks contract steadily toward historically lean levels, the market is effectively communicating something that headline price moves alone cannot fully capture.
The data published for August 7, 2026 provides a compelling case study in how multiple layers of LME aluminium price and opening stocks information, prices across contract tenors, total stock figures, live warrants, and cancelled warrants, each reveal a distinct piece of the broader supply and demand puzzle.
When big ASX news breaks, our subscribers know first
Understanding the LME's Role in Global Aluminium Price Discovery
The London Metal Exchange operates as the world's primary benchmark venue for non-ferrous metals, and aluminium is among its most actively traded contracts. Unlike equity markets where pricing is driven by earnings expectations, LME aluminium pricing is anchored in physical supply fundamentals, energy cost structures, and regional demand signals. The exchange publishes multiple reference prices across different delivery horizons, creating a forward curve that encodes market expectations far beyond the current trading session.
Three price points carry particular analytical weight:
- Cash prices represent the cost of aluminium for immediate settlement, typically the most sensitive to near-term physical supply disruptions.
- 3-month prices reflect the dominant trading tenor on the LME and serve as the global pricing benchmark for most commercial aluminium contracts.
- Long-dated forward prices such as December 2027 capture longer-horizon expectations around supply additions, demand trajectories, and structural cost shifts.
The relationship between these price points, specifically whether the forward curve is in contango (futures above spot) or backwardation (spot above futures), carries significant information for market participants ranging from smelter operators to downstream manufacturers. Furthermore, shifts in the aluminum and alumina markets can amplify or dampen these forward curve signals considerably.
LME Aluminium Price and Opening Stocks: August 7, 2026 Snapshot
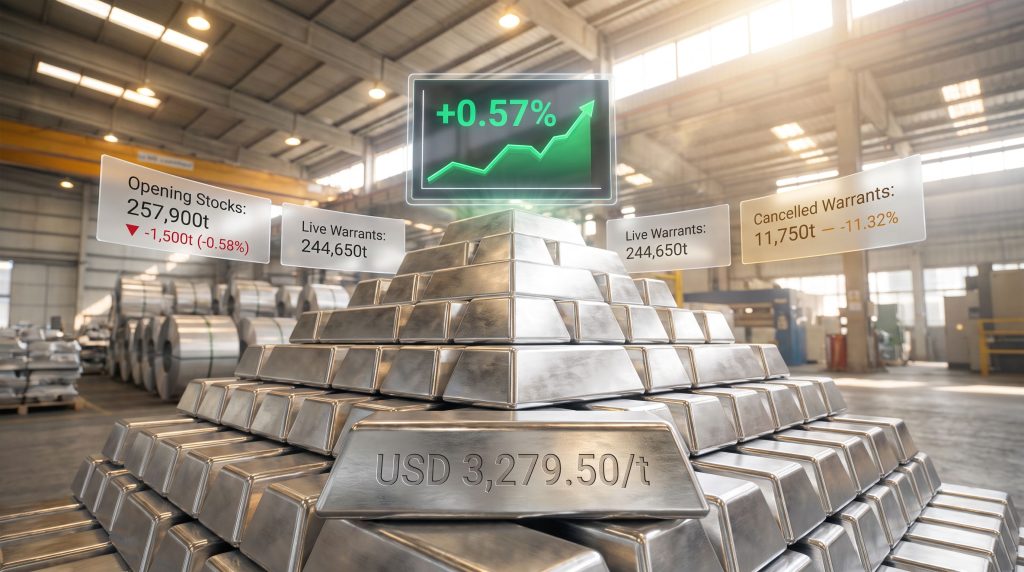
The August 7, 2026 session saw the LME aluminium price and opening stocks data converge to paint a picture of a market operating under restrained supply conditions with broadly constructive price momentum.
| Metric | August 6, 2026 | August 7, 2026 | Change |
|---|---|---|---|
| Cash Bid Price (USD/t) | 3,260.00 | 3,279.00 | +0.58% |
| Cash Offer Price (USD/t) | 3,261.00 | 3,279.50 | +0.57% |
| 3-Month Bid Price (USD/t) | 3,258.00 | 3,279.00 | +0.64% |
| 3-Month Offer Price (USD/t) | 3,260.00 | 3,280.00 | +0.61% |
| Dec 2027 Bid Price (USD/t) | 3,188.00 | 3,205.00 | +0.53% |
| Dec 2027 Offer Price (USD/t) | 3,193.00 | 3,210.00 | +0.53% |
| Opening Stocks (tonnes) | 259,400 | 257,900 | -0.58% |
| Live Warrants (tonnes) | 244,650 | 244,650 | Unchanged |
| Cancelled Warrants (tonnes) | 13,250 | 11,750 | -11.32% |
| LME Alumina Platts Price (USD/t) | – | 346.25 | – |
| 3-Month Asian Reference Price (USD/t) | – | 3,280.00 | – |
Every price point across the curve recorded gains on the day, with the 3-month bid registering the strongest percentage increase at 0.64%. The consistency of gains across all tenors suggests the session's upward move was driven by genuine market conviction rather than localised short-covering in a single contract.
Decoding the Forward Curve: What the Price Spread Signals
The Near-Flat Contango Between Spot and 3-Month
One of the most analytically significant observations from the August 7 data is the near-negligible spread between the cash offer price (USD 3,279.50/t) and the 3-month offer price (USD 3,280.00/t). This gap of just USD 0.50 per tonne is exceptionally compressed.
In a normal contango environment, the 3-month price exceeds the cash price by an amount roughly equivalent to the cost of carrying inventory, which includes warehouse fees, insurance, and financing costs. These carrying costs typically amount to several dollars per tonne per month, meaning a theoretically neutral market might show a 3-month premium of USD 10 to USD 20 per tonne above spot.
A near-flat spread therefore implies one of two conditions: either physical metal is genuinely tight enough to compress the time value embedded in forward contracts, or the market perceives near-term supply and demand as so well balanced that no meaningful premium is warranted for deferring delivery.
"When the contango collapses toward zero, it effectively tells physical buyers that deferring purchases offers almost no cost advantage. This creates a strong incentive for immediate procurement rather than postponing supply decisions."
What December 2027 Prices Reveal About Long-Term Aluminium Expectations
The December 2027 offer price of USD 3,210/t sits approximately USD 70 per tonne below the current 3-month offer. This modest inversion at the long end of the curve, a structure sometimes described as a partially inverted or humped forward curve, is noteworthy.
It suggests the market does not anticipate sustained price strength through to late 2027. Possible explanations include:
- Expectations of incremental primary aluminium supply additions from capacity currently under construction or restart consideration.
- Assumptions that energy cost pressures affecting smelter economics may ease somewhat over an 18-month horizon.
- Gradual demand moderation in key end-use sectors as macroeconomic conditions evolve.
For long-term hedgers, particularly smelter operators seeking to lock in revenue certainty, the December 2027 price level of USD 3,210/t represents a meaningful consideration when evaluating multi-year hedging programmes.
The Asian Reference Price as a Regional Alignment Signal
The LME 3-month Asian Reference Price of USD 3,280/t aligning almost precisely with the global 3-month offer price indicates that regional premiums and arbitrage pressures between Asian physical markets and LME pricing were effectively neutral on August 7. For Japanese, South Korean, and Southeast Asian aluminium consumers, who typically benchmark quarterly supply contracts against this figure, the tight alignment reduces the risk of unexpected cost differentials when rolling forward procurement agreements.
Warehouse Stocks and the Cancelled Warrant Signal
A Three-Layer Reading of LME Inventory
Understanding LME stock data requires unpacking three distinct but related figures:
- Total opening stocks represent the aggregate volume of aluminium in all LME-registered warehouses globally at session open. On August 7, this stood at 257,900 tonnes.
- Live warrants represent metal that is fully available for trading and physical delivery, the liquid component of total inventory. Live warrants held steady at 244,650 tonnes.
- Cancelled warrants represent metal that has been formally designated for physical removal from warehouse custody. These fell sharply from 13,250 to 11,750 tonnes, a decline of 11.32% in a single session.
Why the Cancelled Warrant Movement Deserves Attention
The 11.32% single-session drop in cancelled warrants is the most instructive data point in the August 7 dataset. Cancelled warrants are widely understood within the aluminium trading community as a leading indicator because they represent metal already committed to physical withdrawal, meaning the decline in total stocks has in effect been pre-announced before it shows up in the headline figure.
A sharp reduction in cancelled warrants does not necessarily signal that physical demand has weakened. It may instead reflect that a prior round of warrant cancellations has already been executed, with the corresponding metal having already left the warehouse system in prior sessions. The fall could also indicate that some metal owners deregistered their cancellation requests, choosing to retain warrants in LME custody rather than take physical delivery.
"Tracking the direction of cancelled warrants across multiple sessions is generally more informative than any single session reading. A sustained upward trend in cancellations over several weeks is considered a more reliable precursor to tighter physical availability and potential cash price premiums."
Historical Context: Why Sub-300,000 Tonnes Is a Structurally Significant Threshold
LME aluminium stocks have traversed an enormous range over the past two decades. Following the global financial crisis of 2008 to 2009, warehouse stocks swelled to multi-year highs above 5 million tonnes, as financing deals locked up vast quantities of metal in storage against low interest rate backdrops, creating a structural overhang that suppressed spot price premiums for years.
The contraction from those historic highs to the current sub-300,000 tonne environment represents a structural transformation of the LME aluminium market. At 257,900 tonnes, available inventory provides a considerably thinner buffer against unexpected demand surges or supply disruptions. This lean inventory backdrop is one reason why individual session price gains, such as the 0.57% move seen on August 7, can occur without large-scale fundamental catalysts. You can track live aluminium price data to monitor how these inventory shifts translate into real-time price movements.
The Alumina Cost Ratio: An Underappreciated Input Signal
With the LME alumina Platts price at USD 346.25/t against an aluminium cash price of USD 3,279.50/t, the alumina-to-aluminium price ratio sits at approximately 10.6%. This figure carries more analytical weight than it might initially appear.
| Cost Benchmark | Value (August 7, 2026) |
|---|---|
| LME Aluminium Cash Offer | USD 3,279.50/t |
| LME Alumina Platts Price | USD 346.25/t |
| Alumina/Aluminium Ratio | ~10.6% |
| Historical Alumina Cost Share | ~15-20% of production cost |
| Estimated Smelter Break-Even Range | USD 2,200-2,600/t |
| Implied Producer Margin (approx.) | USD 679-1,079/t |
In normal operating conditions, alumina represents roughly 15 to 20% of the total cash cost of producing primary aluminium. The current ratio of 10.6% implies that alumina is priced at a notable discount relative to its historical cost contribution to smelter economics. This could reflect:
- Excess refining capacity in key bauxite-producing regions, keeping alumina supply well ahead of demand.
- Softer bauxite pricing flowing through to alumina refinery economics.
- Regional oversupply in the seaborne alumina trade, potentially linked to shifts in Chinese import patterns.
For primary aluminium producers, a lower alumina-to-aluminium ratio mechanically expands gross margins, reinforcing the producer margin estimates shown above. At USD 3,279.50/t aluminium and with alumina priced well below its historical cost share, smelters operating on competitive power contracts are capturing exceptionally favourable margin conditions.
The next major ASX story will hit our subscribers first
Macro Forces Shaping the August 2026 Aluminium Price Environment
Middle East Geopolitical Risk and Energy Price Sensitivity
Persistent geopolitical instability in the Middle East introduces an indirect but material risk premium into aluminium pricing. Because aluminium smelting is one of the most energy-intensive industrial processes, accounting for approximately 14,000 to 17,000 kilowatt-hours of electricity per tonne of metal produced, any disruption to global energy supply chains elevates the cost floor for marginal producers. This energy sensitivity means that geopolitical risk in oil and gas markets indirectly supports aluminium price floors even in the absence of direct supply disruption to the metal itself.
Chinese Production Policy: The 800-Pound Variable
China produces approximately 55 to 60% of global primary aluminium, making its domestic policy environment the single most consequential supply-side variable in LME pricing. China's industrial demand outlook further compounds these dynamics, as shifts in construction and manufacturing activity ripple directly into aluminium consumption patterns. Key policy levers that influence Chinese output include:
- Power allocation and pricing for energy-intensive industries, particularly in provinces reliant on hydropower such as Yunnan.
- Environmental compliance enforcement, which can trigger temporary smelter curtailments during audit periods.
- Export duty structures that influence whether domestically produced aluminium flows into the international market or remains within China's domestic supply chain.
- The hard cap on total primary aluminium smelting capacity at approximately 45 million tonnes per annum, a structural policy constraint that limits China's ability to simply grow supply without bound.
Any credible signal of smelter curtailment in China tends to generate immediate upward pressure on LME aluminium prices, often before the physical impact on global supply has materialised. This forward-pricing mechanism means that Chinese policy risk is effectively priced in real time.
USD Dynamics and Their Inverse Relationship With LME Pricing
As a USD-denominated commodity, aluminium prices are subject to currency effects that operate independently of physical fundamentals. When the US dollar weakens against major trading currencies, LME aluminium becomes relatively cheaper for non-USD buyers, typically stimulating incremental demand and supporting price levels. The reverse dynamic applies during periods of dollar strength. Monitoring the US Dollar Index alongside LME aluminium data therefore provides a more complete picture of the forces driving price movements on any given session.
Trade Policy and Tariff Implications
In addition to currency and Chinese production dynamics, trade policy continues to influence global aluminium flows. The introduction of US aluminium tariffs has reshaped regional supply chains, diverting metal flows and creating price differentials between LME benchmarks and physical market premiums in North America. Furthermore, broader commodity price impacts across industrial metals have reinforced how interconnected tariff policy and LME pricing dynamics have become in the current environment. Meanwhile, global steel market trends offer a useful parallel, as both markets are sensitive to many of the same Chinese policy signals and macroeconomic headwinds.
Strategic Implications for Buyers and Producers
Procurement Strategy in a Near-Flat Contango Environment
The near-zero spread between spot and 3-month prices creates a specific strategic opportunity for downstream aluminium buyers. In a steep contango environment, buyers who defer purchases benefit from a lower forward price, effectively being rewarded for patience. With the curve nearly flat, that reward for deferral has disappeared. Forward purchasing or locking in near-term physical supply carries minimal cost penalty relative to deferring.
This dynamic is particularly relevant for:
- Automotive manufacturers with aluminium-intensive production schedules.
- Packaging converters with continuous rolling requirements.
- Construction sector buyers managing procurement windows across multi-month project timelines.
Risk Factors That Could Alter the Current Price Trajectory
Participants in the aluminium market should monitor several potential catalysts that could shift the current constructive environment:
- A reversal in Chinese smelter curtailment trends, with capacity additions outpacing demand growth, could rebuild global inventory and compress LME prices.
- Demand deterioration in automotive, construction, or packaging sectors, particularly in Europe and North America, represents the primary demand-side risk.
- A sharp strengthening of the US dollar could mechanically deflate LME-denominated aluminium prices even if physical fundamentals remain unchanged.
- An unexpected increase in LME warehouse deliveries, evidenced by rising cancelled warrants in subsequent sessions, would signal inventory rebuilding and likely cap near-term price upside.
Frequently Asked Questions: LME Aluminium Price and Opening Stocks
What is the LME aluminium cash offer price?
The LME aluminium cash offer price is the price at which sellers are willing to deliver aluminium for immediate settlement on the London Metal Exchange. On August 7, 2026, this price stood at USD 3,279.50 per tonne. For the latest benchmark figures, the LME official prices page provides daily updates across all contract tenors.
What are LME opening stocks?
LME opening stocks represent the total volume of aluminium held in LME-certified warehouses globally at the start of each trading session. On August 7, 2026, opening stocks totalled 257,900 tonnes.
What are cancelled warrants in the LME aluminium market?
Cancelled warrants represent aluminium inventory formally earmarked for physical removal from LME-registered warehouses. A rising cancelled warrant figure typically signals upcoming stock drawdowns and functions as a leading indicator of tightening physical supply. On August 7, cancelled warrants fell by 11.32% to 11,750 tonnes.
What does the near-flat contango between spot and 3-month prices mean?
A near-zero spread between the cash offer price and the 3-month offer price indicates the market perceives near-term supply and demand as closely balanced, with minimal cost-of-carry premium embedded in forward contracts. It removes the typical cost advantage of deferring physical procurement.
Why does the alumina-to-aluminium price ratio matter?
This ratio indicates how much of the aluminium production cost is attributable to alumina, the primary feedstock. When alumina prices are low relative to aluminium, smelter margins expand. The current ratio of approximately 10.6% sits well below the historical norm of 15 to 20%, implying broadly favourable smelter economics.
Why do LME aluminium stocks affect prices?
Lower warehouse stocks reduce the available buffer of physical metal, increasing the risk of near-term supply shortfalls. When inventory falls to historically lean levels such as the current sub-260,000 tonne environment, the market becomes more sensitive to demand spikes or supply disruptions, which typically supports stronger spot pricing.
Key Takeaways: LME Aluminium Price and Opening Stocks for August 7, 2026
- LME aluminium cash offer price reached USD 3,279.50/t, a gain of 0.57% from the prior session.
- The 3-month offer price of USD 3,280/t produced a near-flat contango of just USD 0.50/t versus spot, signalling balanced near-term supply-demand conditions.
- Opening stocks declined to 257,900 tonnes, maintaining a historically lean inventory environment that structurally limits price downside.
- A sharp 11.32% fall in cancelled warrants to 11,750 tonnes suggests that a prior wave of physical withdrawals has run its course, at least temporarily.
- Live warrants held steady at 244,650 tonnes, indicating no immediate disruption to tradeable physical supply availability.
- The alumina Platts price of USD 346.25/t implies an alumina-to-aluminium cost ratio of approximately 10.6%, well below the historical norm and broadly supportive of smelter margins.
- Chinese production policy, Middle East geopolitical risk, and USD dynamics remain the dominant macro variables shaping the aluminium price environment heading into the second half of 2026.
This article is intended for informational and analytical purposes only. It does not constitute financial or investment advice. Commodity markets involve significant risk, and forward-looking statements or price projections referenced herein reflect analytical interpretation rather than guaranteed outcomes. Readers should conduct their own due diligence before making any procurement or investment decisions based on commodity market data.
Want to Capitalise on the Next Major Mineral Discovery Before the Broader Market?
Discovery Alert's proprietary Discovery IQ model delivers real-time alerts on significant ASX mineral discoveries, transforming complex commodity data into clear, actionable investment insights for both short-term traders and long-term investors — explore historic discovery returns on Discovery Alert's dedicated discoveries page to understand the scale of opportunity, then begin your 14-day free trial to position yourself ahead of the market.