July 17, 2026
The Inventory Signal Most Commodity Traders Are Underestimating in 2026
Commodity markets have a long history of sending mixed signals, and aluminium is no exception. Price movements and warehouse inventory levels do not always move in lockstep, and the divergence between them often contains the most valuable forward-looking information available to traders and analysts. In mid-2026, that divergence has become one of the most closely watched dynamics across the base metals complex.
The relationship between physical availability and price discovery is rarely straightforward. When stocks decline steadily over months while prices oscillate in response to unrelated macro forces, the market is essentially building latent pressure beneath the surface. Understanding how that pressure eventually resolves is the key challenge for anyone tracking the LME aluminium price recovery and stocks dip narrative that has defined the first half of 2026.
When big ASX news breaks, our subscribers know first
Why Inventory Compression Matters More Than Daily Price Moves
LME warehouse stocks serve as one of the most transparent real-time indicators of physical market balance in the global aluminium industry. Unlike futures positioning data, which reflects financial intent, warehouse inventory figures represent actual metal in registered storage facilities available for delivery against exchange contracts.
When those stocks decline consistently over a multi-month period, it typically means one of two things: physical demand is absorbing supply faster than smelters and traders can replenish it, or available metal is being redirected away from LME-registered locations into off-warrant storage or direct supply chains. Either scenario carries bullish implications for price, though the mechanisms and timelines differ.
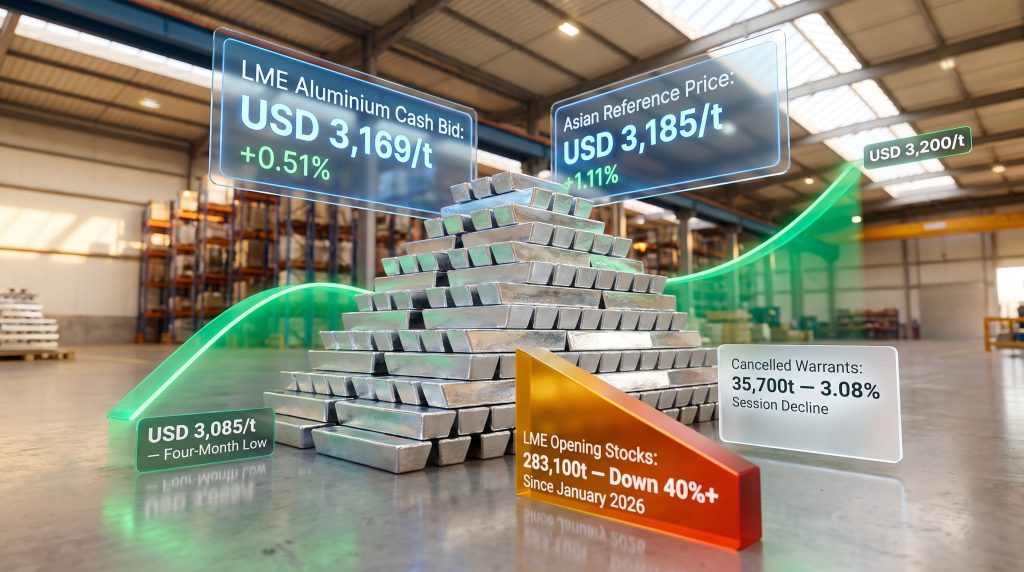
Since late January 2026, LME aluminium opening stocks have contracted by more than 40%, a compression that has few historical parallels outside of genuine supply disruption events. By July 16, 2026, opening stocks had reached 283,100 tonnes, down from 284,600 tonnes the previous session, representing a single-day decline of 0.53%.
In commodity markets, sustained inventory drawdowns of this magnitude rarely occur without underlying structural causes. The compounding effect of six consecutive months of stock erosion points toward a market where available supply is genuinely strained, not simply repositioned.
Understanding the July 16, 2026 LME Aluminium Session
The July 16 trading session delivered a broad-based recovery across the aluminium contract curve, with cash and futures prices all posting gains relative to the prior session.
| Contract Type | July 15 Price | July 16 Price | % Change |
|---|---|---|---|
| Cash Bid | USD 3,153/t | USD 3,169/t | +0.51% |
| Cash Offer | USD 3,153.5/t | USD 3,170/t | +0.52% |
| 3-Month Bid | USD 3,150/t | USD 3,166/t | +0.51% |
| 3-Month Offer | USD 3,150.5/t | USD 3,166.5/t | +0.51% |
| Dec 2027 Bid | USD 3,085/t | USD 3,100/t | +0.49% |
| Dec 2027 Offer | USD 3,090/t | USD 3,105/t | +0.49% |
| Asian Reference Price | USD 3,150/t | USD 3,185/t | +1.11% |
The most notable data point from the session was the Asian Reference Price, which climbed 1.11% to USD 3,185 per tonne, the strongest single-session percentage gain across the entire contract curve. This benchmark is specifically designed to reflect aluminium trading activity across Asian markets, and its outperformance on this date suggests that regional buying conviction was materially stronger than what spot or standard futures pricing reflected. Furthermore, this aligns closely with broader China industrial demand patterns that have been influencing base metals sentiment throughout the year.
What the Curve Shape Communicates About Forward Sentiment
The shape of the aluminium forward curve carries important information beyond headline price levels. On July 16, longer-dated December 2027 contracts recovered toward the USD 3,100/t level, suggesting that market participants with medium-term horizons are reassessing their price expectations upward. When recovery is visible across both the front of the curve and the longer end simultaneously, it indicates that the bullish signal is not purely speculative or driven by short-term positioning.
A critical but often overlooked detail: the forward curve for aluminium has been trading in a relatively flat-to-slight-contango structure through mid-2026. This matters because it reduces the financial incentive to hold metal in warehouses for carry trades, which historically have inflated LME stock levels artificially. The absence of a steep contango helps confirm that the current stock declines reflect genuine physical tightness rather than a technical repositioning of financial inventory.
The Inventory Data in Detail: Cancelled Warrants Deserve Closer Attention
| Inventory Metric | July 15, 2026 | July 16, 2026 | Change |
|---|---|---|---|
| Opening Stock | 284,600t | 283,100t | -0.53% |
| Live Warrants | 246,300t | 245,900t | -0.16% |
| Cancelled Warrants | 36,800t | 35,700t | -3.08% |
While the headline stock decline received the most attention, the 3.08% fall in cancelled warrants to 35,700 tonnes is arguably the more technically significant figure. Cancelled warrants represent metal that has been formally earmarked for physical withdrawal from LME-registered storage, essentially metal that has already been claimed and is in the process of leaving the warehouse system.
A decline in cancelled warrants means fewer tonnes are queued for imminent withdrawal. This does not reverse the broader bullish inventory narrative, but it does add nuance: near-term physical off-take pressure eased slightly on July 16, even as total stocks continued their downward trajectory. Traders who conflate total stock levels with cancelled warrant trends can misread short-term directional signals.
Cancelled warrants function as a leading indicator of physical demand intent. They tell you not just how much metal exists in the system, but how much is actively being pulled out. A drop in cancelled warrants on a day when total stocks also fall is a reminder that inventory dynamics operate across multiple timescales simultaneously.
The June 2026 Price Dislocation: A Case Study in Sentiment Override
One of the most instructive episodes in recent aluminium market history unfolded across approximately eight trading sessions in June 2026, when prices declined roughly 7.8% even as warehouse inventories continued shrinking. The driver was heightened uncertainty surrounding geopolitical tensions linked to US-Iran relations, which triggered a broad risk-off move across commodity markets.
This episode illustrates a fundamental truth about commodity pricing: physical fundamentals set the floor and ceiling of long-run price ranges, but sentiment and macro risk factors can dominate price action over shorter intervals. For traders and investors, the practical implication is that periods of sentiment-driven price weakness against a backdrop of tightening fundamentals can represent positioning opportunities, though timing such reversals is never straightforward.
The subsequent July recovery, with prices rebuilding from a four-month low near USD 3,085/t, was logical in retrospect. Once the acute uncertainty receded, the underlying supply tightness reasserted itself as the dominant pricing factor. However, ongoing US aluminium tariffs continue to add a layer of complexity to how these recoveries unfold across different regional markets.
Structural Shortage vs. Cyclical Tightness: How to Tell the Difference
Not all inventory drawdowns signal structural deficits. Some reflect seasonal demand patterns, temporary logistical disruptions, or financial positioning. The current aluminium situation, however, exhibits several characteristics that lean toward the structural end of the spectrum:
- Duration: A drawdown exceeding six months without meaningful replenishment phases is unusual and points to sustained demand absorption rather than a temporary dislocation.
- Breadth across contract maturities: The recovery on July 16 was consistent from cash prices through to December 2027 contracts, suggesting that medium-term market participants share the same fundamental assessment.
- Asian Reference Price leadership: The 1.11% gain in the Asian Reference Price outpacing spot and standard futures suggests that demand from the world's largest aluminium-consuming region remains robust, which is a structural driver rather than a speculative one.
- Alumina price stability: The LME alumina Platts price held unchanged at USD 330.2 per tonne. Since alumina is the primary input into primary aluminium smelting, its stability supports smelter margins and reduces the risk of demand-side curtailments triggered by input cost spikes.
| Period | Stock Direction | Price Direction | Market Interpretation |
|---|---|---|---|
| 2015-2016 | Rising sharply | Falling to multi-year lows | Classic oversupply cycle |
| 2021 | Surging | Declining | Post-pandemic demand mismatch |
| June 2026 | Declining | Falling ~7.8% | Geopolitical risk overriding fundamentals |
| July 2026 | Declining | Rising +0.51-0.52% | Physical tightness reasserting price leadership |
The next major ASX story will hit our subscribers first
The Alumina-to-Aluminium Price Ratio: A Margin Signal Worth Watching
With alumina Platts prices holding at USD 330.2/t while aluminium cash prices recovered to USD 3,169/t, the ratio between input costs and output revenue is providing a relatively comfortable margin environment for primary smelters. In addition, the alumina market pressures observed earlier in the cycle appear to have stabilised, which matters for supply-side projections: when smelter margins are healthy, producers have limited economic incentive to curtail output, which in theory should eventually alleviate the stock drawdown.
However, smelter output decisions are rarely made purely on spot margin calculations. Energy costs, which are not captured in the alumina-to-aluminium ratio, represent a significant and often volatile component of total smelting costs. In regions where power prices have risen sharply, smelters may still face margin pressure even when the metal-to-input ratio appears favourable.
This is a layer of complexity that pure LME data cannot reveal, and it is one reason why regional smelter capacity utilisation data and energy market conditions are essential complements to exchange-based inventory analysis.
Key Resistance and What USD 3,200/t Means for the Market
From a technical standpoint, the USD 3,200/t level represents a meaningful threshold for LME aluminium in the current market environment. Cash prices at USD 3,169/t sit approximately 1% below this level following the July 16 session.
A sustained break above USD 3,200/t would likely attract both momentum-driven buying and renewed media attention to the aluminium supply story, potentially accelerating the upward price move. Conversely, failure to break this level on a sustained basis could see prices consolidate or retrace, particularly if any near-term geopolitical uncertainty re-emerges or demand data from key end-use sectors disappoints.
The factors that could either sustain or interrupt the current recovery trajectory include:
Bullish drivers:
- Continued stock compression with no near-term restocking signals visible in warrant data
- Sustained Asian demand, as evidenced by the Asian Reference Price outperformance
- Medium-term confidence reflected in the December 2027 contract recovery toward USD 3,100/t
Bearish risks:
- Renewed geopolitical flare-ups capable of triggering another sentiment-driven sell-off
- Demand softening in aluminium-intensive end-use sectors including automotive, construction, and packaging
- USD strength, which compresses USD-denominated commodity prices across the board
How Downstream Industries Read LME Aluminium Price Movements
For manufacturers and fabricators operating downstream of primary aluminium production, LME price movements represent only part of the total cost equation. Physical premiums, which reflect the regional cost of sourcing aluminium above the LME benchmark, can add meaningfully to effective prices, particularly in markets where local supply is tight relative to demand.
When LME stocks are declining at the pace seen in 2026, regional physical premiums tend to rise in tandem as buyers compete for available spot supply. This creates a compounding effect where the total delivered cost of aluminium increases faster than headline LME prices suggest, putting additional pressure on downstream margins. Consequently, this dynamic mirrors similar cost pressures observed in green steel pricing trends, where input cost volatility compounds faster than headline benchmarks indicate.
Sophisticated buyers and supply chain managers typically hedge their LME exposure using futures contracts or structured purchasing agreements, but physical premium risk is harder to hedge and often catches less well-prepared buyers off-guard during periods of sustained inventory compression.
Frequently Asked Questions
What drove the LME aluminium price recovery and stocks dip on July 16, 2026?
The recovery was underpinned by continuing inventory compression, with opening stocks falling to 283,100 tonnes, combined with renewed buying interest across both cash and futures markets. All contract maturities gained between 0.49% and 0.52%, with the Asian Reference Price leading at 1.11%.
What does the 40%+ stock decline since January 2026 actually mean?
It means that the cushion of deliverable aluminium available within the LME warehouse system has shrunk dramatically over six months, tightening the market and reducing the buffer that typically absorbs demand spikes or supply shortfalls. Historical precedents for drawdowns of this scale outside of genuine disruption events are limited.
Why did prices fall in June 2026 even though stocks were declining?
Geopolitical uncertainty linked to US-Iran tensions triggered a broad risk-off environment that temporarily overrode the bullish physical fundamentals. This kind of sentiment-driven dislocation is well-documented in commodity markets and typically resolves once the acute uncertainty passes.
What are cancelled warrants and why did they fall 3.08% on July 16?
Cancelled warrants represent metal formally earmarked for withdrawal from LME-registered storage. The 3.08% decline to 35,700 tonnes on July 16 indicates that near-term physical withdrawal demand eased slightly, even as the broader stock drawdown continued. This nuance is important for separating short-term demand signals from the longer-term supply deficit story.
Why did the Asian Reference Price outperform all other contracts on July 16?
The Asian Reference Price is a dedicated benchmark for aluminium trading across Asian markets. Its 1.11% gain to USD 3,185/t reflects stronger buying conviction in the region compared to Western markets, consistent with Asia's role as the world's dominant aluminium consuming centre.
Is the LME alumina Platts price relevant to aluminium investors?
Alumina is the key feedstock for primary aluminium smelting. Its stability at USD 330.2/t supports smelter margins, reducing the likelihood of production curtailments that could eventually relieve stock pressure. Monitoring the alumina-to-aluminium price ratio provides insight into whether supply-side economics support continued or expanded production.
Critical Takeaways for Market Participants
The July 16 LME aluminium session delivered more information than its modest headline price gains suggest. The convergence of sustained inventory compression, Asian Reference Price leadership, and medium-term contract recovery paints a picture of a market where physical tightness is progressively reasserting itself as the dominant pricing force.
Key points worth retaining:
- LME aluminium opening stocks fell to 283,100 tonnes on July 16, continuing a drawdown of more than 40% since late January 2026
- Cash bid prices recovered from USD 3,153/t to USD 3,169/t, a gain of 0.51%, while the Asian Reference Price led the curve with a 1.11% rise to USD 3,185/t
- Cancelled warrants declined 3.08% to 35,700 tonnes, adding nuance to the near-term demand picture without undermining the broader bullish inventory thesis
- LME alumina Platts prices held at USD 330.2/t, supporting smelter margin stability
- The June 2026 sentiment-driven price dislocation serves as a standing reminder that macro risk factors can temporarily decouple price from physical fundamentals, creating both risk and opportunity for informed market participants
- The USD 3,200/t resistance level remains the key short-term technical threshold to watch for confirmation of sustained recovery momentum
Readers seeking broader context on LME aluminium pricing trends and global aluminium market developments may find value in exploring historical aluminium price data from Westmetall, which tracks LME cash prices across extended timeframes. Furthermore, top aluminium producers continue to navigate the interplay between these inventory signals and their own production and hedging strategies as the second half of 2026 unfolds.
Want to Position Yourself Ahead of the Next Major ASX Mineral Discovery?
Discovery Alert's proprietary Discovery IQ model delivers real-time alerts on significant ASX mineral discoveries, instantly translating complex commodity data into actionable insights for both short-term traders and long-term investors — explore historic discoveries and their extraordinary returns to understand what early positioning can mean, then begin your 14-day free trial at Discovery Alert to secure your market-leading edge.