July 17, 2026
When a Narrow Waterway Holds the World's Energy Hostage
Throughout modern industrial history, the global economy has operated on an implicit assumption: that the arteries supplying its energy would remain open. That assumption has rarely been stress-tested at the scale now unfolding in the Persian Gulf. The Strait of Hormuz oil supply disruption, now stretching past four months, is not merely a regional conflict's side effect. It is a structural fracture in the foundation of global energy logistics, and its full consequences are still being absorbed by markets, governments, and households across three continents.
When big ASX news breaks, our subscribers know first
Why the Strait of Hormuz Is the World's Most Consequential Energy Corridor
The Strait of Hormuz is a narrow maritime passage sitting between the southern coast of Iran and the northern tip of Oman. At its most restricted navigable point, the waterway measures approximately 33 kilometres across, yet this geographical bottleneck handles a volume of energy that no other single maritime route on Earth comes close to matching.
Under normal operating conditions, between 15 and 20 million barrels per day of crude oil and petroleum products pass through this corridor, representing approximately one-fifth of total global oil consumption. However, crude oil is only part of the picture. Roughly 20% of global LNG supply also transits this route, meaning the strait simultaneously anchors both the liquid fuels and gas supply chains for much of the world.
No Viable Alternative at Scale
What makes the strait uniquely dangerous as a chokepoint is not just its volume, but the absence of any credible bypass capable of absorbing that volume. Saudi Arabia's East-West Pipeline and the Abu Dhabi Crude Oil Pipeline (ADCOP) offer partial alternatives for Gulf producers, but their combined throughput capacity falls well short of replacing full Hormuz flows. For LNG, furthermore, no pipeline alternative exists at all.
The nations most structurally exposed are those in Asia. Japan, South Korea, India, Pakistan, and Bangladesh collectively sourced between 80 and 90% of their energy imports via this corridor before the conflict began. For these economies, the Strait of Hormuz was not simply an important route; it was the route. As the Brookings Institution has noted, no other chokepoint carries comparable systemic risk for global energy security.
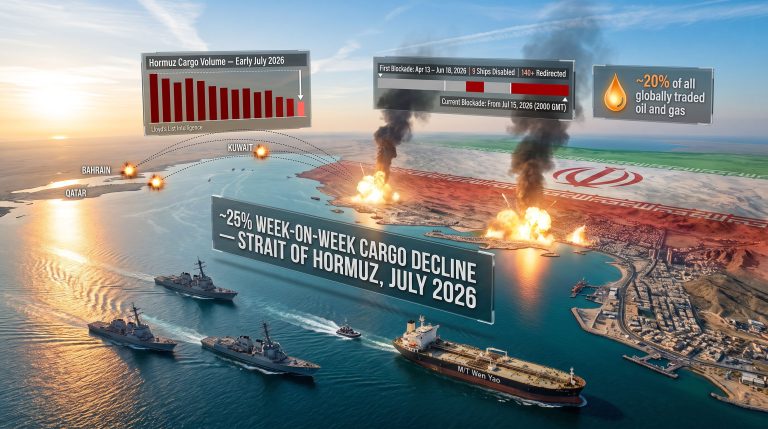
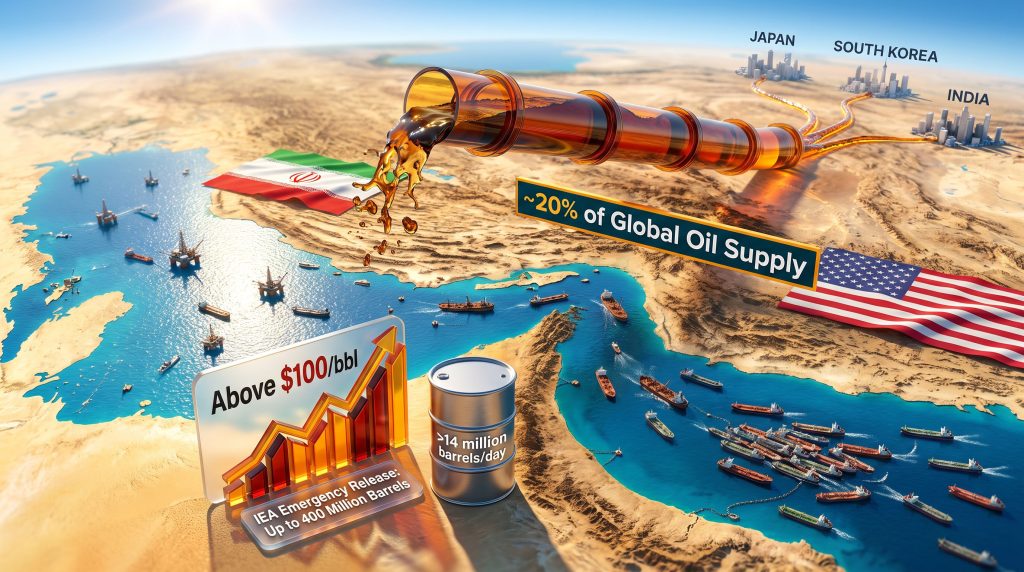
The Strait of Hormuz carries approximately 20% of the world's total oil supply and 20% of global LNG trade. No other single maritime chokepoint handles a comparable share of global energy flows.
The Conflict That Closed the Strait
February 2026: The Flashpoint
The closure effectively began on February 28, 2026, following US and Israeli military strikes on Iran. Iran's response moved swiftly from diplomatic protest to physical enforcement. Iranian naval and Islamic Revolutionary Guard Corps (IRGC) assets began targeting commercial oil tankers transiting the waterway, and Tehran issued a formal declaration that the strait was closed to international shipping.
What emerged in the weeks that followed was a de facto enforcement regime in which vessels seeking safe passage reportedly faced a toll-like system controlled by IRGC forces. The practical outcome was a near-total collapse of commercial shipping through the corridor.
The Scale of Disruption: By the Numbers
The raw statistics from the closure period reveal a disruption without precedent in the history of energy markets.
| Metric | Estimated Figure |
|---|---|
| Reduction in ship traffic | 80–90% decline from pre-conflict levels |
| Vessels stranded in or near the waterway | Approximately 150 to 1,000 ships |
| Duration of closure (as of July 2026) | Approximately 4.5 months |
| Daily oil flow disrupted | ~11 million barrels per day |
| Net supply shortfall vs. pre-war demand | ~9 million barrels per day |
| Conflict start date | February 28, 2026 |
The IEA's initial modelling had projected the closure might last until late May 2026. As of mid-July 2026, that estimate had been significantly exceeded, with no clear resolution timeline in view.
How This Disruption Compares to Every Previous Energy Shock
Energy market analysts and institutional bodies including the IEA have described the current Strait of Hormuz oil supply disruption as the largest supply disruption in the history of the global oil market. To appreciate the weight of that claim, it is worth mapping it against the benchmark crises of the 20th century.
| Crisis | Approximate Supply Removed |
|---|---|
| 1973 Arab Oil Embargo | 4–5 million barrels per day |
| 1979 Iranian Revolution | 5–6 million barrels per day |
| 1990 Gulf War | ~4–5 million barrels per day |
| 2026 Strait of Hormuz closure | >14 million barrels per day affected |
Every major oil shock of the 20th century removed between 4 and 6 million barrels per day from global markets. The current Strait of Hormuz closure has suppressed flows by more than double that magnitude, placing it in an entirely different category of systemic risk.
A Structurally Different Kind of Shock
What distinguishes this crisis from all prior oil shocks is not simply its scale, but its mechanism. Previous disruptions were primarily production-side events, meaning they reflected damage to or deliberate reduction of output at the source. This crisis is, however, a transit-side blockage, simultaneously affecting the export capacity of multiple major producing nations at once.
The knock-on consequences have compounded in ways not seen before. Saudi Arabia, Iraq, and Kuwait have begun curtailing their own production as onshore storage facilities approach maximum capacity. When a nation has nowhere to put the oil it pumps, it stops pumping. This cascading dynamic, where a shipping blockage suppresses upstream production, represents a novel feedback loop with no clear historical template.
The disruption is also multi-commodity in nature. Unlike earlier crises that primarily affected crude oil flows, the current blockage simultaneously restricts LNG supply chains and refined petroleum products including jet fuel, creating interlocking pressures across energy categories. Consequently, the oil market disruption is being felt far beyond the immediate region.
The Global Response: Emergency Measures and Their Limits
IEA Strategic Reserve Release
The IEA's coordinated response centred on authorising the release of up to 400 million barrels from the strategic petroleum reserves of its more than 30 member nations. This was the largest coordinated emergency withdrawal in the organisation's history by a considerable margin.
The March 2026 release had an immediate and measurable market impact, reducing oil prices by approximately $20 per barrel and signalling to markets that institutional firepower remained available for further deployment if conditions deteriorated.
However, IEA Executive Director Fatih Birol has been explicit about the constraints of this tool. The 400 million barrel release, while historically unprecedented, represented only approximately 20% of total IEA member strategic reserves, leaving roughly 80% still held in reserve. Yet even the full reserve capacity cannot substitute for normalised Hormuz flows indefinitely. The 400 million barrels covers only around 20 days of normal strait throughput, functioning as a market buffer rather than a structural solution.
IEA member nations collectively hold strategic petroleum reserves sufficient to cover months of normal supply. The 400 million barrel release, while historically unprecedented in scale, addresses only the short-term price signal, not the structural supply gap created by a prolonged closure.
US Production Response
As the world's largest oil and gas producer, the United States has increased domestic output in response to the crisis. The estimated production increase ranges from 1 to 2 million barrels per day, a contribution that has provided meaningful but bounded relief.
Birol acknowledged the significance of the US production response while being direct about its ceiling. An increase of 1 to 2 million barrels per day is achievable within existing infrastructure. A surge of 10 million barrels per day, which would be required to genuinely offset Hormuz losses, is not physically possible given current US production capacity and infrastructure constraints.
China's Strategic Stockpile and Demand-Side Adjustment
China entered the conflict period holding a pre-war strategic oil stockpile estimated at more than 1 billion barrels, one of the largest national reserves ever accumulated. Beijing has drawn on this stockpile while simultaneously deploying demand-side conservation policies, including accelerated electric vehicle uptake and expanded public transport utilisation.
These measures have moderated global price pressure at the margin, but Birol has been unambiguous: these moderating factors are time-limited. The stockpile depletes. The conservation measures cannot fully offset industrial and transport fuel demand. As Birol stated at a Council on Foreign Relations event on July 17, 2026, the factors that have moderated the price rise cannot last forever.
Who Is Bearing the Heaviest Economic Burden
The Asymmetry of Energy Pain
The economic damage from this disruption has been distributed in deeply unequal ways. Geographic proximity to the Persian Gulf and pre-existing energy import dependency have determined exposure far more than GDP or institutional capacity. In addition, geopolitical trade tensions have further complicated efforts to establish alternative supply arrangements.
Asia absorbs by far the greatest share of the impact. Developed Asian economies including Japan and South Korea face severe import cost pressures, with energy security implications that are now openly discussed at the highest levels of government in both countries. However, it is the developing economies, particularly India, Pakistan, and Bangladesh, that are absorbing the most acute shortfalls in petroleum product availability.
The Humanitarian Dimension
A critically underreported dimension of this crisis involves its impact on household energy access in lower-income nations. As petroleum products become unaffordable across parts of South Asia and Sub-Saharan Africa, households are reverting to biomass alternatives including wood and dung for cooking and heating.
As petroleum products become unaffordable in parts of South Asia and Sub-Saharan Africa, households, particularly women and children, are reverting to biomass fuels including dung and wood for cooking. These alternatives carry significantly higher indoor air pollution risks, creating a secondary public health crisis layered on top of the economic shock.
This link between energy affordability and public health outcomes, particularly for women and children who spend the most time in cooking environments, represents a slow-moving humanitarian consequence largely invisible in financial market analysis but significant in long-run development terms.
European Exposure
Europe's exposure is less direct but structurally significant. Approximately 30% of Europe's jet fuel supply relies on refinery feedstocks and refined products that transit the Strait of Hormuz. European LNG import dependency adds further vulnerability, given that approximately one-fifth of global LNG moves through the strait. European energy costs have risen materially even without direct geographic proximity to the Gulf.
The next major ASX story will hit our subscribers first
Oil Price Dynamics and Market Psychology
What Markets Are Currently Pricing
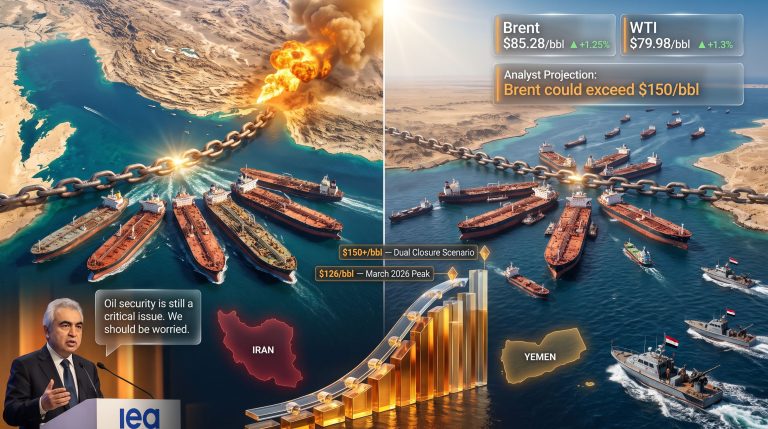
Oil prices surged past $100 per barrel following the closure, reaching levels not recorded since 2022. The trajectory reflects markets pricing in both the immediate supply shortfall and significant uncertainty about the duration and eventual resolution of the disruption. For a broader perspective on these movements, crude oil price trends have become a closely watched indicator for institutional and retail investors alike.
The moderating factors currently in play have prevented a more severe price spike:
- China's strategic stockpile drawdown of over 1 billion barrels
- US production increases of 1 to 2 million barrels per day
- IEA coordinated reserve release of up to 400 million barrels
- Demand destruction in price-sensitive developing markets
Each of these moderating factors is finite. China's stockpile depletes over time. US production has physical limits. IEA reserves, while substantial, are not designed for indefinite substitution of normal supply. The IEA itself has stated that these buffers cannot last forever.
Analysts have drawn explicit comparisons to the 1970s energy shock era, warning that entrenched inflationary pressure becomes increasingly likely the longer the closure extends into the second half of 2026. Furthermore, the current crude oil prices continue to reflect the profound uncertainty surrounding any diplomatic resolution.
Scenario Modelling: Three Possible Trajectories
| Scenario | Conditions | Expected Market Impact |
|---|---|---|
| Rapid Reopening (within weeks) | US-Iran diplomatic breakthrough; IRGC withdraws blockade | Prices fall sharply; 3–6 month recovery period |
| Prolonged Closure (3–6 more months) | Diplomatic stalemate; continued IRGC enforcement | Oil sustains above $100/bbl; secondary LNG crisis deepens |
| Partial Reopening (controlled access) | Negotiated transit framework; limited vessel passage | Prices stabilise but remain elevated; supply uncertainty persists |
Why Reopening Is Not the Same as Recovery
Energy institutions and market analysts have consistently emphasised that even in an optimistic rapid reopening scenario, market normalisation would take months rather than days. The reasons are structural:
- Stranded vessel backlogs of up to an estimated 150 to 1,000 ships requiring orderly transit sequencing
- Depleted downstream inventories across Asian markets requiring systematic replenishment
- Insurance and shipping rate normalisation timelines following months of elevated war-risk premiums
- Refinery restart and scheduling delays for facilities that have adjusted operations around reduced feedstock availability
- Rebuilding of commercial stockpiles drawn down during the extended crisis period
The Long-Term Strategic Reckoning
Accelerating Energy Diversification Debates
The Strait of Hormuz oil supply disruption has converted what was previously a theoretical discussion about chokepoint risk into an urgent policy imperative. Long-term structural responses being discussed across government and industry include:
- Expanded pipeline infrastructure capable of bypassing the Gulf, including potential capacity expansion of Saudi Arabia's East-West Pipeline
- Significantly increased strategic petroleum reserve capacity across Asian nations, particularly Japan, South Korea, and India
- Accelerated investment in domestic energy production across import-dependent economies
- Faster renewable energy deployment timelines as geopolitical risk permanently reprices fossil fuel dependency
The EIA has highlighted that the structural dependency on Gulf energy corridors has long been a known vulnerability, yet investment in alternatives has consistently lagged behind the rhetoric surrounding energy security.
The Transition Gap Problem
Paradoxically, the crisis may well accelerate EV adoption and renewable energy investment timelines in the most severely affected nations. The economic pain of fossil fuel dependency is now acutely visible, and policy incentives to reduce that dependency have strengthened considerably.
However, the short-to-medium-term reality is that energy system transitions occur over decades, not quarters. The current disruption exposes what energy analysts have begun describing as the transition gap: the period during which economies remain too dependent on fossil fuels to absorb a major supply shock without severe economic damage, but are not yet sufficiently diversified in their energy mix to avoid one. The nations caught most squarely in that gap are the developing economies of South and Southeast Asia.
Key Statistics Reference: Strait of Hormuz Oil Supply Disruption
| Data Point | Figure |
|---|---|
| Share of global oil supply transiting the strait | ~20% (15–20 million barrels/day) |
| Share of global LNG trade transiting the strait | ~20% |
| Decline in ship traffic since closure | 80–90% |
| Estimated stranded vessels | 150–1,000 ships |
| Net daily supply shortfall | ~9 million barrels/day |
| Total affected output (IEA estimate) | >14 million barrels/day |
| IEA emergency reserve release | Up to 400 million barrels |
| Price impact of IEA release | ~$20/barrel reduction |
| Current oil price level | Above $100/barrel |
| China's pre-war strategic stockpile | >1 billion barrels |
| US production increase | ~1–2 million barrels/day |
| Asia's pre-crisis Hormuz energy dependency | 80–90% of regional imports |
| Europe's jet fuel supply at risk | ~30% |
| Closure start date | February 28, 2026 |
Frequently Asked Questions
How much oil normally flows through the Strait of Hormuz?
Under normal conditions, approximately 15 to 20 million barrels per day of crude oil and petroleum products transit the Strait of Hormuz, representing roughly 20% of global daily oil consumption.
When did the current closure begin?
The closure effectively began following US and Israeli military strikes on Iran on February 28, 2026, and Iran's subsequent declaration that the strait was closed to international shipping.
Which countries are most severely affected?
Asian nations are most severely impacted. Japan, South Korea, India, Pakistan, and Bangladesh face the most acute supply pressures, having sourced between 80 and 90% of their energy via this corridor before the conflict.
How long will oil markets take to recover after reopening?
Energy analysts project that even after the strait reopens, full market normalisation, including inventory replenishment, shipping backlog clearance, and price stabilisation, could take several months.
Could this trigger a 1970s-style energy crisis?
The comparison has been explicitly raised by analysts and institutional voices. The current disruption is structurally larger than the 1973 Arab Oil Embargo, making the historical parallel a legitimate risk scenario rather than alarmism. Whether it produces equivalent macroeconomic damage depends heavily on how quickly a diplomatic resolution emerges. The IEA's analysis of supply readjustment offers further insight into how markets are adapting under these extraordinary conditions.
Readers seeking ongoing coverage of developments related to the Strait of Hormuz oil supply disruption and broader energy security issues can follow reporting published by Arab News at arabnews.com.
This article contains forward-looking scenario analysis and references to market projections. Such projections involve inherent uncertainty and should not be interpreted as financial advice. Readers should conduct independent research and consult qualified professionals before making decisions based on energy market conditions.
Want to Position Ahead of the Next Major Resource Discovery?
The energy security crisis reshaping global supply chains is also accelerating investment into alternative commodities and domestic resource development — and Discovery Alert's proprietary Discovery IQ model instantly notifies subscribers of significant ASX mineral discoveries the moment they are announced, turning complex data across more than 30 commodities into clear, actionable opportunities. Explore how historic discoveries have generated substantial returns on Discovery Alert's dedicated discoveries page, and begin your 14-day free trial today to ensure you are positioned ahead of the broader market.