July 17, 2026
When Two Chokepoints Collide: The Geometry of a Global Oil Crisis
Energy security analysts have spent decades modelling worst-case scenarios for global oil supply disruption. Most of those models assume a single point of failure: one corridor closes, alternative routes absorb the shock, prices spike but eventually stabilise. What the world is now confronting in mid-2026 is something those models struggled to fully price in: US-Iran hostilities and Red Sea closure threat oil prices across two of the most strategically irreplaceable maritime energy corridors on the planet.
The mathematics of dual chokepoint risk are not linear. When one corridor closes, rerouting options exist. When both close, those options collapse. The compounding effect on global supply chains moves from manageable to potentially catastrophic in ways that historical precedents do not adequately capture.
Understanding what is driving crude prices higher in July 2026 requires more than reading daily price moves. It requires grasping the structural geography of how the world moves oil, and how crude oil trade geopolitics shape the risk landscape at every level.
When big ASX news breaks, our subscribers know first
The Architecture of Global Oil Logistics: Why Chokepoints Matter So Much
Most oil-importing nations receive their crude via a relatively small number of maritime passages. Unlike land-based supply chains, which can be rerouted across dozens of alternative corridors, seaborne crude oil is funnelled through narrow geographic bottlenecks that cannot simply be bypassed.
The Strait of Hormuz and the Bab el-Mandeb strait at the southern entrance to the Red Sea are the two most consequential of these passages in the context of Middle Eastern supply. What makes the current situation so structurally dangerous is not merely that both are under threat, but that they are functionally linked: Saudi Arabia has been using the Red Sea route as a deliberate workaround for Hormuz-related disruptions. Threaten both simultaneously, and the workaround itself disappears.
The Strait of Hormuz: Irreplaceable by Design
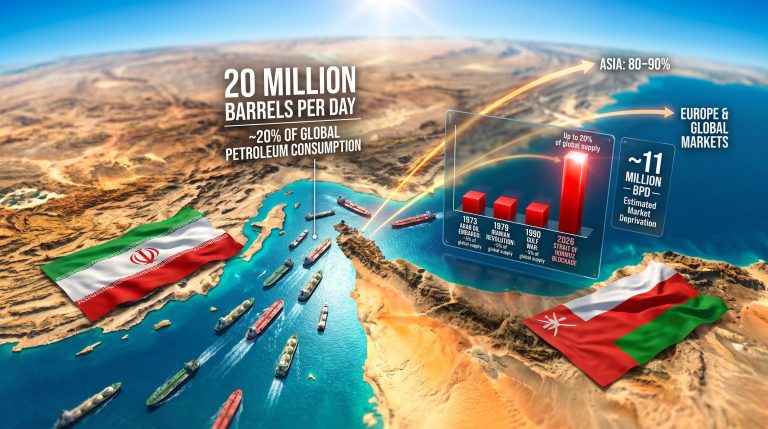
The Strait of Hormuz connects the Persian Gulf to the Gulf of Oman and the broader Indian Ocean. Under normal operating conditions, approximately 15 million barrels of crude oil and liquefied natural gas per day transit this narrow passage, representing roughly 20% of global daily oil and LNG supply.
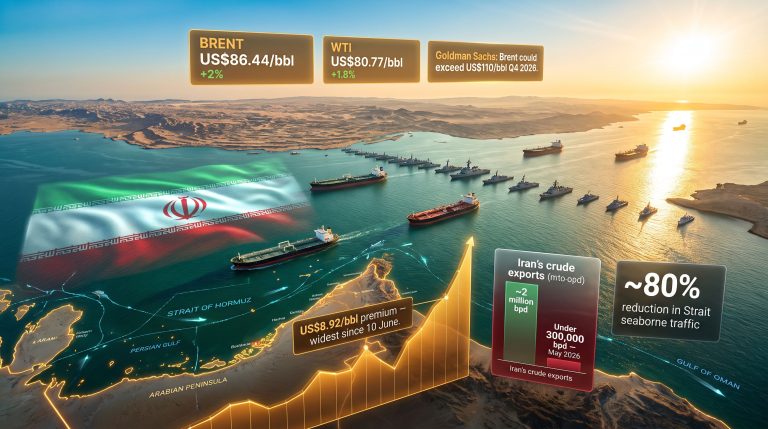
There is no viable large-scale alternative to this route for Gulf producers. The strait is, in the most literal sense, a geographic monopoly on Persian Gulf energy exports. Since late February 2026, escalating military exchanges between US and Iranian forces have severely disrupted normal shipping operations. Tanker operators, war-risk insurers, and flag-state authorities have progressively withdrawn from or restricted movement through the corridor, sending throughput well below historical norms.
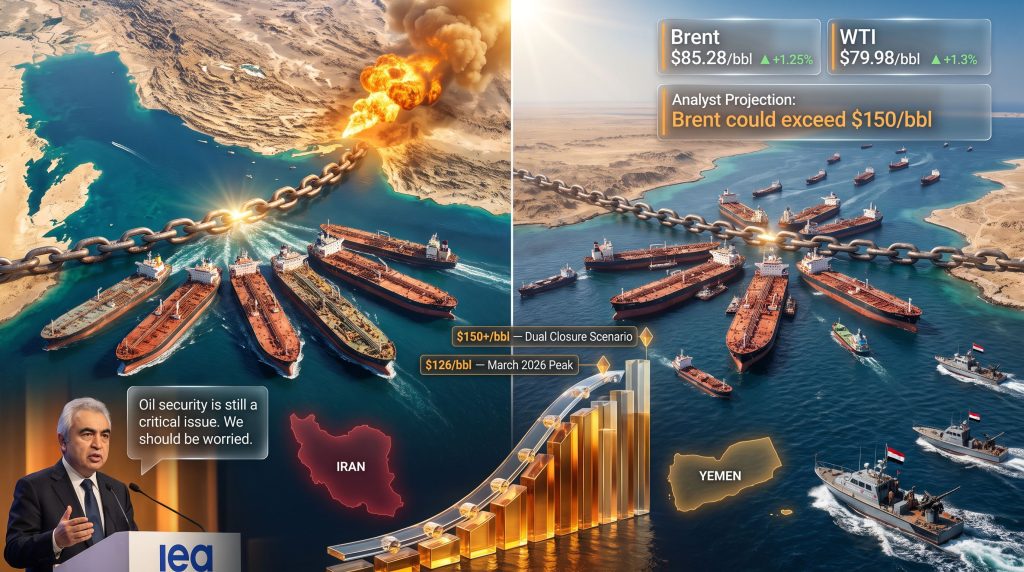
The initial market reaction was sharp. Brent crude briefly touched $126 per barrel in March 2026 at the peak of the first Hormuz closure shock, prompting emergency strategic petroleum reserve releases from IEA member nations and urgent diplomatic engagement.
The Red Sea and Bab el-Mandeb: The Backup That Cannot Afford to Fail
Saudi Arabia responded to Hormuz disruptions by accelerating crude exports through its Yanbu terminal on the Red Sea's eastern shore. This route bypasses the Strait of Hormuz entirely, channelling oil northward through the Red Sea and either through the Suez Canal toward European markets or via the Bab el-Mandeb strait toward Asian buyers.
Saudi Arabia has redirected approximately 70% of its crude export volumes through this Red Sea corridor as a consequence of Hormuz-related disruptions. That figure underscores just how much systemic weight is now resting on a secondary route that was never designed to carry this level of strategic load.
| Chokepoint | Normal Daily Volume | Current Status (July 2026) | Escalation Price Scenario |
|---|---|---|---|
| Strait of Hormuz | ~15 million barrels/day | Severely disrupted since late February 2026 | Brent peaked at $126/bbl in March 2026 |
| Bab el-Mandeb / Red Sea | Significant redirected flows (~70% of Saudi Yanbu exports) | Threatened; Houthi forces on standby alert | Analyst projections: Brent could exceed $150/bbl |
Brent and WTI Price Performance: Where Markets Stand on July 17, 2026
As of early Friday morning on July 17, 2026, both major crude benchmarks recorded meaningful session gains:
- Brent Crude Futures rose to $85.28 per barrel, advancing $1.05, or approximately 1.25%, during the session
- WTI (West Texas Intermediate) climbed to $79.98 per barrel, up $1.03, or 1.3%, reversing losses recorded in the prior session
The weekly performance context is striking. Both Brent and WTI have gained approximately 12% across the course of the week as of July 17, 2026. Brent is on track to record its third consecutive weekly gain, while WTI is heading toward a second consecutive weekly advance. This sustained upward momentum reflects a geopolitical risk premium that is not merely being priced in at the margin but is becoming increasingly embedded in base-case valuations.
Furthermore, the oil market disruption playing out across these corridors is compounding pre-existing supply pressures that traders were already navigating heading into the second half of 2026.
Technical Levels Analysts Are Watching
Market analysts at IG have identified a critical technical threshold for WTI crude. A sustained hold above the mid-$70s support zone is seen as a prerequisite for a potential advance toward the mid-$80s in the near term. A confirmed break above that level, particularly if geopolitical conditions deteriorate further, could accelerate momentum toward more extreme price scenarios.
The pattern playing out in crude markets reflects a well-documented dynamic in commodity trading: when geopolitical risk transitions from speculative to credible and structural, price discovery shifts from mean-reversion logic to scenario-weighting logic. Traders stop asking "will this resolve?" and start pricing the probability distribution of outcomes that range from bad to catastrophic.
The Escalation Timeline: How the MoU Collapsed and What Followed
A ceasefire-adjacent framework described as a memorandum of understanding had temporarily paused active hostilities between US and Iranian forces in the weeks preceding mid-July 2026. That arrangement has now broken down comprehensively, with both sides resuming and intensifying military operations at a pace that markets had not fully anticipated.
The key escalation sequence unfolded as follows:
- Wednesday, July 16, 2026: The United States conducted two large-scale waves of air strikes within a single day, the first time this operational tempo had been reached since the MoU pause. Strike targets were concentrated primarily near Iran's southern coastline, in geographic proximity to the Strait of Hormuz.
- Thursday, July 17, 2026: US strikes continued. US Central Command confirmed a sixth consecutive night of operations against Iranian military infrastructure, commencing at 2:00 p.m. EDT (18:00 GMT, or 9:30 p.m. in Tehran).
- Iranian counter-response: Tehran launched retaliatory missile and drone barrages against US military installations in neighbouring states, including a significant strike against a recently expanded air base in Jordan.
- The Houthi activation order: Iranian leadership instructed its Houthi allies in Yemen to place themselves on operational readiness to execute a closure of the Red Sea export route, contingent specifically on the United States striking Iranian civilian power infrastructure.
The Conditional Trigger: Why the Houthi Order Changes the Risk Calculus
The fourth development listed above deserves particular attention because it fundamentally alters how market participants must model escalation risk. Iran is not merely threatening retaliation in abstract terms. It has created a specific, publicly signalled conditional trigger: attack Iranian power infrastructure, and the Red Sea closes.
This represents what strategists describe as a deliberate escalation ladder — a structured set of linkages between US targeting decisions and Iranian proxy responses designed to raise the cost of specific military choices. For oil markets, the implication is that the risk of Red Sea closure is no longer a background probability. It is a conditional probability with a clearly articulated trigger condition.
The geopolitical trade tensions that have been building across the region for months have now crystallised into a specific, market-observable threat architecture. Three sources cited by Reuters confirmed the Houthi activation order, lending the reporting a credibility that markets have taken seriously, as reflected in the immediate price response.
The IEA's Assessment: Oil Security as a Critical Concern
International Energy Agency Executive Director Fatih Birol addressed the situation directly at a Council on Foreign Relations event in Washington on July 17, 2026. His assessment was notable for its directness: oil security remains a critical issue, the situation demands concern, and the trajectory must improve within weeks to avoid a more severe market dislocation.
The IEA's framing matters beyond the headline. The agency's mandate includes coordinating strategic petroleum reserve releases among member nations, and its public statements carry implicit signalling about the threshold at which those coordinated interventions might be deployed.
The March 2026 emergency reserve release, triggered by the initial Hormuz closure shock when Brent briefly reached $126 per barrel, established a precedent. What remains unclear is whether a repeat deployment would be sufficient to contain prices in a dual-chokepoint closure scenario, where the fundamental supply deficit would be structurally larger and potentially longer in duration.
Key implications of the IEA's current position include:
- Strategic reserve drawdown risk: A second coordinated reserve release may be activated if prices accelerate materially beyond current levels
- Demand destruction as a natural ceiling: Sustained prices above $100 per barrel have historically triggered measurable demand reduction in price-sensitive emerging economies, creating a painful but self-correcting dynamic
- Accelerated supply diversification pressure: Major oil-importing nations, particularly in Asia, face intensifying political pressure to develop non-Gulf supply sources and expand strategic reserve capacity
In addition, the OPEC market influence dimension cannot be overlooked, as cartel production decisions will interact with any supply shock to amplify or moderate the ultimate price outcome.
Scenario Analysis: What a Dual Chokepoint Closure Would Actually Mean
The distinction between the current single-disruption baseline and a full dual-chokepoint closure is not merely quantitative. It is qualitative, representing a shift from a market managing supply constraints to one confronting a supply vacuum.
| Scenario | Estimated Brent Price Range | Key Risk Factor |
|---|---|---|
| Hormuz disruption only (current baseline) | $80 to $100/bbl | Continued US-Iran strikes; tanker withdrawal |
| Red Sea closure added to Hormuz disruption | $100 to $150+/bbl | Houthi activation order executed |
| Full dual closure with sustained escalation | $150+/bbl | No rerouting alternative; demand destruction begins |
Scenario A represents where markets are currently operating. Saudi Arabia's Yanbu-to-Red Sea rerouting is absorbing a portion of the Hormuz supply shock, and prices, while sharply elevated, remain below the March 2026 peak.
Scenario B is what Iran's conditional Houthi activation order is threatening. Saudi Arabia's workaround collapses entirely if the Red Sea is rendered commercially unnavigable. With no viable large-volume alternative maritime route available at short notice, the global market would face a supply deficit without modern precedent.
Scenario C represents a sustained dual closure with continued military escalation — a situation in which demand destruction becomes the market's primary corrective mechanism rather than supply substitution.
Analyst projections cited in market commentary suggest that a confirmed Bab el-Mandeb closure, layered on top of existing Hormuz disruptions, could push Brent crude above $150 per barrel within months. At that level, the economic consequences extend well beyond energy costs.
The next major ASX story will hit our subscribers first
Macro-Economic Transmission: How Oil Prices at These Levels Ripple Through the Global Economy
Oil price escalation of the magnitude currently being contemplated does not remain contained within energy markets. The transmission channels are well-documented and operate across multiple dimensions simultaneously.
Inflation and Central Bank Complexity
Energy-driven inflation is particularly problematic for central banks because monetary policy instruments are poorly calibrated to address supply-side price shocks. Raising interest rates can suppress demand but cannot resolve a physical supply deficit. The result is that sustained high oil prices driven by geopolitical disruption force central banks into a difficult position: tolerating above-target inflation or risking demand-suppression through rate increases that compound the economic damage.
The inflationary transmission channels from crude prices include:
- Transportation and logistics: Fuel surcharges cascade through supply chains, elevating costs for virtually all traded goods
- Agricultural inputs: Fertiliser production is heavily reliant on natural gas, and mechanised farming faces direct fuel cost inflation, with food price consequences that fall disproportionately on lower-income populations
- Manufacturing margins: Energy-intensive industries face compression that is passed through to consumer prices over time
- Services sector: Heating, cooling, and business energy costs rise, compressing margins across the services economy
Consequently, the broader impact on natural gas price trends feeds directly into the fertiliser and manufacturing cost pressures described above, compounding inflationary pressures across multiple sectors simultaneously.
Vulnerability by Geography: Key Importing Economies
| Economy | Oil Import Dependency | Vulnerability Assessment |
|---|---|---|
| Japan | ~99% of crude oil imported | Very High; minimal domestic production and yen weakness compounds price impact |
| European Union | ~97% of crude oil imported | Very High; still managing post-2022 energy transition pressures |
| India | ~85% of crude oil imported | High; significant current account and inflation exposure |
| China | ~75% of crude oil imported | High; manufacturing cost inflation, though strategic reserve buffer provides partial cushion |
India's exposure deserves particular attention given its scale of import dependency and the current account sensitivity that elevated oil prices generate. India imports approximately 85% of its crude requirements, and a sustained move above $100 per barrel represents a material deterioration in its trade balance and domestic inflation trajectory. For a broader perspective on how these dynamics interact, the CFR's analysis of Red Sea threats to the global economy provides valuable institutional context.
The Social Media Dimension: How Real-Time Signals Are Reshaping Price Discovery
A structurally novel development in this crisis has been the formalisation of social media as a conduit for market-moving information. Trump Media and Technology Group has introduced a licensed data feed providing financial institutions and trading firms with prioritised access to posts from influential Truth Social accounts, including those of President Donald Trump, whose statements have historically generated immediate and measurable movements in commodity markets.
This development represents more than a curiosity. It reflects a genuine structural shift in how geopolitical risk is priced into energy markets. Market-moving information now flows through social media channels at speeds that precede traditional news wire distribution in many cases, creating new dynamics in price discovery, volatility clustering, and risk management for energy traders. Firms that lack access to these prioritised data streams face an informational disadvantage in fast-moving markets.
Frequently Asked Questions
Why do US-Iran hostilities affect global oil prices so dramatically?
Iran sits adjacent to the Strait of Hormuz, through which approximately 20% of the world's daily oil and LNG supply transits. Any disruption to this corridor, or even a credible threat of one, immediately introduces a supply risk premium into global crude pricing. US-Iran hostilities and Red Sea closure threat oil prices precisely because of this geographic leverage.
What is the Bab el-Mandeb strait, and why does it matter for oil markets?
The Bab el-Mandeb is the southern entrance to the Red Sea, connecting the Gulf of Aden to the Suez Canal route. It serves as a critical alternative export pathway for Gulf producers, particularly Saudi Arabia, which has rerouted approximately 70% of its crude exports through this corridor amid Hormuz disruptions.
How high could oil prices go if the Red Sea is closed?
Market analyst projections suggest Brent crude could exceed $150 per barrel if both the Strait of Hormuz and the Red Sea corridor face simultaneous closure — a scenario without close historical precedent in terms of dual chokepoint disruption.
What was the highest oil price recorded during the 2026 Hormuz crisis?
Brent crude briefly reached $126 per barrel at its March 2026 peak following the initial Hormuz closure shock, before retreating as emergency reserve releases and diplomatic engagement partially contained the price surge.
What technical price levels are analysts monitoring for WTI crude?
Analysts at IG are watching the mid-$70s support level for WTI. A sustained hold above this zone is considered a prerequisite for a potential advance toward the mid-$80s, with further upside dependent on geopolitical developments.
What is the IEA's current position on the oil security situation?
IEA Executive Director Fatih Birol publicly stated on July 17, 2026 that oil security remains a critical concern and expressed direct personal worry about the trajectory of the situation if conditions do not improve within weeks.
Key Takeaways
- Brent crude reached $85.28/bbl and WTI reached $79.98/bbl on July 17, 2026, with both benchmarks gaining approximately 12% for the week
- The Strait of Hormuz has been severely disrupted since late February 2026, with throughput volumes plummeting amid sustained US-Iran military exchanges
- Iran has instructed Houthi forces to prepare for Red Sea closure contingent on US strikes against Iranian power infrastructure, creating a conditional escalation trigger with directly observable trip conditions
- Saudi Arabia's rerouting of approximately 70% of its crude exports through the Red Sea represents a workaround that disappears entirely if the secondary corridor also closes
- Analyst projections place Brent above $150 per barrel in a confirmed dual-chokepoint closure scenario, underscoring how severely US-Iran hostilities and Red Sea closure threat oil prices at a systemic level
- IEA Executive Director Fatih Birol has issued a direct public warning about the deteriorating state of global oil security, with concern focused on the trajectory over the coming weeks
This article contains forward-looking analysis, price projections, and scenario modelling based on publicly available data as of July 17, 2026. Geopolitical situations evolve rapidly, and actual market outcomes may differ materially from any scenarios described. Nothing in this article constitutes investment advice. Readers should conduct independent research and consult qualified financial advisers before making investment decisions.
Want to Stay Ahead of the Next Major Commodity Discovery Driven by Shifting Energy Markets?
When geopolitical shocks send commodity markets into turbulence, identifying the right opportunities at the right moment becomes critical. Discovery Alert's proprietary Discovery IQ model delivers real-time notifications on significant ASX mineral discoveries — including energy commodities — directly to subscribers, turning complex market signals into actionable investment insights the moment they emerge. Explore historic examples of exceptional discovery returns or visit Discovery Alert to begin your 14-day free trial and position yourself ahead of the broader market.