July 17, 2026
The Concentration Risk That Energy Markets Ignored for Decades
For generations, energy security strategy revolved around a single question: who controls the oil? Policymakers obsessed over producer diversification, reserve adequacy, and the geopolitics of extraction. What received far less systematic attention was the physical infrastructure connecting those reserves to the economies that depend on them. Transit chokepoints, the narrow passages through which the arteries of global energy flow, were treated as a background assumption rather than a strategic vulnerability.
That assumption has now collapsed.
The Strait of Hormuz energy security crisis unfolding in 2026 represents a fundamental stress test of an energy architecture that was never designed to survive the scenario now playing out. Understanding why this particular waterway carries such outsized systemic importance requires examining not just the geography, but the decades of infrastructure decisions, geopolitical arrangements, and market dependencies that made it irreplaceable.
When big ASX news breaks, our subscribers know first
Why the Strait of Hormuz Is Unlike Any Other Energy Chokepoint
The Geography That Made It Indispensable
The Strait of Hormuz sits at the mouth of the Persian Gulf, bordered by Iran to the north and Oman to the south. At its narrowest navigable point, the passage measures approximately 33 kilometres wide, with usable shipping lanes occupying a fraction of that distance. The inbound and outbound lanes each span roughly 3 kilometres, separated by a buffer zone.
What makes this geography so consequential is not the strait's narrowness alone, but the concentration of productive capacity on the other side of it. Saudi Arabia, Iraq, the UAE, Kuwait, and Qatar collectively sit behind this single passage with no viable alternative export corridor capable of absorbing their full combined output.
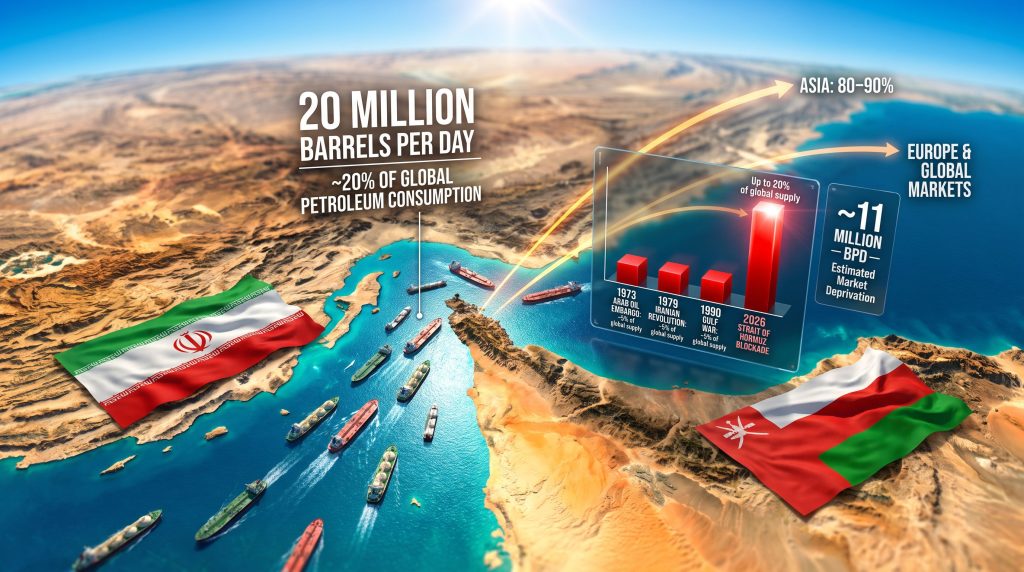
Under normal operating conditions, approximately 20 million barrels of oil per day transit the strait, representing roughly one-fifth of total global petroleum consumption. Beyond crude oil, nearly 20% of the world's liquefied natural gas shipments pass through the same corridor, with Qatar's export dependency on this route exceeding 90%. No other geographic feature on Earth concentrates equivalent energy trade exposure within a single navigable passage.
The Pipeline Bypass Problem
A question that resurfaces every time tension rises in the Persian Gulf is whether pipeline infrastructure can absorb a full disruption. The short answer, repeatedly validated by engineering and capacity analysis, is no.
Saudi Arabia operates the East-West Pipeline connecting its Eastern Province fields to the Red Sea terminal at Yanbu, with a capacity of approximately 5 million barrels per day. The UAE's Habshan-to-Fujairah pipeline offers an additional bypass route with capacity around 1.5 million barrels per day. Combined, these represent the most significant strait bypass infrastructure in existence.
The arithmetic remains stark. Against a pre-crisis strait transit volume of 17 to 20 million barrels per day, available bypass pipeline capacity falls short by a factor of three to four. Rapid scaling is not feasible within any realistic timeframe, requiring years of construction, investment, and commissioning rather than weeks or months. Furthermore, the geopolitical dimensions of this vulnerability have been extensively analysed by regional security researchers, underscoring how deeply structural the problem is.
How the 2026 Crisis Unfolded
From Military Conflict to Energy Blockade
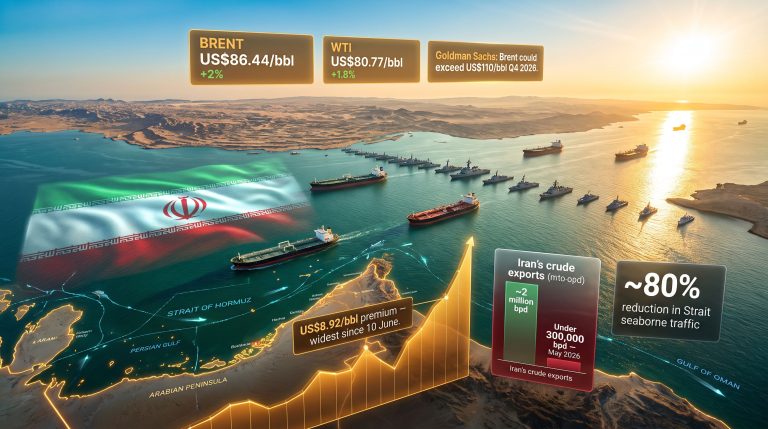
The sequence of events that triggered the current Strait of Hormuz energy security crisis began on February 28, 2026, when U.S. and Israeli military operations against Iran marked the opening of an active conflict phase. Iran's response extended beyond the conventional military domain into economic warfare, with the Islamic Revolutionary Guard Corps effectively suspending free vessel passage through the strait.
The blockade has not been absolute in the technical sense. Reports indicate that a limited number of vessels have been permitted transit through arrangements with IRGC-linked entities. However, the practical effect on commercial shipping has been near-total. Marine insurance for vessels not operating under such arrangements has become either unavailable or prohibitively expensive, creating a de facto closure even where a literal physical barrier does not exist.
The estimated market impact of this disruption stands at approximately 11 million barrels per day of crude and refined products removed from accessible supply chains, reflecting the combination of direct transit suspension and the knock-on effects on shipping economics. Consequently, oil price movements have become increasingly volatile as markets attempt to price in an extended disruption of this scale.
Current Flow Estimates vs. Pre-Crisis Volumes
| Flow Category | Pre-Crisis Volume | Estimated Current Volume |
|---|---|---|
| Crude oil transit | ~17-20 million bpd | Severely restricted |
| LNG shipments | ~20% of global supply | Near-total suspension |
| Qatar LNG exports | ~90% routed via strait | Largely halted |
| Net market deprivation | — | ~11 million bpd |
The Asymmetric Distribution of Economic Pain
Asia's Disproportionate Exposure
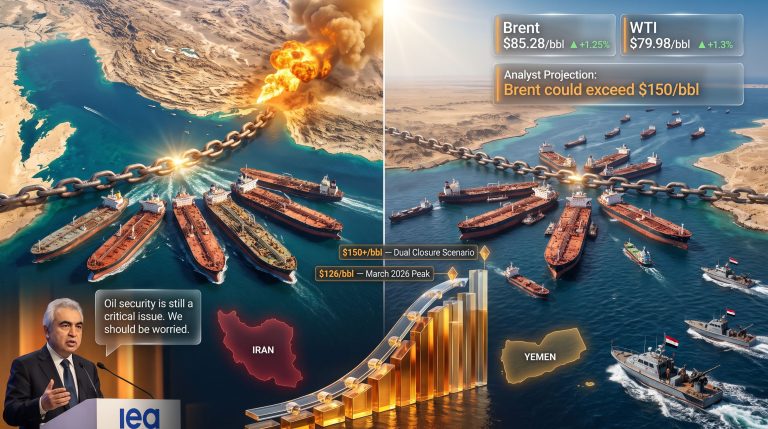
One of the most strategically significant dimensions of this crisis is how unevenly the economic consequences are distributed. The IEA's own assessment, communicated publicly by Executive Director Fatih Birol at a Council on Foreign Relations event in July 2026, confirmed that between 80% and 90% of the energy that previously transited the strait was destined for Asian markets.
Japan and South Korea face near-total import dependency on Middle Eastern crude with minimal domestic production alternatives. China, despite entering the crisis with a strategic petroleum reserve exceeding 1 billion barrels, remains structurally exposed as the world's largest crude importer, with close to half of its total oil imports historically sourced through this corridor. India faces acute affordability pressure as elevated prices strain its import budget and domestic subsidy architecture.
European exposure, while real at approximately 10% of supply, is comparatively manageable given greater access to Atlantic Basin, North Sea, and Norwegian production alternatives.
The Humanitarian Dimension That Energy Models Undercount
Beyond the macroeconomic disruption lies a humanitarian consequence that standard energy economics frameworks rarely capture with adequate weight. In multiple developing nations across South and Southeast Asia, petroleum products have become unaffordable at current price levels. Birol specifically highlighted Pakistan, Bangladesh, and India as among the hardest-hit economies, noting that households in these markets, particularly women responsible for cooking and domestic energy use, have been forced to substitute biomass fuels including wood and animal dung.
Public Health Warning: The World Health Organization has long documented that indoor air pollution from biomass combustion is among the leading environmental causes of premature death globally, responsible for an estimated 3.2 million deaths annually. An energy crisis that drives large-scale reversion to these fuel sources carries public health consequences that extend far beyond the immediate economic shock.
Food and Industrial Supply Chain Cascades
Energy price inflation does not remain contained within the fuel sector. It transmits across the entire economy through fertilizer production costs, food processing energy inputs, freight and logistics expenses, and chemical manufacturing inputs. The supply chain impacts of prolonged energy disruption have already demonstrated how quickly inflationary pressure cascades into unrelated sectors. The downstream sectors facing the most acute exposure to a prolonged strait closure include:
- Agricultural supply chains dependent on nitrogen fertilizers derived from natural gas
- Petrochemical manufacturing across East Asia
- Freight and shipping operations globally, through fuel surcharge escalation
- Power generation in oil-dependent electricity systems across South Asia and the Middle East
Emergency Response Mechanisms: What Has Worked and What Cannot
The IEA Reserve Release: Signal and Substance
In March 2026, the IEA coordinated a release of up to 400 million barrels from the strategic petroleum reserves of its 30-plus member nations. The immediate market response was a reduction of approximately $20 per barrel in oil prices, demonstrating both the scale of coordinated institutional capacity and the degree to which markets had priced in a supply shortfall.
Critically, Birol confirmed publicly that the 400 million barrel release represented only approximately 20% of total IEA member stockpiles, with the remaining 80% still available for future deployment. This communication served a dual purpose: demonstrating institutional resolve while signalling to markets that additional ammunition remained.
However, the fundamental limitation of strategic reserve releases as a policy instrument is their finite nature. Reserves are a bridge, not a solution. Their effectiveness depends on the crisis they are bridging being temporary.
U.S. Production Response: Significant but Mathematically Bounded
The United States, operating as the world's largest oil and gas producer, has increased output in response to the crisis by an estimated 1 to 2 million barrels per day. This contribution has provided meaningful relief at the margin but confronts a hard ceiling rooted in infrastructure and geological constraints.
Birol stated plainly that while the U.S. production increase has been beneficial, scaling American output by the 10 million barrels per day that would be required to meaningfully offset the Hormuz blockade is not physically achievable in the near term. U.S. shale production, while highly flexible by the standards of conventional oil, operates within pipeline takeaway capacity constraints, water disposal limitations, and well productivity curves that prevent the kind of step-change output expansion that the current supply gap would require. In addition, the oil price rally triggered by the initial conflict escalation has further complicated the calculus for producers weighing capital deployment decisions.
China's Strategic Buffer: Large but Finite
China's pre-crisis strategic petroleum reserve position exceeding 1 billion barrels represents the largest single national buffer in the world. Beijing has supplemented reserve drawdowns with accelerated domestic demand management measures including electric vehicle deployment incentives and expanded public transport usage.
The limitation, as acknowledged in the IEA's own analysis, is that no stockpile, however large, is sustainable indefinitely under sustained supply disruption. China's dual exposure, as both a major energy importer and a geopolitical actor with complex positioning in the U.S.-Iran conflict, adds further uncertainty to how long its buffer management strategy can remain viable.
How This Crisis Compares to Previous Energy Disruptions
A Historical Benchmark Analysis
| Disruption Event | Year | Estimated Supply Removed | Duration | Primary Impact |
|---|---|---|---|---|
| Arab Oil Embargo | 1973 | ~5% of global supply | ~6 months | Global recession |
| Iranian Revolution | 1979 | ~4% of global supply | ~2 years | Stagflation |
| Gulf War | 1990-91 | ~5% of global supply | ~6 months | Moderate recession |
| Strait of Hormuz Blockade | 2026 | Up to 20% of global supply | Ongoing | Historically unprecedented |
The 1973 Arab oil embargo, long treated as the defining benchmark for energy supply disruption, removed approximately 5% of global petroleum supply and triggered one of the most severe recessions of the twentieth century. The current strait blockade threatens four times that volume while simultaneously disrupting LNG markets and affecting a far broader range of import-dependent economies simultaneously.
What makes the 2026 crisis qualitatively distinct from all prior shocks is the concentration point of the disruption. Previous crises removed individual producer nations from supply. This crisis disrupts the single transit infrastructure node serving multiple major producers simultaneously, multiplying the exposure in ways that historical models were not built to assess.
The next major ASX story will hit our subscribers first
Scenario Pathways: Short, Medium, and Long-Term Outcomes
The trajectory of the crisis depends on the duration of the blockade, which remains fundamentally a function of diplomatic and military developments that cannot be modelled with precision. Scenario analysis across three timeframes provides a framework for understanding the decision space:
Short-term (weeks): Strategic reserves continue absorbing the supply shortfall. Energy prices remain elevated but markets retain functional stability. The IEA signals capacity for additional coordinated reserve releases. Developing nations begin experiencing acute product shortages.
Medium-term (months): Reserve depletion thresholds come into view, constraining the policy toolkit. Developing nation energy poverty accelerates with compounding health and food security consequences. Global inflation entrenches across supply chains. Shipping and insurance markets risk functional freeze for non-compliant vessels.
Long-term (6+ months): Structural reconfiguration of global energy trade becomes unavoidable. The LNG supply outlook increasingly favours U.S., Australian, and African producers as contract rerouting accelerates permanently. Geopolitical realignments emerge as energy-dependent nations reassess strategic partnerships. Infrastructure investment in bypass capacity, floating storage, and alternative corridors surges.
The Structural Lesson: Transit Redundancy as the New Energy Security Imperative
Reframing the Energy Security Paradigm
The policy frameworks that governed energy security strategy for the past five decades were built on a producer diversification logic. Reduce dependence on any single exporting nation. Maintain strategic reserves to buffer supply shocks. Develop domestic production capacity where economically viable.
The 2026 Strait of Hormuz energy security crisis has exposed the fundamental gap in that framework. Producer diversification provides no protection when multiple diversified producers share a single transit corridor. The risk was never only about who owned the oil. It was about whether the oil could physically reach the market. The lessons documented following the Hormuz crisis make clear that the entire global energy security architecture requires systematic rethinking.
Three Investment Pillars for Post-Crisis Resilience
For policymakers and investors seeking to identify the structural shifts the crisis will accelerate, three investment themes stand out:
-
Pipeline bypass infrastructure: Expansion of the Saudi East-West Pipeline, development of additional UAE Red Sea export capacity, and investigation of new overland transit corridors through Iraq, Turkey, and Jordan.
-
LNG terminal diversification: Nations with heavy Qatar LNG exposure are actively seeking to contract with U.S. Gulf Coast, Australian, and East African LNG suppliers to reduce strait dependency.
-
Renewable energy acceleration: Japan, South Korea, and India have the strongest strategic incentive of any nations on Earth to accelerate domestic renewable deployment. Indeed, renewable energy solutions are no longer framed purely as environmental choices but as direct instruments of national energy security.
Strategic Perspective: Nations that treat the 2026 energy crisis purely as a temporary disruption to be managed through reserve releases are misreading the structural signal. The crisis is revealing a fundamental design flaw in the architecture of global energy trade that will require decades of infrastructure investment to correct.
Frequently Asked Questions: Strait of Hormuz Energy Security
What percentage of global oil passes through the Strait of Hormuz?
Under pre-crisis conditions, approximately 20% of global petroleum consumption, representing roughly 20 million barrels per day, transited the strait. It remains the single most consequential energy chokepoint on Earth.
Why can't oil simply be rerouted around the Strait of Hormuz?
Existing bypass pipeline infrastructure lacks the combined capacity to absorb anywhere near the pre-crisis transit volume. Rapid infrastructure scaling is not feasible within a timeframe measured in weeks or months.
How long can IEA strategic reserves offset the blockade?
The March 2026 release of up to 400 million barrels represented approximately 20% of total IEA member stockpiles. While substantial remaining capacity exists, sustained deployment over many months would eventually exhaust the primary market stabilisation instrument available to the international community.
Which countries face the greatest vulnerability?
Asian economies hold the greatest structural exposure given that 80% to 90% of pre-crisis strait energy flows were directed toward the region. Pakistan, Bangladesh, and India face the most acute economic and humanitarian consequences given limited fiscal capacity to absorb sustained price elevation.
How does this compare to the 1973 oil embargo?
The 1973 embargo removed approximately 5% of global oil supply. The 2026 blockade threatens up to 20%, four times the scale, while simultaneously disrupting LNG markets and affecting a broader range of importing economies across multiple continents.
This article is intended for informational purposes only and does not constitute financial or investment advice. Scenario projections and forward-looking analysis involve inherent uncertainty. Readers should conduct independent research before making any investment or policy decisions. Readers seeking additional context on Middle Eastern energy geopolitics and GCC market developments can explore ongoing coverage through Zawya's Energy section at zawya.com.
Want to Track the Investment Opportunities Emerging From Global Energy Disruption?
As the Strait of Hormuz crisis reshapes long-term energy infrastructure priorities — accelerating demand for pipeline bypass capacity, LNG diversification, and renewable alternatives — Discovery Alert's proprietary Discovery IQ model delivers real-time alerts on significant ASX mineral discoveries directly relevant to these structural shifts, turning complex market data into actionable insights across more than 30 commodities. Explore how historic mineral discoveries have generated substantial returns and begin your 14-day free trial today to position yourself ahead of the market.