July 15, 2026
The Hidden Language of Warehouse Stocks: Decoding Aluminium's Mid-2026 Price Recovery
Commodity markets rarely move in straight lines, and aluminium in 2026 has proven that principle emphatically. The LME aluminium price recovers as stocks slip, and rather than focusing on a single session's price tick, the more instructive question is what the underlying inventory architecture is communicating about the structural balance between supply and physical consumption. When warehouse data and forward curve behaviour are read together, they form a picture far more nuanced than headline price moves alone can convey.
When big ASX news breaks, our subscribers know first
Why Inventory Mechanics Drive Aluminium Pricing More Than Most Traders Realise
At its core, the relationship between LME warehouse stocks and spot prices follows a consistent economic logic: as the visible buffer of metal shrinks, buyers competing for prompt delivery must pay a premium, and that premium radiates outward through the futures curve. However, the psychological dimension of this mechanic is equally important and frequently underestimated.
Traders do not wait for physical shortages to materialise before repricing risk. The mere directional trend of warehouse drawdowns, particularly when sustained across multiple consecutive sessions, shifts market sentiment decisively toward caution about future availability. This anticipatory repricing is what gives LME inventory data its outsized influence on daily price discovery. Furthermore, commodity price impacts across the broader metals complex tend to amplify these moves when sentiment shifts decisively.
Understanding Cancelled Warrants as a Forward Signal
Within the LME system, not all warehouse stock behaves the same way. Live warrants represent metal that is currently available for trading and delivery. Cancelled warrants, by contrast, represent tonnes that have already been earmarked for physical removal from LME-registered storage facilities. A rising cancelled warrant figure is therefore a leading indicator of imminent drawdowns, because that metal is already in the process of leaving the visible supply pool.
This distinction matters enormously for short-term price forecasting. A market with high cancelled warrants relative to total stocks is one where available supply is eroding faster than the headline tonnage figure suggests. Conversely, a sharp decline in cancelled warrants, as occurred in the July 14 session, can signal a temporary pause in withdrawal momentum, even if the broader structural drawdown trend remains firmly intact.
Contango, Backwardation, and What the Spread Reveals
The relationship between cash and three-month LME prices tells its own story about near-term supply expectations. In a contango structure, the forward price is higher than the spot price, reflecting normal carrying costs for storage and financing. When that gap narrows, or when the market moves toward backwardation (where spot prices exceed forward prices), it signals that immediate physical demand is outstripping prompt supply.
The compression between cash and three-month prices observed through mid-July 2026 reflects precisely this dynamic. According to LME Insight, buyers willing to pay relatively more for immediate metal than for deferred delivery are expressing a view that near-term availability is constrained.
A Detailed Look at the July 14, 2026 LME Aluminium Session
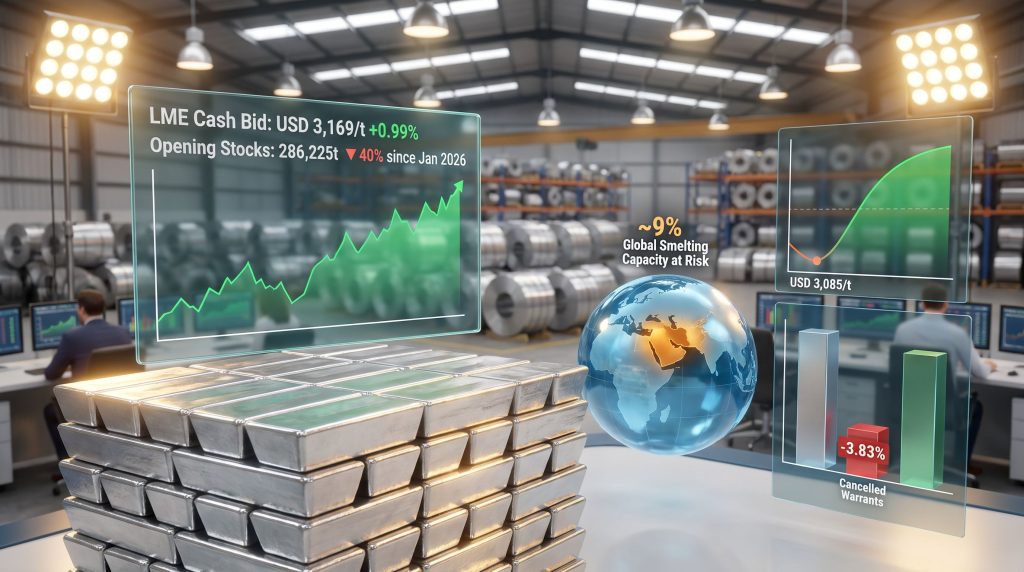
The July 14 session delivered a clear confirmation that the LME aluminium price recovers as stocks slip, with cash bid prices rising approximately 0.99% from USD 3,138/t to USD 3,169/t, while the cash offer climbed 1.04% to USD 3,171/t. These moves extended the rebound from the four-month low of USD 3,085/t recorded in earlier sessions and demonstrated renewed buying conviction across the curve.
Forward Curve Performance Across Contract Tenors
The three-month bid advanced 0.70% to USD 3,167/t, and the three-month offer gained 0.65% to USD 3,167.5/t. The three-month reference price, the standardised settlement benchmark used across physical contracts and long-term supply agreements throughout the global aluminium industry, closed at USD 3,177/t, up 0.24% from the prior session's USD 3,169.5/t.
Longer-dated December 2027 contracts posted more modest but still positive moves, with both the bid and offer rising 0.52% to USD 3,103/t and USD 3,108/t respectively. The more subdued gains at the far end of the curve are instructive: while prompt markets respond sharply to near-term physical tightness, longer-dated contracts reflect a more measured assessment of long-run supply-demand rebalancing.
| Contract Type | Previous Price (USD/t) | Current Price (USD/t) | % Change |
|---|---|---|---|
| Cash Bid | 3,138.00 | 3,169.00 | +0.99% |
| Cash Offer | 3,138.50 | 3,171.00 | +1.04% |
| 3-Month Bid | 3,145.00 | 3,167.00 | +0.70% |
| 3-Month Offer | 3,147.00 | 3,167.50 | +0.65% |
| 3-Month Reference | 3,169.50 | 3,177.00 | +0.24% |
| Dec-27 Bid | 3,087.00 | 3,103.00 | +0.52% |
| Dec-27 Offer | 3,092.00 | 3,108.00 | +0.52% |
The Inventory Picture: A Structural Drawdown of Historic Proportion
The stock data underpinning this price recovery is remarkable in its scale and duration. Opening LME aluminium stocks declined from 287,725 tonnes to 286,225 tonnes on July 14, a 0.52% single-session reduction. Live warrants edged lower from 246,400 tonnes to 246,300 tonnes, while cancelled warrants fell 3.83% from 39,825 tonnes to 38,300 tonnes.
| Inventory Metric | Previous Level | Current Level | % Change |
|---|---|---|---|
| Opening Stocks | 287,725 t | 286,225 t | -0.52% |
| Live Warrants | 246,400 t | 246,300 t | -0.04% |
| Cancelled Warrants | 39,825 t | 38,300 t | -3.83% |
Situating the Drawdown in Its Broader Historical Context
The significance of the July 14 figures becomes clear when viewed against the multi-month trajectory. LME aluminium stocks have fallen by more than 40% since late January 2026, a compression in visible inventory that has few historical precedents outside of periods marked by genuine supply disruptions or demand surges.
Earlier in the drawdown cycle, stocks touched approximately 316,525 tonnes, their lowest level since September 2022, before continuing lower toward the current sub-287,000 tonne range. For context, the June 22 session saw cash bid prices edge up to approximately USD 3,403/t as opening stocks dropped to 315,300 tonnes, illustrating how each incremental leg lower in inventory has corresponded with upward price pressure.
A sustained inventory decline exceeding 40% over a six-month period is a historically significant signal. Markets experiencing drawdowns of this magnitude have typically seen either a demand acceleration, a supply constraint, or both operating simultaneously. In 2026, the evidence points toward both forces being active at once.
What makes the current drawdown structurally distinct from short-term inventory fluctuations is its persistence. Single-session cancelled warrant figures can fluctuate, but the directional trend across dozens of consecutive sessions tells a more reliable story about the underlying balance between production and consumption.
Supply-Side Forces Amplifying the Price Recovery Narrative
Geopolitical Risk Premium From the Middle East
One of the less widely appreciated structural factors shaping aluminium pricing in 2026 is Iran's role in global smelting capacity. Iran accounts for approximately 9% of global aluminium smelting output, a concentration that makes any geopolitical disruption to its operations a meaningful market event. Ongoing tensions across the broader Middle East region have introduced a persistent risk premium into forward pricing, with traders assigning probability-weighted discounts to full Iranian supply availability.
This is a critical mechanism that separates aluminium from many other industrial metals: supply is not just about the top aluminium producers. A mid-tier producer representing nearly one-tenth of global output, operating in a region facing sustained geopolitical uncertainty, creates a supply fragility that markets must continuously price. That premium does not require an actual disruption to persist; the uncertainty itself is sufficient to sustain elevated spot prices.
The March 2026 Crash and the Scale of Recovery
The current recovery is best understood against the severity of the sell-off that preceded it. In March 2026, LME aluminium suffered its largest single-session price decline since 2018, falling approximately 8.4% to around USD 3,115/t amid a confluence of macroeconomic anxiety and demand uncertainty. The subsequent recovery to futures pricing near USD 3,200/t through mid-July represents a meaningful reversal, suggesting that the March dislocation overshot the fundamental value that physical market tightness now supports.
In addition, aluminium tariff impacts from shifting trade policy have continued to exert pressure on global supply chains, further complicating the pricing environment for producers and consumers alike.
Alumina as a Cost Floor Mechanism
The LME Platts alumina reference price stood at USD 330.2/t on July 14. This figure carries structural significance that extends well beyond the alumina market itself. Alumina is the primary feedstock for primary aluminium smelting, typically representing 30 to 40% of total production costs at a typical smelter operation.
When alumina prices remain elevated, they establish a floor beneath which aluminium prices cannot sustainably fall without making smelter operations uneconomical. Furthermore, alumina market pressures have been building across the supply chain, reinforcing this cost-floor dynamic. This mechanism is one of the most powerful yet underappreciated stabilisers in aluminium pricing.
The Step-By-Step Transmission Mechanism: From Stock Decline to Price Gain
Understanding exactly how warehouse drawdowns translate into spot price increases helps demystify what can appear to be an opaque market process. The transmission operates through five distinct stages:
-
Inventory Report Publication: The LME releases daily warehouse tonnage figures, revealing a decline in opening stocks that the market immediately processes.
-
Cancelled Warrant Signal: Elevated or persistent cancelled warrants confirm that additional metal is actively being removed from the LME system, tightening available prompt supply.
-
Cash Premium Expansion: Spot buyers competing for immediately deliverable metal push cash prices above three-month forward prices, narrowing the contango spread or initiating backwardation.
-
Three-Month Curve Repricing: Forward contracts adjust upward to reflect the expectation that reduced warehouse buffers will persist, increasing the implied cost of future metal sourcing.
-
Algorithmic and Discretionary Amplification: Systematic trading strategies responding to technical signals in inventory data and price momentum reinforce the directional move, accelerating the recovery dynamic.
This feedback loop explains why a seemingly modest 0.52% decline in opening stocks can generate a nearly 1% cash price rally within a single session. The physical signal is amplified at each transmission stage.
The next major ASX story will hit our subscribers first
Evaluating the Sustainability of the Current Recovery
Factors Supporting Continued Price Strength
- The 40%-plus inventory drawdown since January 2026 represents a structural rather than temporary tightening of the visible supply pool.
- Geopolitical risk exposure through Middle Eastern smelting capacity shows no imminent signs of resolution.
- The alumina cost floor at USD 330.2/t limits the downside for primary aluminium pricing by constraining how far margins can compress before output curtailments occur.
- Technical price action confirms that the four-month low of USD 3,085/t is functioning as meaningful support, with buyers consistently re-entering the market at lower price levels.
Risk Factors That Could Interrupt the Recovery
- Demand deterioration across key consuming sectors including automotive manufacturing, construction, and packaging could outpace the tightness signalled by warehouse data.
- A diplomatic resolution reducing Middle East supply risks would rapidly deflate the geopolitical risk premium embedded in current prices.
- China industrial demand remains one of the market's most persistent structural wildcards, as China's smelting industry has historically demonstrated the ability to bring new capacity online at speeds that overwhelm apparent global supply tightness.
- Broader macroeconomic pressures, including U.S. dollar strength and interest rate dynamics, can suppress commodity prices across the complex regardless of sector-specific fundamentals.
The aluminium market in mid-2026 presents a textbook tension between physical supply constraint and demand uncertainty. The trajectory of inventory levels over the next 30 to 60 days is likely to be the single most important determinant of whether the current recovery extends meaningfully above USD 3,200/t or retraces toward the technical support zone.
Frequently Asked Questions: LME Aluminium Prices and Inventory Dynamics
What does it mean when LME aluminium stocks decline?
Falling LME warehouse stocks indicate that physical demand for prompt metal is exceeding the rate at which new supply is being deposited into LME-registered facilities. This visible tightening of the supply buffer typically translates into upward pressure on spot prices, as buyers compete more aggressively for immediately available tonnes.
What are cancelled warrants and why do they matter?
Cancelled warrants represent specific parcels of aluminium that have been formally designated for physical removal from LME warehouses. Because the cancellation process precedes actual withdrawal, elevated or rising cancelled warrant figures serve as a forward indicator of further stock declines. Monitoring the ratio of cancelled warrants to total stocks provides a useful signal of near-term inventory trajectory.
Why did aluminium prices fall so sharply in March 2026?
The approximately 8.4% single-session decline in March 2026, which took prices to around USD 3,115/t, reflected a convergence of macroeconomic uncertainty, weaker near-term demand signals, and broader commodity market volatility. The move represented the largest single-session decline for the metal since 2018, and the subsequent recovery suggests the sell-off overshot levels justified by physical market fundamentals.
How does alumina pricing affect aluminium prices?
Because alumina is the primary raw material consumed during primary aluminium smelting and typically accounts for 30 to 40% of production costs, sustained elevated alumina prices establish a structural floor beneath aluminium prices. When aluminium prices approach levels where smelting margins turn negative, producers reduce output, constraining supply and providing natural price support.
What is the LME three-month reference price?
The three-month reference price is a standardised settlement benchmark published by the LME following each trading session. Unlike the live bid and offer spreads used during active trading, the reference price serves as the pricing basis for physical supply contracts, hedging instruments, and long-term agreements across the global aluminium supply chain.
Key Data Summary: July 14, 2026 LME Aluminium Session
- Cash bid price reached USD 3,169/t, a gain of 0.99% from the prior session.
- Cash offer advanced to USD 3,171/t, up 1.04% day-on-day.
- Three-month reference price closed at USD 3,177/t, extending the recovery from the four-month low of USD 3,085/t.
- Opening stocks declined to 286,225 tonnes, extending a drawdown that has now erased more than 40% of inventory levels seen in late January 2026.
- Cancelled warrants fell 3.83% to 38,300 tonnes, suggesting a short-term moderation in pending withdrawals within an otherwise persistent structural drawdown.
- LME Platts alumina reference price held at USD 330.2/t, maintaining a meaningful cost floor for primary aluminium production economics.
- Geopolitical supply exposure through Iran's approximately 9% share of global smelting capacity continues to sustain a structural risk premium in forward pricing, confirming that the LME aluminium price recovers as stocks slip across each successive session.
Disclaimer: This article contains forward-looking analysis, historical price data, and market commentary intended for informational purposes only. It does not constitute financial or investment advice. Commodity markets involve significant risk, and past price behaviour is not indicative of future results. Readers should conduct independent research and consult qualified financial professionals before making any investment decisions.
Want to Capitalise on Real-Time Commodity Discoveries Before the Broader Market?
Discovery Alert's proprietary Discovery IQ model scans ASX announcements daily, delivering instant alerts on significant mineral discoveries across aluminium and 30-plus other commodities — turning complex market data into clear, actionable investment insights for traders and long-term investors alike. Explore how historic mineral discoveries have generated substantial returns and begin your 14-day free trial today to secure a market-leading edge.