
June 10, 2026
Reading the Signal: What LME Aluminium's Price Structure Reveals Beyond the Headline Number
Commodity markets have a habit of generating noise that drowns out the signal. A single-session price decline rarely tells the complete story, yet it frequently triggers outsized reactions from market participants whose time horizons are measured in hours rather than quarters. Understanding why LME aluminium retreats to $3,608/t on any given day requires peeling back the headline number and examining the contract curve, the warehouse data, the upstream cost structure, and the macro forces pressing down on dollar-denominated metals simultaneously.
The session closing on 9 June 2026 offers a textbook case study in exactly this kind of multi-layered analysis.
When big ASX news breaks, our subscribers know first
Correction or Trend Reversal? Framing the $3,608/t Close
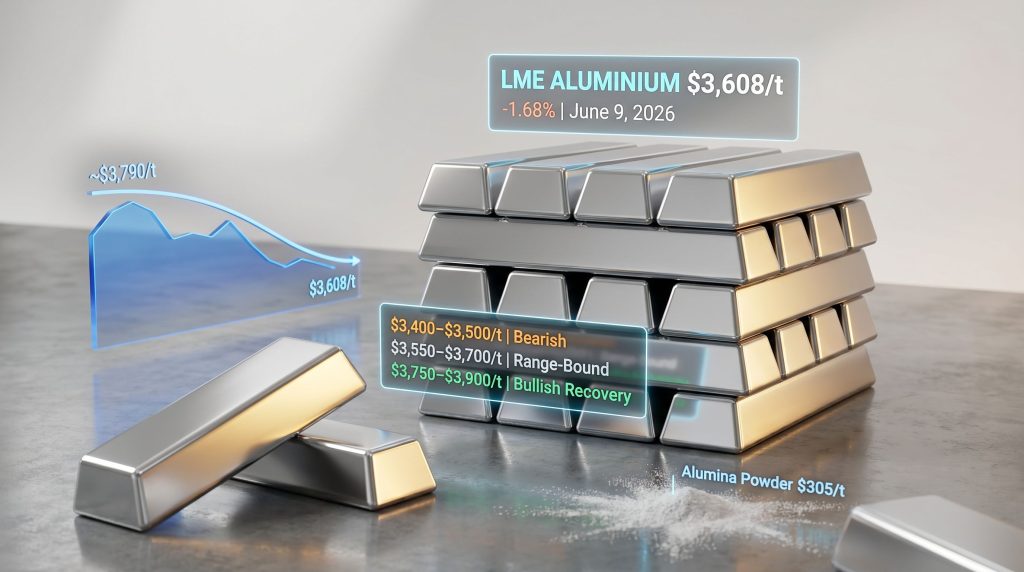
The cash offer price for LME aluminium settled at $3,608/t on 9 June, retreating from the recent high of approximately $3,790/t recorded on 2 June. That represents a pullback of roughly 4.8% over seven trading sessions, a move that looks dramatic in isolation but reads quite differently when placed against the broader 2025–2026 price range.
Aluminium has consistently held above $3,400/t throughout this period, a level that itself reflects a structurally elevated pricing environment supported by energy cost pressures on smelters, geopolitical supply risk, and persistently lean warehouse inventories relative to consumption. A sub-5% retracement from a recent peak, occurring within that broader elevated band, fits the technical definition of mean reversion rather than a structural breakdown.
"When a commodity retreats less than 5% from a multi-week high while the forward curve remains in backwardation and warehouse stocks stay historically lean, the move is typically classified as a technical correction driven by profit-taking, not a demand-destruction event."
The distinction matters enormously for downstream buyers deciding whether to accelerate procurement or wait for further softness, and for producers evaluating hedging positions against their forward sales books. Furthermore, top aluminium producers are watching these signals closely before committing to any capacity decisions.
The Full Contract Curve on 9 June 2026
One of the most analytically useful datasets from any single LME session is the shape of the forward curve across all contract tenors. The 9 June data reveals a pattern with important structural implications.
| Contract | 8 June (USD/t) | 9 June (USD/t) | Change |
|---|---|---|---|
| Cash Bid | $3,669 | $3,607 | -1.69% |
| Cash Offer | $3,669.50 | $3,608 | -1.68% |
| 3-Month Bid | $3,600 | $3,585 | -0.42% |
| 3-Month Offer | $3,600.50 | $3,586 | -0.40% |
| Dec-27 Bid | $3,228 | $3,245 | +0.53% |
| Dec-27 Offer | $3,233 | $3,250 | +0.53% |
| Asian Reference Price | $3,604 | $3,547.50 | -1.57% |
The pattern here is instructive. Near-term cash contracts fell nearly 1.7% in a single session, while the three-month contract declined by only 0.4%. More tellingly, the December 2027 contracts actually moved higher in absolute terms, suggesting that participants with a longer-dated view were not joining the near-term selling.
What Backwardation Tells Physical Holders
The shape of this curve, with spot prices sitting above forward prices, describes a market in backwardation. This structure carries specific implications for physical metal holders. When backwardation is present, holders of physical aluminium are rewarded for carrying the metal in the near term because spot prices command a premium over future delivery prices.
It also signals that the market perceives near-term supply as tighter than future supply, a fundamentally different message from what the surface-level price decline might suggest. The 1.57% decline in the Asian Reference Price to $3,547.50/t adds a regional dimension. This benchmark, which reflects trading during Asian market hours, fell more sharply than the three-month contract, pointing to either demand-side softness specific to Asia-Pacific markets or currency-related compression in regional purchasing power relative to the USD benchmark.
The Three Macro Forces Behind the Retreat
US Dollar Dynamics and Their Mechanical Effect on Metal Pricing
Because LME aluminium is priced in US dollars, any strengthening of the dollar index mechanically reduces the purchasing power of buyers operating in other currencies. This compression can suppress demand signals from large importing nations, creating selling pressure on spot contracts that is entirely independent of any change in physical supply or consumption fundamentals.
A scenario where the dollar index softens materially from current levels could, on its own, push aluminium back toward the $3,700 to $3,800/t range without any change in underlying supply-demand conditions. This is why dollar movements are tracked as closely as warehouse data by sophisticated aluminium traders. In addition, the effects of US aluminium tariffs continue to influence how participants position themselves across the curve.
Smelter Economics, Supply Narratives, and the Geopolitical Risk Premium
Aluminium prices in the 2025–2026 period have carried an embedded geopolitical risk premium reflecting uncertainty around trade flows, energy access for smelters, and raw material supply chains. When that risk premium compresses, even partially, prices can retreat toward fundamental value anchors.
Smelter restarts in regions where energy costs have declined, combined with adjustments to trade policy frameworks, alter the supply narrative that had been supporting elevated price levels. The current pullback may partly reflect a recalibration of that premium rather than any deterioration in end-demand. Shifts in aluminum and alumina markets have further complicated these dynamics for producers globally.
Profit-Taking After the June 2 High
From a purely mechanical market structure perspective, prices reaching multi-week highs attract speculative long positions. Those positions are eventually unwound, and the unwinding creates selling pressure irrespective of fundamental views. The approximate $182/t drop from the June 2 high of $3,790/t to the June 9 close is consistent with the scale of profit-taking events observed in previous aluminium bull phases.
What the Warehouse Data Is Actually Saying
June 9 LME Inventory Snapshot
| Inventory Category | 8 June (tonnes) | 9 June (tonnes) | Change |
|---|---|---|---|
| Opening Stocks | 333,200 | 330,950 | -0.68% |
| Live Warrants | 254,625 | 254,625 | 0.00% |
| Cancelled Warrants | 76,325 | 73,125 | -4.19% |
Total LME-registered aluminium stocks declined to 330,950 tonnes on 9 June, continuing a drawdown trend. The more nuanced signal, however, sits in the cancelled warrants figure. For a broader view of LME aluminium pricing data and methodology, the exchange's own resources remain the definitive reference point.
Why Cancelled Warrants Deserve Closer Attention
Cancelled warrants are a specific and technically important data point that many market observers overlook in favour of headline stock numbers. When a warrant is cancelled, it means the physical metal held in an LME-registered warehouse has been earmarked for removal from that warehouse into the physical market. It represents forward demand rather than current demand, making it a leading indicator for physical offtake.
A 4.19% single-session decline in cancelled warrants, from 76,325 to 73,125 tonnes, indicates that fewer parties are actively pulling metal from the system compared to the prior session. This can reflect:
- Position unwinding by financial participants rather than genuine physical demand withdrawal
- Seasonal repositioning by downstream buyers whose procurement cycles are temporarily satisfied
- Macro-driven hesitation among physical buyers awaiting price clarity before committing to removal
"When inventory drawdowns and price declines occur simultaneously, it frequently points to macro forces temporarily overriding physical supply-demand fundamentals. Currency movements and risk sentiment are dictating price discovery more than warehouse balances in this phase."
The stability of live warrants at 254,625 tonnes confirms there is no immediate supply squeeze on available metal. The floor under prices is being maintained by cost economics, not scarcity.
The Alumina Anchor: Why $305/t Matters
LME alumina (Platts) closed at $305/t on 9 June, holding steady while aluminium itself declined. This stability carries significant implications for understanding how far aluminium prices can realistically fall.
Alumina is the direct feedstock for primary aluminium smelting, and its cost sits within a layered production chain running from bauxite ore through refining to smelting. When alumina remains priced above $300/t, the all-in cost of primary aluminium production at most smelters globally remains elevated enough to establish a credible price floor for the finished metal.
The alumina-to-aluminium price ratio at current levels sits at approximately 8.5%, which is within the historical range that supports economically viable smelting margins. A sustained decline in aluminium prices without a corresponding fall in alumina pricing would compress those margins to the point where marginal smelters curtail production, thereby rebalancing supply and supporting prices from below.
This dynamic makes alumina pricing stability one of the most reliable structural anchors in the aluminium complex, and its steadiness on 9 June is a meaningful signal that the current retreat has a cost-based floor not far below current spot levels.
The next major ASX story will hit our subscribers first
Three Scenarios for the Next 90 Days
| Scenario | Price Range | Key Trigger | Probability |
|---|---|---|---|
| Bearish Continuation | $3,400 to $3,500/t | Sustained USD strength + Chinese demand softness | Low to Moderate |
| Range-Bound Consolidation | $3,550 to $3,700/t | Stable macro backdrop, steady output | Moderate to High |
| Bullish Recovery | $3,750 to $3,900/t | Supply disruption + USD retreat | Moderate |
Scenario 1: Bearish Continuation
For a bearish outcome to materialise, multiple headwinds would need to compound simultaneously. Sustained dollar strength, visible demand deterioration from China (which accounts for roughly 55–60% of global primary aluminium consumption), and a meaningful inventory build in LME warehouses would all need to converge. The Chinese demand outlook remains a pivotal variable in this scenario. Given that live warrants remain flat and alumina costs are providing a floor, this scenario requires a significant shift in at least two of those variables.
Scenario 2: Consolidation as the Base Case
The most probable near-term outcome is price consolidation within the $3,550 to $3,700/t range. This reflects a market digesting the profit-taking event from the June 2 high while fundamental support from cost economics and lean inventories prevents a deeper retreat. Range-bound trading is the typical post-peak behaviour in base metals absent a new macro catalyst.
Scenario 3: Recovery Toward Prior Highs
A return to or through the June 2 high of approximately $3,790/t would most likely require a combination of US dollar softening and a supply disruption event, such as smelter curtailments driven by energy cost spikes or trade flow disruptions affecting key producing regions. Falling inventory levels, if they accelerate beyond current trends, could also tighten the nearby supply picture sufficiently to reignite buying interest. Broader themes around green steel pricing are also influencing how the metals complex is being priced across the decarbonisation transition.
Practical Implications for Different Market Participants
Downstream Manufacturers and Physical Buyers
The current price level represents a modest discount to the June 2 peak without any fundamental deterioration in the supply picture. Buyers with transparent forward demand schedules may find value in locking in a portion of near-term requirements at current spot or short-dated forward prices, using the forward curve structure to manage cost risk.
The Asian Reference Price decline to $3,547.50/t is particularly relevant for Asia-Pacific sourcing decisions, where regional pricing benchmarks govern physical contract settlements. According to recent market analysis, this kind of retreat from peak levels has become a recurring feature of the current market cycle.
Primary Producers and Smelters
At $3,608/t cash offer, producers with alumina input costs near $305/t and competitive energy tariffs remain in positive margin territory. The question for smelter operators is less about whether the current price is profitable and more about whether the trajectory over the next two to three quarters justifies incremental capacity additions or restarts that were being evaluated at higher price levels.
Cross-Border Traders and Carbon Cost Exposure
The growing relevance of embedded carbon costs in international aluminium trade adds a layer of complexity to simple LME price comparisons. The Carbon Border Adjustment Mechanism (CBAM) framework creates a situation where the landed cost of aluminium in certain markets can diverge materially from the LME spot benchmark, depending on the carbon intensity of the production source.
This divergence means that a $62/t decline from $3,670/t to $3,608/t may not translate into equivalent cost relief for buyers sourcing from carbon-intensive origins.
Frequently Asked Questions
Why did cash prices fall harder than three-month prices on 9 June?
The cash contract declined approximately 1.69% while the three-month contract fell only 0.42%. This differential reflects near-term selling pressure, largely from profit-taking and position unwinding, rather than a reassessment of the fundamental long-term supply-demand balance. When the front of the curve sells off harder than the back, it is generally a technical signal rather than a structural one.
What is the significance of live warrants remaining unchanged?
Live warrants represent metal that is available for immediate delivery within the LME warehouse network. Their stability at 254,625 tonnes confirms that no unusual surge in physical demand or supply injection occurred on 9 June. The day's price movement was driven by financial market dynamics, not a sudden change in physical metal availability.
Is aluminium above $3,400/t historically elevated?
In the context of the 2020 to 2023 price range, where aluminium traded between roughly $1,500/t and $4,000/t depending on the phase of the commodity supercycle, prices above $3,400/t represent the upper portion of the historical distribution. The structural drivers sustaining this elevated range include higher energy costs for smelters, decarbonisation-related supply constraints, and increased demand from electrification and lightweighting applications in automotive and construction sectors.
How does alumina pricing create a floor for aluminium?
Approximately 4 to 4.5 tonnes of bauxite are required to produce one tonne of alumina, and approximately 2 tonnes of alumina are required to produce one tonne of primary aluminium. When alumina trades above $300/t, the raw material cost alone represents a meaningful portion of the total aluminium production cost, establishing a floor below which primary producers cannot sustainably operate without curtailing output. Consequently, LME aluminium retreats to $3,608/t remain bounded by these real cost dynamics, which prevents a freefall scenario from unfolding.
This article is intended for informational and analytical purposes only. It does not constitute financial advice or a recommendation to buy or sell any commodity or financial instrument. Commodity price forecasts and scenario analyses involve inherent uncertainty, and actual market outcomes may differ materially from those described. Readers should conduct independent research and consult qualified financial advisors before making investment or procurement decisions.
Want to Identify the Next Major ASX Mineral Discovery Before the Market Does?
Discovery Alert's proprietary Discovery IQ model delivers real-time alerts on significant ASX mineral discoveries, transforming complex commodity data across more than 30 sectors into clear, actionable insights for traders and investors at every experience level — start your 14-day free trial today or explore how historic discoveries have generated extraordinary returns to understand why timing your entry matters.