June 12, 2026
The Aluminium Market's Contradictory Signal: Falling Prices, Falling Stocks
Few market dynamics confuse investors more than when commodity prices and inventory levels move in the same direction simultaneously. Conventional commodity theory suggests that when physical stocks decline, prices should rise as scarcity becomes priced in. Yet the LME aluminium price and stocks decline heading into mid-June 2026 has delivered precisely the opposite: a sharp price correction unfolding alongside a persistent, multi-week erosion of LME warehouse inventories. Understanding why this is happening, and what it means for the months ahead, requires looking well beyond the daily price tape.
When big ASX news breaks, our subscribers know first
How Did LME Aluminium Prices Get Here?
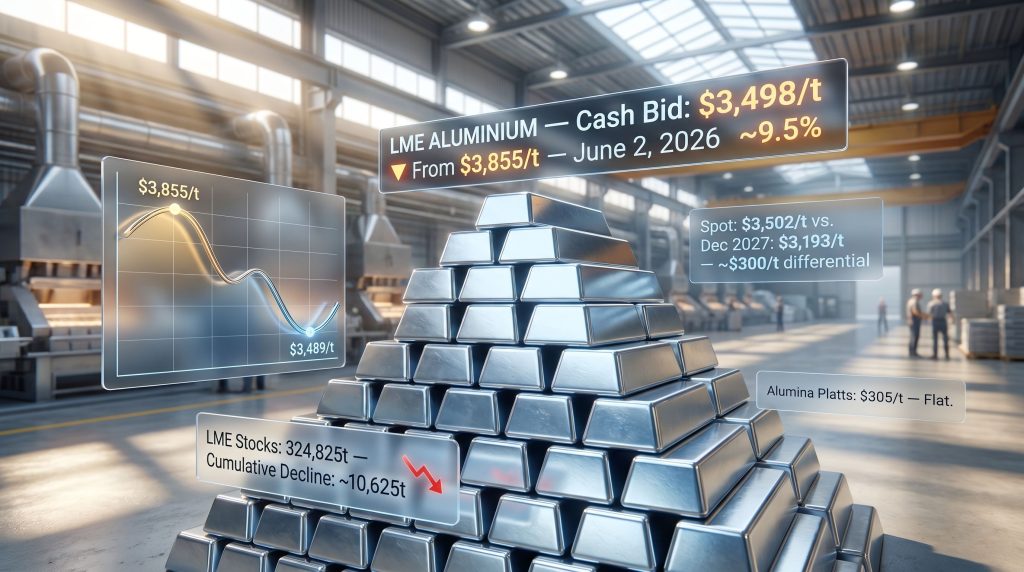
The aluminium market had entered June 2026 riding considerable momentum. Prices had climbed to approximately $3,855 per tonne on June 2, a level representative of multi-year highs driven by a combination of supply concern narratives, speculative positioning, and geopolitical risk premiums embedded during periods of Middle Eastern and Eastern European supply chain uncertainty.
What followed was a significant unwind. By June 10, the LME aluminium price had retreated to $3,489 per tonne, shedding roughly $366 per tonne, or approximately 9.5%, in just over one week. This was not a gradual softening; it was a rapid repricing event with identifiable structural causes.
Three converging forces drove the correction:
| Driver | Mechanism | Market Impact |
|---|---|---|
| Speculative Long Unwinding | Crowded long positions built on "general shortage" narratives were liquidated as that narrative was reassessed | Sharp downward price pressure |
| US Dollar Strengthening | Rising rate expectations in the US pushed dollar values higher, compressing dollar-denominated commodity prices globally | Broad metals sell-off across LME complex |
| Chinese Aluminium Export Surge | Higher volumes of Chinese-origin aluminium entering global markets reduced the perceived physical scarcity premium | Reduced geopolitical risk premium |
Each of these forces is worth understanding individually. When speculative traders build large long positions in a commodity futures market, they are essentially betting on further price increases. If the underlying thesis, in this case an acute global shortage, begins to look overstated, those positions become liabilities rather than assets. The resulting liquidation can cause price declines that appear disproportionate to any change in actual physical supply.
The role of the US dollar deserves particular emphasis. Because LME aluminium is priced in USD, any appreciation in the dollar effectively makes the metal more expensive in local currency terms for buyers outside the United States, suppressing demand signals and compressing the price level required to clear global markets.
Chinese export volumes add another layer of complexity. China is the world's dominant aluminium producer, accounting for more than 55% of global primary aluminium output. When Chinese producers redirect volumes into export markets, it can temporarily ease physical shortages in regions like Europe and North America, stripping out the scarcity premium even if underlying structural deficits remain intact further down the supply chain.
Where LME Aluminium Prices Stood on June 11, 2026
Following the steep correction, June 11 brought early signs of stabilisation. Near-term contracts recovered modestly across the board:
- Cash bid: $3,498/t, up 0.29% from $3,488/t on June 10
- Cash offer: $3,498.5/t, up 0.27%
- 3-month bid: $3,495/t, up 0.42% from $3,480.5/t
- 3-month offer: $3,495.5/t, up 0.42%
- 3-month reference price close: $3,502/t, up 1.04% from $3,466/t
The $3,500 per tonne level is significant beyond the numbers themselves. It functions as both a psychological threshold for market participants and a technical reference point that algorithmic and discretionary traders monitor closely. A price closing above this level signals trend recovery; repeated failures to hold it suggest ongoing supply-demand imbalance or macro headwinds remain dominant.
The modest bounce observed on June 11 bears scrutiny. Short-term price recoveries following sharp corrections can reflect two very different phenomena: genuine demand re-emergence from industrial buyers who view lower prices as purchase opportunities, or simple short-covering by traders closing bearish positions for profit. Distinguishing between the two matters enormously for assessing whether a sustained recovery is underway.
Why Longer-Dated Contracts Are Telling a Different Story
Perhaps the most analytically important feature of the June 11 data is that while near-term prices rose, longer-dated contracts continued declining. December 2027 contract data illustrates this divergence clearly:
- December 2027 bid: $3,193/t, down 0.44% from $3,207/t
- December 2027 offer: $3,198/t, down 0.44% from $3,212/t
This creates an unusual forward curve structure. The spread between spot prices near $3,500/t and December 2027 prices near $3,195/t represents a differential of approximately $305 per tonne. In commodity market terminology, this is a backwardated structure, where near-term prices exceed forward prices.
Backwardation typically signals that the market perceives current physical supply as tighter than future supply. However, the declining trajectory of longer-dated contracts adds a bearish dimension: it suggests that futures market participants do not expect the current tightness to persist or translate into structurally higher prices over a multi-year horizon.
For aluminium smelter operators and mining companies evaluating capital investment decisions, this forward curve compression creates a challenging planning environment. New smelter projects typically require sustained price expectations above $3,000 to $3,200 per tonne to justify the energy-intensive capital required, and a declining forward curve undermines the economic case for new capacity.
The Inventory Paradox: Stocks Keep Falling
While price dynamics attract headlines, the inventory data presents a more structurally significant picture. LME aluminium stocks have been declining steadily throughout the observation window:
| Date | LME Aluminium Stocks (Tonnes) | Day-on-Day Change |
|---|---|---|
| June 2, 2026 | 335,450 | – |
| June 5, 2026 | 333,200 | -2,250 |
| June 9, 2026 | 327,750 | -5,450 |
| June 10, 2026 | 324,825 | -2,925 |
Cumulative decline over approximately two weeks: roughly 10,625 tonnes, exceeding 3% of total stocks. This is not noise. This is a directional trend persisting through a period of significant price weakness, which is precisely what makes it unusual.
LME inventories are now approaching levels described as 20-year lows in the context of global supply. To appreciate what this means, consider that LME warehouse stocks serve as the physical buffer of last resort for the global traded aluminium market. When stocks are thin, any unexpected demand surge or supply disruption has fewer tonnes available to absorb the shock before physical premiums spike aggressively.
The cancelled warrants data adds another interpretive layer. As of June 11:
- Opening stocks: 324,825 tonnes, down 0.89% from 327,750 tonnes
- Live warrants: 250,525 tonnes, unchanged
- Cancelled warrants: 71,475 tonnes, down 3.8% from 74,300 tonnes
Cancelled warrants represent metal that has been earmarked for physical delivery and removal from LME-registered warehouses. A decline in cancelled warrants could suggest that some previously planned physical withdrawals have been deferred, which might hint at temporary demand softening at the margin. However, it does not reverse the broader trend of tightening stocks, and should not be interpreted as evidence of supply relief.
Inventory levels at or near multi-decade lows provide a structural price floor that limits the downside of any correction, unless a major demand destruction event disrupts the fundamental supply-demand balance.
Structural Deficit vs. Cyclical Correction: How to Frame the Current Market
Understanding the difference between these two categories of market disruption is essential for anyone assessing LME aluminium price and stocks decline trends.
A cyclical correction occurs when temporary factors, such as demand softness, currency shifts, or short-term oversupply, push prices below trend. These corrections are self-resolving over a period of months as demand normalises or excess supply is absorbed.
A structural deficit, by contrast, reflects chronic underinvestment in new smelting capacity, energy constraints that make new production economically unviable, or irreversible disruptions to global trade flows. Furthermore, these conditions cannot be resolved by short-term export surges or cyclical demand recovery alone.
Several features of the current aluminium market point toward structural rather than purely cyclical dynamics:
- Global aluminium smelting requires enormous quantities of electricity, with power typically representing 30 to 40% of total production costs. Rising energy prices across Europe and parts of Asia have made new smelter development increasingly difficult to justify at current price levels.
- The energy transition itself creates a demand paradox: aluminium is a critical material for electric vehicle battery casings, lightweight vehicle components, solar panel frames, and grid infrastructure. Consequently, all of these applications are expected to drive compound annual demand growth in the coming decades.
- Chinese export volumes, while temporarily easing spot shortages, reflect domestic overcapacity conditions that may not be sustained if Beijing adjusts export policy or if domestic demand accelerates. In addition, broader China steel and iron ore market trends suggest that regional industrial policy shifts could rapidly alter export dynamics.
The next major ASX story will hit our subscribers first
Alumina Prices: The Upstream Signal
Alumina, the intermediate product refined from bauxite before being smelted into primary aluminium, remained flat at $305 per tonne on June 11. This stability is worth noting, particularly in the context of recent Alcoa downgrade impacts that have drawn attention to upstream pricing pressures across the alumina supply chain.
Alumina prices generally lead primary aluminium prices with a lag, as smelter economics depend directly on the alumina-to-aluminium price ratio. When this ratio compresses, meaning alumina costs rise relative to aluminium revenues, smelter margins are squeezed and production cuts become more likely. The flat alumina price suggests upstream cost pressures are not currently intensifying, which limits one potential trigger for production curtailments.
What to Watch Next: Key Variables and Price Scenarios
Several macro and market-specific variables will determine whether aluminium prices stabilise, recover, or decline further:
- US Federal Reserve interest rate trajectory and its impact on USD strength
- Chinese export policy adjustments and the pace of domestic demand recovery
- Energy price volatility affecting European and Gulf Cooperation Council-based smelter output
- Rate of ongoing LME inventory drawdowns and whether the pace accelerates
- US aluminium tariff policy shifts, which have already demonstrated their capacity to reshape trade flows and price dynamics globally
The following scenario framework captures the likely range of outcomes:
| Scenario | Trigger Conditions | Likely Price Range |
|---|---|---|
| Bearish Continuation | USD strengthens further; Chinese exports remain elevated | $3,300 to $3,450/t |
| Sideways Consolidation | Mixed macro signals; inventories stabilise near current levels | $3,450 to $3,550/t |
| Bullish Reversal | Inventory drawdowns accelerate; USD weakens on rate cut signals | $3,600 to $3,750/t |
For those tracking aluminium commodity prices in real time, the interplay between these macro variables and physical inventory trends will be the decisive factor in determining which scenario materialises over the coming months.
Disclaimer: Price forecasts and scenario projections represent analytical frameworks based on current market data and are not guarantees of future performance. Commodity markets are subject to rapid and unpredictable changes. This article does not constitute financial or investment advice.
Frequently Asked Questions: LME Aluminium Price and Stocks Decline
Why are LME aluminium prices falling in June 2026?
The correction from the June 2 high of approximately $3,855/t reflects the unwinding of speculative long positions, US dollar appreciation, and increased Chinese aluminium export volumes reducing the perceived physical scarcity premium.
What does it mean when prices and inventories both decline together?
This unusual combination typically signals that the price decline is being driven by financial or macro forces rather than physical oversupply. The persistent inventory drawdown confirms ongoing physical demand for metal even as paper prices correct.
Why is the $3,500/t level significant?
It functions as a psychological and technical reference point for traders. Sustained trading above this level would signal trend recovery; failure to hold it suggests continued macro or speculative headwinds. Furthermore, many algorithmic trading systems use this threshold as a key trigger for automated position adjustments.
What are cancelled warrants and why do they matter?
Cancelled warrants represent LME-registered aluminium that has been designated for physical removal from warehouses. Changes in this figure provide early signals about physical demand intentions from industrial buyers.
Why are December 2027 contracts declining while spot prices recover?
Longer-dated contracts reflect longer-term market expectations. Their continued decline despite near-term stabilisation signals that futures traders do not expect current physical tightness to persist structurally over a multi-year horizon. However, this dynamic also connects to broader green iron and metals investment trends, where decarbonisation pressures are reshaping long-term demand projections.
How does a stronger US dollar affect aluminium prices?
Because aluminium is priced in USD on the LME, a stronger dollar makes the metal more expensive for non-US buyers, reducing demand and applying downward pressure to prices.
What inventory level would signal a genuine supply crisis?
With stocks already near 20-year lows and approaching 325,000 tonnes, any further significant drawdown, particularly if live warrants begin declining alongside cancelled warrants, would represent a meaningful escalation of physical tightness that could rapidly translate into spot premium surges.
Want to Know When the Next Major Mineral Discovery Hits the ASX?
Discovery Alert's proprietary Discovery IQ model scans ASX announcements in real time, instantly identifying high-potential opportunities across aluminium, bauxite, and more than 30 other commodities — turning complex market signals into clear, actionable insights. Explore how historic discoveries have generated substantial returns on Discovery Alert's dedicated discoveries page, and begin your 14-day free trial today to position yourself ahead of the market.