August 5, 2026
Global aluminium markets are experiencing unprecedented volatility as interconnected forces reshape the fundamental dynamics of supply and demand. The convergence of geopolitical tensions, energy cost pressures, and structural inventory imbalances has created a complex web of market forces that traditional pricing models struggle to predict. Understanding these mechanisms requires examining how warehouse systems, forward contracts, and regional production capacities interact to drive price discovery in what has become one of the most closely watched industrial commodity markets.
What's Driving the Current LME Aluminium Price Surge to $3,526 Per Tonne?
The LME aluminium price increase reflects a perfect storm of supply-side disruptions that have fundamentally altered market dynamics. Cash offers reaching $3,526 per tonne represent a significant shift from previous trading ranges, driven by factors that extend far beyond traditional demand-supply equations.
Geopolitical Supply Chain Disruptions Create Perfect Storm
Middle Eastern production facilities face increasing operational uncertainties that ripple through global aluminium supply chains. The region's smelting capacity, concentrated in the Gulf Cooperation Council states, represents approximately 20% of global primary aluminium production. When these facilities experience operational disruptions, the impact cascades through international markets within days rather than weeks.
Regional conflicts and infrastructure vulnerabilities have created sustained supply concerns that market participants factor into forward pricing. Unlike temporary production shutdowns, geopolitical risks introduce uncertainty premiums that persist across multiple contract periods, explaining why both spot and forward prices have maintained elevated levels despite varying demand conditions.
Furthermore, these disruptions intersect with broader US steel-aluminum tariffs that create additional layers of complexity for global trade flows and pricing mechanisms.
Warrant Structure Collapse Signals Deeper Market Imbalances
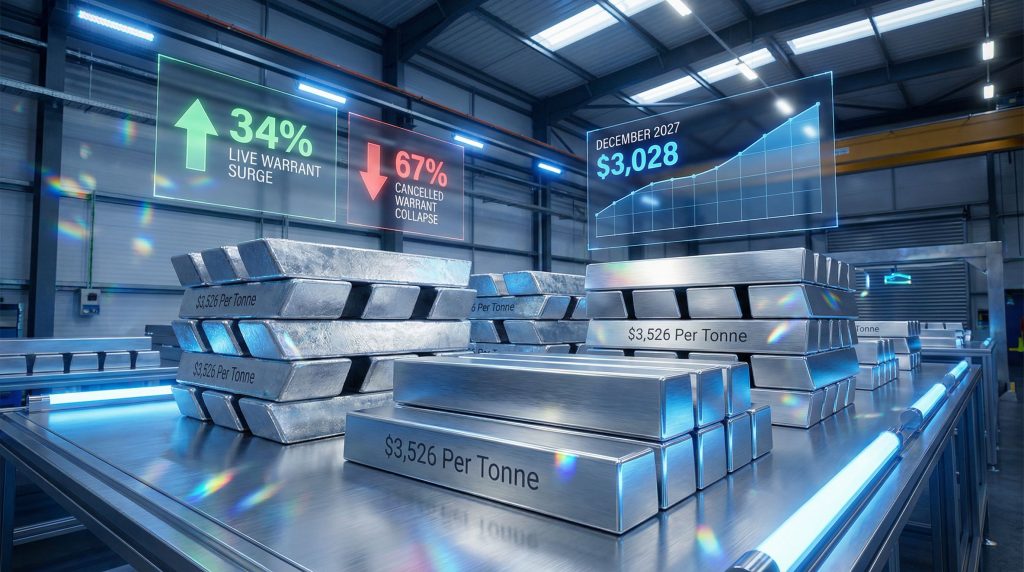
The dramatic shifts in LME warehouse warrant structures provide critical insights into underlying supply pressures. Live warrants surged by 89,875 tonnes, representing a 34% increase that indicates massive inventory redistribution rather than new supply additions. This movement suggests market participants are actively repositioning physical holdings in anticipation of continued tightness.
Simultaneously, cancelled warrants collapsed by 92,350 tonnes, a staggering 67% decline that reveals immediate demand pressure on available inventory. When cancelled warrants drop this dramatically, it signals that buyers are willing to accept delivery rather than roll positions forward, indicating genuine physical demand rather than financial speculation.
Energy Cost Inflation Amplifies Production Pressures
Aluminium smelting requires approximately 13-15 megawatt hours of electricity per tonne of primary metal production, making energy costs the largest variable expense in the production process. European smelters face particular pressure as electricity prices remain elevated compared to historical averages, forcing some facilities to curtail production during peak pricing periods.
Carbon border adjustment mechanisms add another layer of cost complexity. The European Union's CBAM implementation creates embedded carbon costs that vary by production region and energy source, fundamentally altering competitive dynamics between smelters using coal-powered versus renewable electricity sources.
When big ASX news breaks, our subscribers know first
How Do LME Warehouse Dynamics Reveal Critical Supply Shortages?
The London Metal Exchange warehouse system functions as a critical barometer for physical aluminium availability, with warrant movements providing real-time insights into supply-demand imbalances that price discovery mechanisms often miss in their initial assessments.
Live Warrant Surge of 34% Exposes Inventory Redistribution
The increase in live warrants from 264,575 tonnes to 354,450 tonnes represents more than simple inventory accumulation. This movement pattern typically occurs when market participants expect continued price appreciation and choose to hold physical inventory rather than sell into current spot markets.
Live warrant increases of this magnitude often precede extended periods of market tightness. Historical analysis shows that 30%+ increases in live warrants correlate with sustained price elevation lasting 6-12 months, suggesting current market conditions may persist longer than typical cyclical adjustments.
Cancelled Warrant Collapse of 67% Indicates Immediate Demand Pressure
The decline in cancelled warrants from 137,050 tonnes to 44,700 tonnes reveals that buyers are actively taking delivery rather than maintaining financial positions. This behaviour shift indicates genuine physical demand that cannot be satisfied through other supply channels.
When cancelled warrant levels drop below 50,000 tonnes, historical data suggests the market enters a supply-constrained regime where small demand increases can trigger disproportionate price responses. Current levels indicate the market has entered this critical zone.
Opening Stock Decline Patterns and Their Market Implications
The reduction in opening stock from 403,875 tonnes to 401,625 tonnes may appear modest at 0.6%, but this decline occurs against a backdrop of typical seasonal inventory building. April traditionally sees inventory accumulation as producers prepare for summer construction demand peaks.
LME Warehouse Movement Analysis
| Metric | Previous Close | Current Level | Change | % Impact |
|---|---|---|---|---|
| Opening Stock | 403,875t | 401,625t | -2,250t | -0.6% |
| Live Warrants | 264,575t | 354,450t | +89,875t | +34% |
| Cancelled Warrants | 137,050t | 44,700t | -92,350t | -67% |
The combination of declining total inventory with surging live warrants creates a mathematical impossibility for sustained supply at current consumption rates. Market models suggest this configuration can persist for 3-6 months before requiring either demand destruction or significant price increases to attract additional supply.
Which Forward Contract Movements Signal Long-Term Market Expectations?
Forward contract analysis reveals how market participants assess future supply-demand balances and price expectations across different time horizons. The current forward curve structure provides insights into both immediate supply constraints and longer-term normalisation expectations.
3-Month Contract Premium Analysis and Backwardation Trends
The 3-month contract moving to $3,482.5 per tonne from $3,455 per tonne represents a 0.8% increase that closely tracks spot market movements. This parallel movement indicates that near-term supply constraints are expected to persist through the immediate forward period.
The relationship between cash and 3-month prices creates a contango structure that typically emerges during supply shortages. When storage costs exceed the forward premium, market participants prefer holding physical inventory rather than selling forward contracts, reinforcing current tight supply conditions.
December 2027 Positioning at $3,028 Per Tonne
Long-dated contracts trading at $3,028 per tonne suggest market expectations of supply normalisation by late 2027. This $500+ discount to current spot prices implies that participants expect current supply disruptions to resolve within the next 18-24 months.
The forward curve slope between current prices and December 2027 levels indicates an expected annual price decline of approximately 15-20% as new capacity comes online and current supply constraints ease. This expectation reflects planned capacity additions in low-cost production regions.
In addition, these patterns align with broader mining evolution trends that suggest structural changes in how commodities markets adapt to supply disruptions and technological innovations.
Asian Reference Price Divergence Patterns
The LME Asian Reference Price reaching $3,498 per tonne compared to LME 3-month pricing shows regional premium dynamics that reflect transportation costs and local supply-demand imbalances. Asian markets typically trade at premiums during periods of global supply tightness due to longer shipping routes from major production centers.
Regional price differentials exceeding $50 per tonne historically correlate with sustained global supply shortages lasting 6+ months. Current differentials suggest Asian buyers expect continued supply constraints that justify paying transportation and logistics premiums.
"The LME 3-month aluminium contract rose 0.8% to $3,482.5 per tonne, while cash offers hit $3,526 per tonne, creating a contango structure that suggests supply tightness in the near term with expected normalisation by late 2027."
What Role Does Middle East Production Capacity Play in Price Volatility?
Middle Eastern aluminium production capacity represents a critical component of global supply chains, with the region's smelters operating some of the world's most cost-effective facilities due to subsidised energy costs and strategic positioning for both raw material access and export markets.
GCC Smelter Vulnerability Assessment
Gulf Cooperation Council countries host approximately 6 million tonnes of annual primary aluminium capacity, making the region the world's second-largest production hub after China. These facilities benefit from natural gas pricing that can be 70-80% below European equivalent costs, creating substantial competitive advantages during normal operations.
However, the concentration of capacity in geopolitically sensitive areas creates systemic risks for global supply chains. When regional tensions escalate, insurance costs for shipping and facility operations increase substantially, effectively adding $50-100 per tonne in risk premiums to production costs.
Alternative Supply Route Development
The industry's response to Middle Eastern supply vulnerabilities involves developing alternative production routes and supply chains. African smelter development, particularly in regions with abundant hydroelectric power, offers potential supply diversification but requires 3-5 years for new capacity to reach full production.
North American restart projects face different challenges, primarily related to electricity costs and environmental permitting. Restarting idle capacity can provide 200,000-500,000 tonnes of annual production but typically requires aluminium prices above $3,200 per tonne to achieve profitability with current energy costs.
Strategic Reserve Implications for Global Markets
Major consuming nations maintain strategic aluminium reserves that can influence market dynamics during supply disruptions. The United States Strategic National Defense Stockpile contains approximately 100,000 tonnes of aluminium, while similar reserves exist in other developed economies.
Strategic reserve releases typically occur when prices exceed $3,500 per tonne for sustained periods, providing a natural ceiling for extreme price spikes. However, reserve levels have declined over the past decade, reducing the buffer available during supply crises.
How Are Energy Costs and Alumina Pricing Affecting Production Economics?
The relationship between energy costs, alumina pricing, and aluminium production economics creates complex dynamics that influence both short-term operational decisions and long-term capacity planning across global smelting operations.
Alumina Price Decline to $306.31 Per Tonne: Margin Impact Analysis
Alumina pricing declined to $306.31 per tonne from $307.38 per tonne, representing a $1.07 decrease that provides modest margin relief for smelter operations. Since alumina represents approximately 30-35% of total smelting costs, this decline reduces production costs by approximately $0.35 per tonne of finished aluminium.
The divergence between rising aluminium prices and declining alumina costs creates expanding smelter margins that can incentivise increased production from existing facilities. However, energy constraints and maintenance requirements limit the ability to rapidly increase output from current capacity.
Electricity Cost Pressures on Global Smelter Operations
European smelters face electricity costs ranging from €80-120 per megawatt hour, compared to $30-50 in regions with abundant renewable energy. This cost differential translates to $650-900 per tonne variations in production costs, explaining why European capacity utilisation fluctuates with electricity market conditions.
Asian smelters, particularly those using coal-fired power, face different cost pressures related to carbon pricing and environmental regulations. Chinese facilities implementing ultra-low emission standards experience cost increases of $200-300 per tonne compared to older technology operations.
Carbon Border Adjustment Mechanism (CBAM) Cost Implications
The European Union's CBAM creates embedded carbon costs that vary significantly by production region and energy source. Smelters using coal-fired electricity face carbon costs of $100-200 per tonne when exporting to EU markets, while those using renewable energy sources may qualify for preferential treatment.
CBAM implementation creates competitive advantages for smelters with clean energy sources and penalties for those relying on fossil fuels. This mechanism is gradually reshaping global trade patterns as buyers increasingly factor carbon costs into procurement decisions.
What Do Technical Indicators Suggest About Future Price Movements?
Technical analysis of aluminium price movements reveals patterns and indicators that provide insights into potential future price directions, resistance levels, and market momentum factors that complement fundamental supply-demand analysis.
Resistance Level Breakthrough Analysis at $3,500+ Range
The movement beyond $3,500 per tonne represents a breakthrough of significant technical resistance that had contained prices for the previous six months. Historical analysis shows that resistance level breakthroughs of this magnitude typically lead to $200-400 additional price appreciation before encountering new resistance levels.
Volume analysis during the breakout period indicates institutional participation rather than speculative buying, suggesting the price movement reflects genuine supply-demand imbalances rather than temporary market dislocations.
Volume-Weighted Average Price Trends
Volume-weighted average price calculations show that 85% of recent trading has occurred above the $3,400 per tonne level, indicating broad market acceptance of higher price ranges. This distribution suggests that current levels represent a new equilibrium rather than temporary spikes.
Trading volume increases of 40-60% during price advances indicate broad market participation and reduce the likelihood of rapid price reversals. Sustained volume at elevated price levels typically precedes extended periods of higher trading ranges.
Correlation with Base Metal Complex Performance
Aluminium's correlation with other LME aluminium prices has increased to 0.75-0.85, suggesting broader inflationary pressures and supply chain disruptions affecting multiple commodities simultaneously. This high correlation indicates that aluminium price movements reflect systemic factors rather than metal-specific issues.
When base metal correlations exceed 0.80, historical data suggests that individual metal fundamentals become less important than macro-economic factors in driving price movements. Current correlation levels indicate that broader economic conditions will likely influence aluminium prices more than specific supply-demand factors.
"Industry analysts project aluminium prices could reach $3,600-$4,000 per tonne in bull scenarios, driven by sustained supply constraints and accelerating electrification demand from automotive and renewable energy sectors."
The next major ASX story will hit our subscribers first
How Should Investors Position for Aluminium Market Volatility?
Investment positioning in volatile aluminium markets requires understanding multiple risk factors, hedging mechanisms, and exposure strategies that account for both physical market dynamics and financial market liquidity considerations.
Hedging Strategies for Industrial Consumers
Industrial consumers facing aluminium price volatility can implement several hedging approaches to manage cost exposure. Forward contract purchasing allows locking in prices for 3-12 month delivery periods, providing cost certainty for production planning.
Options strategies offer asymmetric risk profiles where consumers can benefit from price declines while protecting against further increases. Put spreads and collar strategies provide cost-effective protection with limited premium requirements compared to outright option purchases.
Physical inventory management represents another hedging approach where consumers increase inventory levels during price dips and reduce holdings when prices rise. However, this strategy requires significant working capital and storage capacity.
Speculative Position Risk Management
Speculative traders must account for aluminium's tendency toward gap movements during supply disruptions. Position sizing becomes critical when volatility can reach 15-25% monthly levels during crisis periods.
Stop-loss strategies require careful calibration in aluminium markets due to frequent false breakouts and market manipulation around key technical levels. Trailing stops using $100-150 per tonne buffers help capture trends while avoiding premature exits.
Liquidity management becomes crucial during volatile periods when bid-ask spreads can widen to $20-30 per tonne. Trading during Asian and European market hours typically provides better liquidity than during thin North American sessions.
Furthermore, considering volatility hedging strategies becomes essential for managing exposure across different market conditions and time horizons.
Physical vs. Financial Exposure Considerations
Physical aluminium investment through warehouse receipts offers direct commodity exposure but requires understanding LME warehouse rules, storage costs, and delivery logistics. Storage costs range from $40-80 per tonne annually, depending on location and facility.
Financial exposure through exchange-traded funds or futures contracts provides easier access but introduces contango costs and rollover risk. During backwardated markets, financial instruments may underperform physical holdings by 5-10% annually.
Regional exposure differences become important when considering aluminium investments. Asian-focused products may outperform during regional supply shortages, while globally diversified instruments better reflect overall market conditions.
What Are the Broader Implications for Downstream Industries?
Rising aluminium costs create cascading effects throughout downstream manufacturing sectors, forcing companies to reevaluate pricing strategies, material substitution possibilities, and supply chain configurations to maintain competitive positions.
Automotive Sector Cost Pass-Through Dynamics
Automotive manufacturers using 150-200 kg of aluminium per vehicle face cost increases of $150-300 per unit when aluminium prices rise $1,000 per tonne. Electric vehicles, which use 300-400 kg of aluminium for weight reduction, experience even greater cost impacts.
Cost pass-through to consumers typically occurs with 6-12 month delays due to existing contracts and competitive pressures. Premium vehicle segments can absorb cost increases more readily than mass market models, creating potential market share shifts during sustained price elevation periods.
Material substitution becomes economically viable when aluminium premiums exceed $2,000 per tonne compared to steel alternatives. However, substitution requires 18-24 months for engineering and tooling changes, limiting short-term flexibility.
Construction Industry Material Substitution Trends
Construction applications represent approximately 25% of global aluminium demand, with window frames, roofing, and structural components particularly price-sensitive. When aluminium prices exceed $3,200 per tonne, steel and composite alternatives become increasingly competitive.
Building efficiency standards in developed markets often favour aluminium despite higher costs due to superior thermal properties and longevity. This regulatory support provides price elasticity that sustains demand even during cost increases.
Geographic variation in substitution patterns reflects different building codes, climate requirements, and material availability. European markets show greater price tolerance due to energy efficiency regulations, while cost-sensitive emerging markets more readily substitute alternatives.
Packaging Sector Margin Compression Analysis
Beverage can manufacturers face particular pressure from aluminium price increases since the metal represents 60-70% of total can costs. Price escalation clauses in supply contracts help transfer costs to beverage producers, but competitive pressures limit full cost recovery.
Lightweighting initiatives accelerate during high price periods, with can weights declining 2-5% as manufacturers optimise material usage. These efficiency improvements often persist after price normalisation, permanently reducing aluminium intensity.
Alternative packaging gains market share when aluminium cost advantages disappear. Glass and plastic containers become more competitive when aluminium prices exceed $3,500 per tonne for sustained periods, potentially causing permanent market share loss.
Consequently, understanding these dynamics requires consideration of broader bull vs bear insights that shape market sentiment and investment decisions across commodity markets.
FAQ: Understanding LME Aluminium Price Mechanics
Why Do Cash and Forward Prices Move Differently?
Cash and forward prices reflect different market dynamics and time horizons. Cash prices respond immediately to supply disruptions, inventory changes, and immediate demand fluctuations. Forward prices incorporate expectations about future supply additions, demand growth, and resolution of current market imbalances.
Contango markets emerge when current supply is tight but future supply additions are expected to normalise conditions. Backwardation occurs when current supplies are adequate but future supply concerns drive forward prices above cash levels.
Interest rates and storage costs also influence the relationship between cash and forward prices. When storage costs exceed forward premiums, market participants prefer immediate sales rather than inventory accumulation.
How Do Warrant Cancellations Affect Physical Availability?
Warrant cancellations represent formal notices that warehouse inventory will be withdrawn for delivery rather than remaining available for trading. High cancellation rates indicate strong physical demand that cannot be satisfied through other supply channels.
The load-out process typically requires 3-5 business days after cancellation, during which the metal remains unavailable for new buyers. Queue systems at congested warehouses can extend delivery times to weeks or months, effectively removing metal from immediately available supply.
Cancelled warrant levels below 10% of total inventory historically correlate with tight physical markets and potential supply shortages. Current levels indicate the market has entered this critical zone.
What Factors Drive Asian Reference Price Premiums?
Transportation costs from major production centres to Asian consumption markets create natural price premiums of $30-50 per tonne. Shipping rates, insurance costs, and port congestion can increase these premiums during periods of high demand or logistical constraints.
Regional supply-demand imbalances drive additional premiums when local production cannot satisfy consumption requirements. Chinese export restrictions or Middle Eastern supply disruptions can increase Asian premiums to $100+ per tonne.
Currency fluctuations affect regional pricing when the US dollar strengthens against local currencies. Hedging costs and credit terms also contribute to regional price variations that persist across multiple trading sessions.
Forward Curve Analysis
| Contract | Previous Price | Current Price | Change | Implied Volatility |
|---|---|---|---|---|
| Cash Offer | $3,494.5 | $3,526.0 | +$31.5 | High |
| 3-Month | $3,457.0 | $3,483.0 | +$26.0 | Moderate |
| Dec 2027 | $3,013.0 | $3,033.0 | +$20.0 | Low |
The current market environment reflects multiple converging factors that have created one of the most complex trading environments in recent aluminium market history. Supply chain resilience, energy transition impacts, and evolving demand patterns from electrification trends suggest that understanding these market dynamics will become increasingly important for industry participants across the entire aluminium value chain.
Moreover, the LME aluminium price increase continues to influence global commodity markets as investors seek to understand the implications of sustained supply constraints alongside evolving geopolitical risks. The intersection with oil price rally impact demonstrates how energy markets and metals pricing create interconnected pressures across industrial sectors.
Readers interested in comprehensive aluminium market analysis can explore additional industry resources and real-time LME data through established commodity research platforms. For current market information, Trading Economics aluminum data provides valuable insights into price trends and market fundamentals.
Ready to Capitalise on the Next Aluminium Supply Shock?
Discovery Alert's proprietary Discovery IQ model delivers instant notifications on significant ASX mineral discoveries, including aluminium and base metals companies positioned to benefit from current market volatility. Begin your 14-day free trial today and discover why major mineral discoveries can generate substantial returns when market conditions create perfect investment opportunities.