July 5, 2026
When Futures Curves Tell the Real Story
Commodity markets rarely move in straight lines, and the signals they transmit are seldom as simple as a rising or falling price. The architecture of a futures curve, the distribution of warehouse warrants, and the behaviour of regional reference prices collectively form a diagnostic system that experienced traders read like a medical chart. When multiple indicators deteriorate simultaneously, the market is communicating something worth listening to carefully. The LME aluminium prices decline on June 10, 2025 offers a textbook case study in how these interlocking mechanisms interact, and what they reveal about the current state of global aluminium demand.
When big ASX news breaks, our subscribers know first
How the June 10 Sell-Off Unfolded Across the Entire Curve
The breadth of the June 10 decline was notable not just for its magnitude but for its uniformity. Every segment of the aluminium futures curve retreated, though the severity of losses varied significantly by contract tenor. The table below captures the full scope of the move:
| Contract Type | June 9 Price (USD/t) | June 10 Price (USD/t) | Change (%) |
|---|---|---|---|
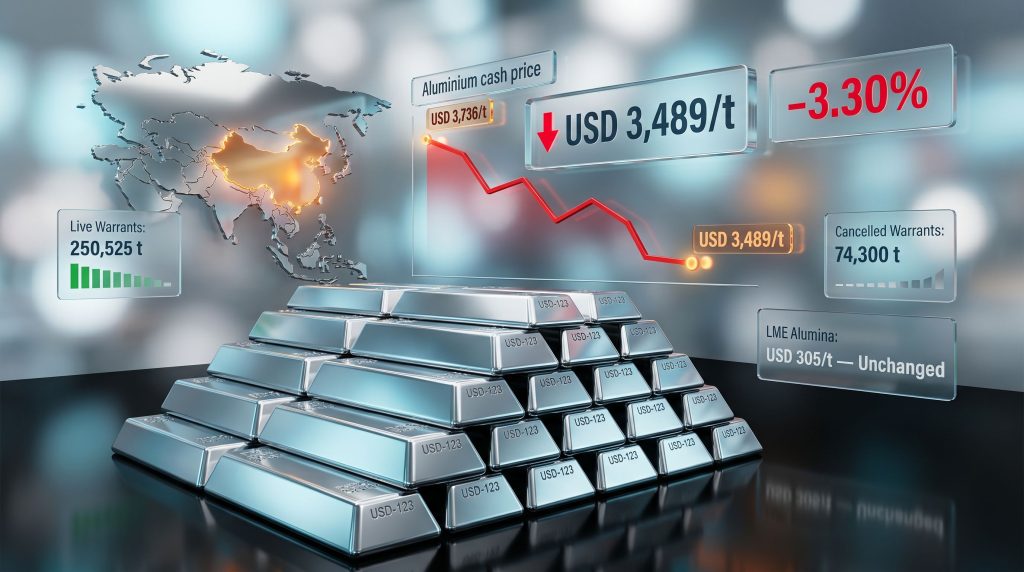
| Cash Bid | 3,607 | 3,488 | -3.30% |
| Cash Offer | 3,608 | 3,489 | -3.30% |
| 3-Month Bid | 3,585 | 3,480.50 | -2.92% |
| 3-Month Offer | 3,586 | 3,481 | -2.93% |
| Dec 2027 Bid | 3,245 | 3,207 | -1.17% |
| Dec 2027 Offer | 3,250 | 3,212 | -1.17% |
| Asian Reference Price | 3,547.50 | 3,466 | -2.30% |
The most instructive element here is not the absolute price level but the gradient of decline across the curve. Cash contracts shed more than 3.30% in a single session, while the December 2027 forward contract fell by a comparatively contained 1.17%. This differential is not coincidental. Furthermore, understanding the broader context of aluminum and alumina markets helps clarify why such divergence between short and long-dated contracts carries such analytical weight.
In futures market analysis, when front-month contracts underperform distant contracts during a broad sell-off, the signal is almost always rooted in near-term demand softness or a localised supply imbalance rather than a fundamental reassessment of long-run market value.
This pattern, known as contango widening, occurs when immediate delivery prices fall faster than deferred prices, creating a structure where the market effectively pays a premium for future metal over prompt metal. Physical consumers who are not under pressure to secure immediate supply have little incentive to step in and defend spot prices, allowing the front end of the curve to drift lower without significant buy-side resistance.
Five Days of Sequential Decline: Understanding the Broader Context
Framing the June 10 session in isolation risks misreading its significance. The move was the culmination of a sustained multi-session deterioration that had been building across the first two weeks of June:
- June 5: USD 3,736/t
- June 8: USD 3,669.50/t
- June 9: USD 3,608/t
- June 10: USD 3,488/t
Across these four trading sessions, the LME aluminium cash price shed approximately USD 247 per tonne, a cumulative decline of roughly 6.6%. A move of this magnitude compressed into fewer than a week of trading sessions points decisively to persistent macro or structural headwinds rather than a single-day technical event or isolated news shock.
What the Curve Shape Reveals About Market Psychology
Experienced metals analysts frequently use curve shape as a sentiment barometer, and the June 10 data is particularly instructive on this front:
- The sharper decline at the short end of the curve relative to longer-dated contracts is consistent with weakening spot demand, where physical buyers are pulling back from immediate purchases
- The relative resilience of the December 2027 contract suggests that medium-to-long-term participants have not fundamentally revised their structural outlook for aluminium demand
- A transition from backwardation toward contango can signal that the urgency among downstream consumers to secure material has faded, often because they are drawing down existing inventory rather than purchasing fresh supply
- In backwardated markets, holding physical aluminium is rewarded as the spot price commands a premium. When that structure begins to erode, it can trigger a feedback loop in which speculative long holders reduce exposure, amplifying the downward price impulse
In addition, the commodity market volatility evident across this period underscores the importance of robust commodity market volatility hedging strategies for participants exposed to aluminium price swings.
What LME Warehouse Inventory Data Is Actually Communicating
The inventory picture that emerged from June 10 is one of the more analytically nuanced aspects of this session. On the surface, total warehouse stocks fell, which might appear price-supportive. The underlying detail, however, tells a more complex story.
| Metric | June 9 | June 10 | Change |
|---|---|---|---|
| Opening Stocks | 330,950 t | 327,750 t | -0.97% |
| Live Warrants | 254,625 t | 250,525 t | -1.61% |
| Cancelled Warrants | 73,125 t | 74,300 t | +1.61% |
The simultaneous decline in live warrants alongside the rise in cancelled warrants creates a signal that requires careful interpretation. Cancelled warrants represent metal that has been formally earmarked for physical withdrawal from LME-registered storage locations. Once cancelled, that metal is no longer available for exchange delivery and is effectively removed from the tradeable supply pool.
Why Falling Inventory Can Coexist With Falling Prices
This is one of the less intuitive dynamics in commodity market mechanics, and it catches many newer market participants off guard. The relationship between warehouse stocks and prices is not linear, and the June 10 data illustrates why:
- Inventory drawdowns reduce the visible buffer of exchange-deliverable supply, which in isolation creates upward price pressure
- However, if downstream demand is simultaneously weakening, the rate of new metal entering storage also slows or stops, meaning the inventory decline does not reflect tightening fundamental conditions but rather reduced market participation
- Rising cancelled warrants can also indicate that commodity traders or producers are opting to move metal off-exchange into private storage or directly to consumers, which does not necessarily reflect strengthening end-use demand
- When demand destruction is the dominant market force, it consistently overrides inventory-side support signals, and prices can fall even as visible stocks decline
- The June 10 data is consistent with a market in which physical buyers are fulfilling requirements through off-exchange channels or existing inventory, rather than competing for prompt LME-registered material
The paradox of falling inventories coinciding with falling prices is well-documented in metals markets. It occurs most reliably during periods of demand-led downturns, where the absence of buying interest matters more than the absence of visible supply.
The Asian Reference Price: A Window Into Regional Demand Health
The Asian Reference Price recorded a decline of 2.30% on June 10, slipping from USD 3,547.50 per tonne to USD 3,466 per tonne. This benchmark deserves more analytical attention than it typically receives in mainstream coverage, because it functions as a real-time barometer for physical buying appetite across the world's most consumption-intensive aluminium markets.
Asia, led by China, accounts for well over half of total global aluminium consumption. According to the International Aluminium Institute, China alone represents approximately 55 to 60% of world primary aluminium demand, a concentration that means any softness in Asian reference pricing carries outsized implications for the global market equilibrium. Consequently, China industrial demand trends remain among the most closely watched indicators for aluminium price direction. The countries feeding into this benchmark, including Japan, South Korea, and multiple Southeast Asian manufacturing hubs, represent a cross-section of the world's most active downstream fabrication and processing industries.
Reading Regional Arbitrage Signals
When the Asian Reference Price diverges significantly from the LME cash price, it can create regional arbitrage opportunities that sophisticated traders exploit by moving physical metal between markets. However, when both decline in tandem as occurred on June 10, it removes the arbitrage incentive and instead signals broad-based demand weakness that is not geographically isolated. The synchronised nature of the June 10 decline across both the LME cash price and the Asian Reference Price is therefore a more bearish signal than either data point in isolation.
For a broader perspective on how LME aluminium price movements are tracked and reported, the exchange's own data resources remain an essential reference point for market participants.
Alumina Stability and the Smelter Margin Squeeze
One of the less-discussed but strategically important dynamics from June 10 is the behaviour of alumina pricing during the aluminium sell-off. The LME Platts alumina price held firm at USD 305 per tonne across both June 9 and June 10, recording zero movement while the metal it produces fell sharply.
For context, aluminium smelting requires approximately 1.9 to 2.0 tonnes of alumina for every tonne of primary aluminium produced. This fixed input ratio means that when aluminium prices fall while alumina prices hold steady, the squeeze on smelter operating economics is both immediate and mechanical.
| Metric | Value |
|---|---|
| LME Aluminium Cash (June 10) | USD 3,489/t |
| LME Alumina Platts (June 10) | USD 305/t |
| Implied Alumina Cost per Tonne of Al | ~USD 580-610/t |
| Alumina as % of Cash Aluminium Price | ~16.6-17.5% |
While alumina represents only one component of the total smelting cost structure, energy costs, labour, carbon compliance obligations, and capital charges account for the remainder, a rising alumina-to-aluminium price ratio is widely used as a proxy for industry-wide margin stress. When this ratio widens during a period of aluminium price weakness, the historical precedent across multiple commodity cycles suggests that higher-cost smelters begin assessing curtailment thresholds.
The Curtailment Feedback Loop
This is where smelter economics intersect with longer-term price dynamics in ways that matter for forward-looking investors:
- As smelter margins compress, production at the highest-cost facilities becomes economically unsustainable
- Curtailments reduce future supply, which over time tends to tighten market balance and support prices
- This supply-response mechanism is a well-established feature of the aluminium industry cycle, and has historically operated with a lag of several months between margin compression and meaningful production cuts
- The energy intensity of aluminium smelting, which is the most energy-intensive of all base metals production processes, makes this dynamic particularly acute in regions where electricity prices are volatile or high
The next major ASX story will hit our subscribers first
The Six Key Drivers of Short-Term LME Aluminium Price Volatility
Understanding any single session's price movement requires placing it within a multi-factor analytical framework. The June 10 decline was shaped by a confluence of forces that operate across different time horizons and geographies:
- US Dollar Index (DXY) Dynamics — Aluminium, like all LME metals, is priced in US dollars. A strengthening dollar effectively raises the cost of aluminium for non-dollar buyers, suppressing demand from Asian and European importers and exerting downward pressure on prices
- Chinese Industrial Activity Signals — Manufacturing PMI readings, property sector transaction volumes, and infrastructure project announcements from China shift market sentiment rapidly. Weak Chinese data in the days surrounding June 10 would have amplified selling pressure
- Energy Market Conditions — As the most energy-intensive base metal to produce, aluminium pricing is structurally linked to electricity and gas prices in major smelting regions. Falling energy costs can lower production floors and bring marginal supply back to market, which is bearish for prices
- Speculative Positioning and Warrant Activity — LME Commitments of Traders data tracks the net long or short positioning of money managers and financial participants. Large speculative long positions that are unwound during a sell-off can dramatically amplify price declines beyond what fundamental supply-demand balances would justify
- Physical Warrant Cancellations — Rising cancelled warrants signal that metal is being pulled from LME storage, tightening exchange-visible supply. However, as discussed, this signal is ambiguous when accompanied by broader demand weakness
- Trade Policy and Geopolitical Disruptions — The aluminium tariffs impact from recent US trade measures has added a layer of policy-driven uncertainty, alongside sanctions on major producing nations and export restriction changes affecting Russia or China, which can create abrupt dislocations that override near-term fundamentals
Frequently Asked Questions: LME Aluminium Market Mechanics
What is the LME aluminium cash price and why does it matter?
The LME aluminium cash price is the benchmark settlement price for immediate delivery of aluminium at LME-registered warehouse locations globally. It serves as the reference point for an enormous volume of physical aluminium contracts, derivative instruments, and long-term supply agreements across industries ranging from automotive manufacturing to packaging and construction. Monitoring real-time aluminium price data is therefore essential for any participant seeking to manage exposure effectively.
What is the practical difference between live and cancelled warrants?
- Live warrants are warehouse receipts representing aluminium held in LME-registered storage that remains available for exchange trading and physical delivery
- Cancelled warrants are receipts for metal that has been earmarked for physical removal from LME storage. Once metal is under a cancelled warrant, it exits the tradeable pool and can no longer serve as collateral for exchange transactions
Why do forward contracts fall less than cash prices during a sell-off?
Forward contracts reflect long-term equilibrium pricing assumptions, which are less susceptible to short-term demand fluctuations or inventory shifts. A smaller decline in the December 2027 contract relative to the cash price on June 10 indicates that market participants view the near-term weakness as cyclical rather than structural, and retain confidence that aluminium demand will recover over a multi-year horizon.
What does the Asian Reference Price decline signal for manufacturers?
A falling Asian Reference Price indicates that physical buyers across Asian manufacturing and fabrication sectors are either reducing purchasing activity, destocking existing inventory, or negotiating harder on spot transactions. For downstream aluminium product manufacturers, this can signal an opportunity to secure raw material at lower cost, but it simultaneously reflects weaker end-market conditions for their own products. Furthermore, the role of top aluminium producers in managing output during these periods shapes how quickly supply-side adjustments flow through to pricing.
How quickly do smelters respond to margin compression?
Smelter production decisions are not made overnight. Curtailment decisions typically involve commercial, contractual, and operational considerations that introduce a lag of weeks to months between margin compression and actual output reductions. High-cost smelters with flexible energy contracts respond faster, while large-scale operations with long-term power agreements may absorb margin pressure for extended periods before taking action.
What June 10 Tells Us About Where the Market Stands
The LME aluminium prices decline on June 10 was not a random fluctuation. It was the product of compounding pressures that had been accumulating across the prior trading sessions, expressed most acutely at the front end of the futures curve where physical market conditions are most immediately reflected.
Several conclusions emerge from a structured analysis of this session:
- The 6.6% cumulative decline from June 5 to June 10 in cash prices points to sustained macro headwinds rather than a one-day technical anomaly
- The differential between front-end and long-dated contract declines confirms that market participants are pricing in near-term demand weakness without fundamentally abandoning longer-run bullish assumptions
- The simultaneous decline in the Asian Reference Price removes any regional demand interpretation that might otherwise soften the bearish signal from LME cash prices
- Stable alumina pricing during the aluminium sell-off is compressing smelter margins in real time, a dynamic that historically precedes production curtailments among higher-cost operators
- The mixed inventory signal, falling live warrants alongside rising cancellations, underscores that the dominant market force on June 10 was demand-side softness rather than a supply-side shock
Disclaimer: This article is intended for informational and educational purposes only. It does not constitute financial advice, investment guidance, or a recommendation to buy or sell any commodity, security, or financial instrument. Commodity markets are inherently volatile and past price movements are not indicative of future performance. Readers should conduct independent research and consult qualified financial advisers before making any investment decisions.
Want to Position Ahead of the Next Major ASX Mineral Discovery?
Discovery Alert's proprietary Discovery IQ model delivers real-time alerts on significant ASX mineral discoveries, cutting through complex market data to surface actionable opportunities the moment they emerge — explore historic discoveries and their returns to understand the potential, then begin your 14-day free trial at Discovery Alert to secure your market-leading edge.