August 7, 2026
When Physical Markets Diverge From Paper Prices: Reading the LME Aluminium Signal
Few dynamics in commodity markets are as analytically revealing as the simultaneous rise in exchange prices and fall in exchange-held inventories. LME aluminium cash prices recover while stocks continue downward — this combination, when sustained across multiple sessions and confirmed across an entire forward curve, tends to signal something deeper than speculative positioning. It points toward genuine physical scarcity, the kind that procurement teams feel before financial analysts model it. In the aluminium market, this divergence has become one of the more consequential stories unfolding through mid-2026, with the August 6 session offering a particularly clear snapshot of where supply and demand pressures are converging.
When big ASX news breaks, our subscribers know first
Why Price-Inventory Divergence Matters More Than Either Metric Alone
In base metals, price movements alone are an unreliable signal. A rising cash price can reflect speculative positioning, dollar weakness, or momentum-driven short-covering rather than any genuine change in physical availability. Inventory data, similarly, can be distorted by financing trades, warrant cancellations tied to logistical timing, or warehousing decisions that have little to do with real consumption.
What makes the current LME aluminium situation analytically distinct is the combination of both trends reinforcing each other across an extended period. When prices climb while exchange stocks fall in a sustained and broad-based way, it strongly suggests that physical buyers are drawing down available metal faster than it is being replenished. This is a fundamentally different dynamic from a speculative rally and carries different implications for pricing durability.
The key distinction market participants track is whether a price recovery is spot-specific or curve-wide. A short-covering event typically lifts cash prices while leaving longer-dated contracts relatively unchanged. A fundamental-demand reassertion, by contrast, tends to lift prices across the entire forward curve, including contracts settled years into the future. Furthermore, understanding aluminium and alumina markets together provides essential context for interpreting these signals correctly.
A Full Forward Curve Recovery: The August 6 Session in Detail
The August 6, 2026 trading session produced exactly the kind of broad-based recovery that suggests more than technical positioning. Every contract along the LME aluminium forward curve recorded gains, from the front-month cash contract through to the December 2027 settlement.
| Contract | Previous Price (USD/t) | August 6 Price (USD/t) | Change (%) |
|---|---|---|---|
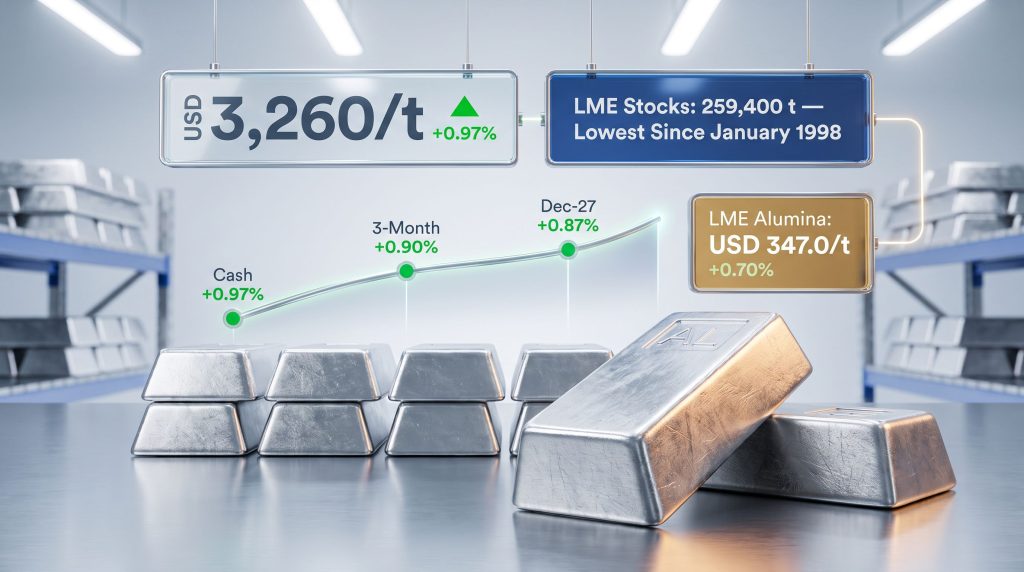
| Cash Bid | 3,228.5 | 3,260.0 | +0.97% |
| Cash Offer | 3,229.0 | 3,261.0 | +0.99% |
| 3-Month Bid | 3,229.0 | 3,258.0 | +0.90% |
| 3-Month Offer | 3,229.5 | 3,260.0 | +0.94% |
| Dec-27 Bid | 3,160.0 | 3,188.0 | +0.87% |
| Dec-27 Offer | 3,165.0 | 3,193.0 | +0.88% |
| Asian Reference Price | 3,241.0 | 3,259.0 | +0.55% |
The cash bid settled at USD 3,260 per tonne, representing a 0.97% gain from the prior session's USD 3,228.5 per tonne. The cash offer moved in virtual lockstep, advancing 0.99% to USD 3,261 per tonne. These are meaningful single-session moves for a market that has been navigating conflicting signals from supply disruptions, demand seasonality, and macro uncertainty throughout 2026.
Notably, the December 2027 contracts gained 0.87–0.88%, nearly mirroring the cash market's recovery. This parallel movement across near-dated and far-dated contracts is analytically significant. Markets in backwardation typically see outsized gains in the front month relative to the back, reflecting urgency for immediate physical delivery. When gains are distributed evenly across the curve, it implies traders are pricing in sustained fundamental tightness rather than a transient supply shock.
The LME aluminium three-month Asian Reference Price closed at USD 3,259 per tonne, a more modest gain of 0.55%, reflecting regional demand dynamics that can differ from the global benchmark. The Asian reference price is particularly relevant for buyers in Japan, South Korea, and Southeast Asia, where quarterly physical premiums are often negotiated against this benchmark. According to LME Insight, aluminium prices have recently come off four-year highs amid uncertainty surrounding a potential US-Iran deal, adding further complexity to the pricing environment.
LME Aluminium Inventory: Approaching Historically Unprecedented Territory
The price recovery occurred against a backdrop of inventory levels that, by historical standards, are deeply unusual. LME aluminium opening stocks fell to 259,400 tonnes on August 6, down from 260,900 tonnes the previous session, a 0.57% single-day decline.
To appreciate the full significance of this figure, context matters enormously. In late July 2026, total LME aluminium stocks were reported at approximately 271,275 tonnes, described as the lowest level recorded since January 1998. That makes this a genuinely multi-decade inventory event, not a routine seasonal fluctuation.
| Inventory Metric | Previous Level | August 6 Level | Change |
|---|---|---|---|
| Total Opening Stocks | 260,900 t | 259,400 t | -0.57% |
| Live Warrants | 244,650 t | 244,650 t | Unchanged |
| Cancelled Warrants | 14,750 t | 13,250 t | -10.17% |
The warrant structure within this data deserves careful attention. On the LME, warehouse metal exists in two categories:
- Live warrants represent metal that is available for trade on the exchange and can be bought or sold freely.
- Cancelled warrants represent metal that has been earmarked for physical delivery and is no longer available for exchange trading.
A spike in cancelled warrants typically signals that a buyer has decided to take physical possession of metal stored in an LME warehouse, removing it from the tradeable pool. A fall in cancelled warrants, as seen on August 6 with a sharp 10.17% decline from 14,750 to 13,250 tonnes, suggests that some previously earmarked metal may have either been delivered and removed from the system entirely, or that cancellation orders were reversed.
The critical insight here is that while a falling cancelled warrant count can appear superficially bullish (less imminent physical removal), the sustained decline in total stocks tells the more important story: metal is leaving the LME warehouse system at a rate that exceeds inflows, regardless of warrant mechanics.
The Supply Disruption Architecture Behind the Drawdown
Understanding why LME aluminium stocks have fallen to levels not seen since the late 1990s requires tracing the supply chain disruptions that have reshaped global aluminium trade flows through 2026. The Strait of Hormuz has emerged as a central variable, with uncertainty around shipping routes in the Gulf region creating meaningful disruptions to aluminium supply chains that originate in or transit through the Middle East.
The Gulf region, particularly the UAE and Bahrain, has become a significant contributor to global primary aluminium production over the past two decades. When shipping routes through the Strait of Hormuz face uncertainty, buyers who would ordinarily source metal through normal bilateral trade channels face elevated procurement risk. The response, documented across multiple commodity markets historically, is to turn to exchange-warranted stocks as a supply backstop.
This behaviour creates a self-reinforcing drawdown dynamic:
- Physical buyers face uncertainty in their usual supply channels.
- They draw on LME-warranted warehouse stocks to maintain production continuity.
- Total exchange inventories fall as metal leaves the system.
- Falling stocks tighten visible supply further, supporting cash prices.
- Rising cash prices incentivise further procurement from available exchange stocks before prices move higher.
This mechanism explains why the 2026 price and inventory trajectory has played out the way it has:
- Early June 2026: Primary aluminium prices surged to a four-year high, driven by supply disruption premiums linked to Gulf shipping uncertainty.
- Mid-June to July: Prices retreated as the immediate disruption premium partially moderated and seasonal downstream weakness emerged.
- Late July to August: Physical tightness reasserted itself as exchange stocks approached multi-decade lows.
- August 6: A broad-based recovery across cash, three-month, and longer-dated contracts confirmed renewed buying conviction.
It is worth noting that off-season downstream weakness continues to place a ceiling on aluminium price upside even as supply-side pressures persist. The downstream sectors of construction, automotive, and packaging typically see reduced activity during summer months in key consuming regions, which limits the immediate demand-pull component of any price rally. In addition, the China metals demand outlook remains a critical variable, as shifts in Chinese consumption can rapidly alter global trade flow dynamics.
How Do Tariff Policies Shape the Broader Picture?
Beyond supply chain disruptions, policy factors have also played a role in reshaping aluminium trade flows globally. The aluminium tariff impacts introduced in recent years continue to redirect metal flows in ways that affect LME warehouse stock distributions and regional premium structures. Consequently, procurement teams operating across multiple jurisdictions must account for both physical tightness and policy-driven cost overlays simultaneously.
Upstream Cost Signals: What LME Alumina Is Telling Smelters
A less-discussed but analytically important data point from the August 6 session is the movement in the LME Alumina Platts price, which rose 0.70% from USD 344.6 per tonne on August 5 to USD 347 per tonne on August 6.
| Metric | August 5 | August 6 | Change |
|---|---|---|---|
| LME Alumina Platts Price | USD 344.6/t | USD 347.0/t | +0.70% |
Alumina is the intermediate product refined from bauxite ore before being smelted into primary aluminium. It typically accounts for 30–40% of the total cash cost of primary aluminium production for an integrated smelter, making it one of the most significant variable cost inputs in the industry.
When alumina prices rise in conjunction with primary aluminium prices, it creates a complex dynamic:
- For integrated producers (those who control both the refining and smelting operations), rising alumina costs are partially offset by rising aluminium revenues, though the margin impact depends on the relative pace of each movement.
- For merchant smelters that purchase alumina on the open market, rising alumina costs directly compress profitability unless primary aluminium prices rise proportionally.
- For the price floor, rising input costs effectively set a higher minimum at which smelters can continue operating without incurring losses, which provides a structural support beneath primary aluminium pricing.
The simultaneous rise in both alumina and primary aluminium on August 6 suggests cost-push pressures are building from the upstream end of the value chain, not just demand-pull dynamics from the downstream end. For further context on how the top aluminium producers are navigating these cost pressures, the interplay between feedstock costs and smelter margins is increasingly central to corporate strategy decisions.
The next major ASX story will hit our subscribers first
Structural vs. Cyclical: Assessing Whether This Rally Has Legs
One of the central analytical questions for market participants following the August 6 session is whether the price recovery represents a durable structural shift or a temporary technical rebound. Several frameworks help evaluate this:
The Inventory Threshold Argument
When LME stocks fall below approximately 250,000–300,000 tonnes, the market's ability to absorb sudden demand spikes or supply disruptions becomes severely constrained. At 259,400 tonnes and falling, the market is approaching a zone where physical tightness can force cash prices into backwardation — where spot metal trades at a premium to forward contracts — a historically reliable signal of genuine scarcity.
The Forward Curve Participation Argument
The near-equal gains across cash (+0.97%), three-month (+0.90%), and December 2027 (+0.87%) contracts on August 6 suggest this is not a spot-specific technical bounce. Structural rallies tend to lift the entire curve, while short-cover rebounds concentrate gains at the front end.
The Seasonal Headwind Argument
The traditional summer slowdown in downstream aluminium consumption creates a natural counterweight to supply-driven price support. Construction activity, automotive production schedules, and consumer goods manufacturing all tend to be seasonally softer in July–August, which limits the demand component of any price rally. However, green steel pricing trends and adjacent metals market dynamics can add further cross-market complexity to the seasonal picture. Furthermore, according to Reuters, LME aluminium stock movements have historically followed cyclical patterns that reward careful monitoring at these inventory inflection points.
Scenarios for the path ahead include:
- Scenario A: LME stocks fall below 250,000 tonnes, triggering backwardation and accelerating cash price appreciation as physical buyers compete for limited available metal.
- Scenario B: Gulf shipping disruptions ease materially, reducing the supply-chain urgency that has driven exchange stock drawdowns, though the existing structural deficit may persist regardless.
- Scenario C: Downstream restocking in Q4 2026, when construction, automotive, and packaging sectors typically accelerate procurement ahead of year-end, provides a demand-side boost that compounds the supply tightness already evident.
- Scenario D: Chinese smelter output expands more rapidly than anticipated, adding supply that could partially offset the Gulf-related disruptions and slow the inventory drawdown trajectory.
Frequently Asked Questions: LME Aluminium Prices and Inventory Dynamics
What does it mean when LME aluminium cash prices rise while stocks fall?
It is a signal of physical market tightness. Rising prices alongside falling exchange inventories suggest that real demand for metal exceeds the pace of supply into the exchange system. This is generally considered a more durable price signal than price gains accompanied by rising or stable stocks.
Why are LME aluminium inventories at their lowest level since 1998?
Multiple converging factors have driven the drawdown: supply chain disruptions linked to Gulf region shipping uncertainty, sustained physical buying by end-users seeking supply security, and a period of reduced producer inflows into LME warehouses. The combination has been unusually persistent.
What is the difference between live warrants and cancelled warrants on the LME?
Live warrants represent metal available for exchange trading. Cancelled warrants represent metal earmarked for physical delivery, removing it from the tradeable pool. A rising cancelled warrant count typically signals imminent physical offtake; a falling count can indicate that delivery intentions have been reversed or that delivery has already been completed.
How does the LME Asian Reference Price differ from the standard cash price?
The Asian Reference Price is calculated from LME trading during Asian market hours, providing a benchmark more directly relevant to buyers in Japan, South Korea, China, and Southeast Asia. Regional physical premiums in Asia are often negotiated relative to this price rather than the standard LME cash settlement.
Does a rising LME alumina price always lead to higher primary aluminium prices?
Not necessarily, but rising alumina costs do establish a higher floor beneath which primary aluminium production becomes loss-making. Over time, sustained alumina price increases tend to support primary aluminium prices by raising the cost of production that smelters require to remain profitable.
What level of LME inventory is considered critically low for the aluminium market?
There is no universal threshold, but the market has historically shown significant price sensitivity when total LME aluminium stocks fall below approximately 250,000–300,000 tonnes. At current trajectory, the market is approaching this zone, which historically correlates with intensified backwardation and elevated physical premiums.
Five Metrics That Define the August 6 Market Signal
For traders, procurement professionals, and investors monitoring LME aluminium cash prices recover while stocks continue downward, the August 6 session crystallised five data points that warrant ongoing attention:
- Cash bid at USD 3,260/t reflects a near-1% single-session gain confirming renewed buying interest at current price levels.
- Total LME stocks at 259,400 tonnes continues a trajectory toward levels not seen in nearly three decades.
- Cancelled warrants down 10.17% to 13,250 tonnes, a sharp single-session reduction that warrants monitoring for what it implies about near-term delivery activity.
- Dec-27 contracts gaining 0.87–0.88% alongside cash markets, signalling that the forward curve is participating broadly in the recovery rather than reflecting a purely spot-driven move.
- LME Alumina Platts at USD 347/t adds an upstream cost dimension to the price picture, establishing a higher floor beneath primary aluminium economics.
What to watch next: the trajectory of total LME stocks through August will be the single most important indicator of whether physical tightness intensifies sufficiently to push the forward curve into sustained backwardation. Downstream sector procurement activity in September and October, as Q4 restocking begins, will determine whether demand-side forces compound the supply-driven dynamics already visible in exchange data.
Disclaimer: This article contains forward-looking analysis, scenario projections, and market commentary for informational purposes only. It does not constitute financial or investment advice. Commodity markets are subject to rapid change, and past price behaviour is not indicative of future outcomes. Readers should conduct independent research and consult qualified advisors before making any trading or investment decisions.
Want to Stay Ahead of the Next Major Mineral Discovery on the ASX?
While physical aluminium markets signal deepening supply tightness, Discovery Alert's proprietary Discovery IQ model scans ASX announcements in real time, instantly identifying significant mineral discoveries across more than 30 commodities and converting complex data into actionable investment insights — explore historic discovery returns on Discovery Alert's dedicated discoveries page and begin your 14-day free trial to position yourself ahead of the broader market.