August 6, 2026
The Architecture of a Base Metal Price Signal
Understanding a single trading session in the London Metal Exchange aluminium market requires more than reading a price ticker. Each data point, from cancelled warrant volumes to long-dated contract movements, functions as a piece of a larger puzzle about global supply chains, smelter economics, and the shifting psychology of commodity traders. The session recorded on July 13, 2026 offers a particularly instructive case study, not because the moves were dramatic, but precisely because they were nuanced, with different parts of the aluminium forward curve telling different stories simultaneously.
When big ASX news breaks, our subscribers know first
LME Aluminium Prices Ease on July 13: What the Numbers Actually Show
The headline from July 13 is straightforward: LME aluminium prices ease on July 13 across cash and near-term contracts, while longer-dated positions moved in the opposite direction. However, the magnitude and meaning of those moves deserve careful unpacking. Furthermore, broader market context, including aluminum and alumina markets dynamics, helps frame the session's significance.
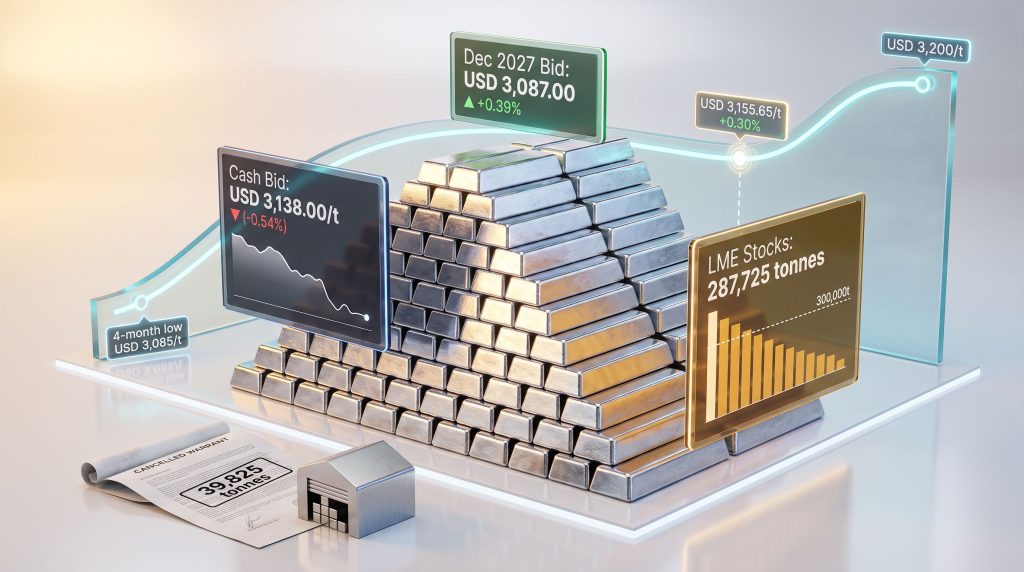
The LME aluminium cash bid fell to USD 3,138 per tonne, representing a decline of 0.54% from the July 10 close of USD 3,155.50 per tonne. The cash offer price mirrored this movement, slipping 0.55% to USD 3,138.50 per tonne from USD 3,156 per tonne. Three-month bid and offer prices also softened, though with notably less severity, declining 0.24% and 0.19% respectively to USD 3,145 and USD 3,147 per tonne.
What stands out immediately is the divergence at the long end of the curve. The December 2027 contract bucked the trend, with both bid and offer prices gaining 0.39% to reach USD 3,087 and USD 3,092 per tonne respectively. This is not noise. When short-dated contracts fall while long-dated contracts rise, it typically signals that market participants are repositioning their forward expectations, pricing in near-term softness while retaining medium-term optimism about fundamentals.
Full Contract Price Comparison: July 10 vs. July 13, 2026
| Contract Type | July 10 Price (USD/t) | July 13 Price (USD/t) | % Change |
|---|---|---|---|
| Cash Bid | 3,155.50 | 3,138.00 | -0.54% |
| Cash Offer | 3,156.00 | 3,138.50 | -0.55% |
| 3-Month Bid | 3,152.50 | 3,145.00 | -0.24% |
| 3-Month Offer | 3,153.00 | 3,147.00 | -0.19% |
| Dec 2027 Bid | 3,075.00 | 3,087.00 | +0.39% |
| Dec 2027 Offer | 3,080.00 | 3,092.00 | +0.39% |
| Asian Reference | n/a | 3,169.50 | n/a |
The LME aluminium Asian Reference Price of USD 3,169.50 per tonne is also significant. Sitting meaningfully above the London cash price on the same date, it reflects stronger demand signals from Asian markets, where aluminium consumption tied to infrastructure investment and manufacturing activity remained more robust than in Western end-use sectors dealing with tariff-related demand uncertainty.
The Alumina-to-Aluminium Ratio: Reading Smelter Margin Pressure
Often overlooked in headline coverage, the LME alumina Platts price of USD 330.9 per tonne on July 13 provides an important upstream reference point. Alumina is the primary feedstock consumed in the Hall-Heroult smelting process used to produce primary aluminium. The ratio of alumina cost to aluminium revenue directly determines smelter profitability.
At current levels, alumina represented roughly 10.5% of the aluminium price per tonne, sitting below the long-run average ratio of approximately 12–14%. This relative compression in feedstock costs offered a modest margin buffer to smelters, even as primary metal prices softened. However, any sustained aluminium price decline without a corresponding alumina price reduction would quickly erode that cushion, potentially triggering production curtailments at higher-cost smelting operations.
Inventory Signals: What the Warehouse Data Reveals
LME Stock Drawdown Continues Below a Critical Threshold
LME aluminium opening stocks on July 13 stood at 287,725 tonnes, a decline of 1,500 tonnes or 0.52% from the 289,225 tonnes recorded on July 10. More significantly, this continues a sustained drawdown trajectory that pushed total LME inventory below the 300,000-tonne level for the first time since 2022.
In commodity markets, round-number inventory thresholds function as psychological anchors. A sustained move below 300,000 tonnes in LME aluminium stocks carries disproportionate market attention relative to the raw tonnage implied, because it signals a structural tightening in physically deliverable supply within the LME warehouse network.
This matters for pricing because LME-registered warehouse stocks serve as the market's last-resort physical buffer. When these inventories fall, the cost of sourcing material for physical delivery rises, which typically exerts upward pressure on the cash-to-three-month spread, a key barometer of physical market tightness known as the nearby premium or backwardation signal. In addition, global aluminium producers are closely watching these inventory trends to calibrate their output decisions.
Cancelled Warrants: The Inventory Metric Most Investors Misread
One of the most misunderstood metrics in base metal markets is the cancelled warrant figure. A warrant in LME terminology represents a title document over a specific parcel of metal stored in an LME-approved warehouse. When a warrant is cancelled, it means that metal has been earmarked for physical withdrawal from the warehouse system. It has not yet left, but the intention to remove it has been registered.
On July 13, cancelled warrants fell 3.63% to 39,825 tonnes from 41,325 tonnes on July 10, while live warrants held steady at 246,400 tonnes on both dates.
LME Aluminium Inventory Metrics: July 10 vs. July 13, 2026
| Inventory Metric | July 10 (tonnes) | July 13 (tonnes) | Change |
|---|---|---|---|
| Opening Stocks | 289,225 | 287,725 | -1,500 (-0.52%) |
| Live Warrants | 246,400 | 246,400 | Unchanged |
| Cancelled Warrants | 41,325 | 39,825 | -1,500 (-3.63%) |
The decline in cancelled warrants is a near-term easing signal. Fewer warrants being cancelled suggests that the immediate physical withdrawal pressure from the LME system has reduced. However, this should not be conflated with a reversal of the broader drawdown trend. The net stock reduction of 1,500 tonnes on the day confirms that physical metal continued to leave the system; the pace of fresh cancellations simply moderated. Distinguishing between these two dynamics is critical for accurate interpretation.
Reconciling Conflicting Price Signals From the July 13 Session
When Data Sources Tell Different Stories
Market participants monitoring aluminium prices on July 13 encountered what appeared to be contradictory information depending on their data source. LME contract-specific bid and offer prices showed session-on-session declines of 0.19% to 0.55% across cash and three-month positions. Yet broader aluminium futures tracking indicated a price near USD 3,155.65 per tonne, representing a gain of approximately 0.30% on the day.
This divergence is not a data error. It reflects the difference between official LME closing prices for specific named contracts and intraday futures pricing that incorporates real-time trading activity across electronic platforms. The broader 0.30% gain reflected a continuation of the rebound from the early-July four-month low of approximately USD 3,085 per tonne, while the contract-specific bid-offer data captured the incremental session-on-session softening from the July 10 partial recovery.
Understanding which price reference is being cited is fundamental to interpreting aluminium market data. Institutional traders primarily reference LME official prices for settlement and hedging, while commercial buyers and sellers often track real-time electronic prices that can diverge significantly during periods of intraday volatility.
The USD 3,085 per tonne four-month low reached in early July 2026 serves as an important technical anchor. A sustained recovery above this level signals that the market absorbed the most aggressive selling pressure of the cycle. The failure to convincingly reclaim USD 3,200 per tonne, however, kept medium-term bulls cautious, as that level emerged as the key resistance threshold separating a technical correction from a genuine trend reversal.
The Macro Forces Shaping Mid-July Aluminium Pricing
US Dollar Dynamics and Their Commodity Market Transmission
One of the underappreciated drivers of aluminium price movement in July 2026 was currency dynamics. A weaker US dollar, partly reflecting market reaction to softer employment data including a below-consensus non-farm payrolls print, improved the purchasing power of non-US buyers of dollar-denominated commodities. Historically, a 1% decline in the DXY dollar index has correlated with a 0.5% to 1.2% uplift in base metal prices, with aluminium sitting in the middle of that range given its global trade intensity.
Tariff Uncertainty as a Structural Demand Overhang
The expansion of US aluminium tariffs to include a 50% levy on aluminium derivative products introduced a persistent demand-side fog through mid-2026. Unlike a one-time trade disruption, tariff escalation of this scale reshapes end-user procurement strategies across construction, automotive, and packaging sectors, all major aluminium consumers. The downstream uncertainty this created compressed forward buying activity, contributing to the overall price softness observed across near-term LME contracts.
The Dissipating Russian Premium and Chinese Supply Flows
A structurally significant development through the first half of 2026 was the gradual unwinding of the geopolitical risk premium that had previously elevated LME aluminium prices. As China industrial demand dynamics shifted and Chinese export volumes expanded into markets previously dependent on Russian supply, the narrative of Western supply scarcity lost its pricing support. This re-rating of geopolitical risk represented a fundamental shift in market architecture, not a temporary correction, and it contributed to the June-to-July price slide that culminated in the early-July low.
The June to July 2026 Price Trajectory in Context
| Period | Development | Price Impact |
|---|---|---|
| Early June 2026 | Cash-3M premium contracts sharply by ~USD 90/tonne in one week | Transition from fear-driven to fundamental-driven pricing |
| Mid-June 2026 | Geopolitical risk premiums fade; Chinese export volumes increase | Sustained downward price pressure |
| Early July 2026 | Four-month low of USD 3,085/tonne established | Peak bearish sentiment |
| July 10, 2026 | Cash bid recovers to USD 3,155.50/tonne | Partial technical rebound |
| July 13, 2026 | Cash contracts soften; December 2027 contracts gain | Divergent forward curve emerges |
The collapse of the cash-to-three-month premium by approximately USD 90 per tonne in a single week during early June was one of the more dramatic intra-curve moves of the year. In aluminium markets, this spread, technically known as the nearby basis, functions as a real-time indicator of physical tightness. A rapid compression of that premium signals a rapid easing of physical scarcity, which is precisely what unfolded as Chinese export supply flowed into the gap left by reduced Russian availability. Consequently, the global steel outlook for H2 2026 has similarly been shaped by these shifting trade flows across industrial metals.
The next major ASX story will hit our subscribers first
Key Drivers to Watch Through H2 2026
Supply-Side Variables
- Smelter operating rates in China, the world's dominant primary aluminium producer at roughly 57% of global output, remain critical. Any energy cost increases driven by power grid pressures in Yunnan or Sichuan provinces could trigger curtailments that tighten the global supply balance rapidly.
- Bauxite trade flows, particularly from Guinea which supplies a significant share of global bauxite, carry logistical and political risk that can feed through to alumina and ultimately aluminium prices across a 6–12 month lag.
- Energy input costs for smelting outside China, especially in Europe where power prices remain structurally elevated relative to pre-2021 norms, continue to constrain capacity utilisation at marginal operations.
Demand-Side Catalysts
- Green infrastructure spending, electric vehicle manufacturing, and grid-scale energy storage all represent structurally growing demand vectors for aluminium, given the metal's role in lightweight vehicle construction, cable systems, and battery enclosures.
- Near-term demand visibility remained clouded by tariff uncertainty through mid-2026, but the underlying secular demand growth narrative remained intact for investors with a 3–5 year horizon. Furthermore, aluminium price trends tracked by global commodity indices continue to reflect this long-term optimism.
Inventory Trajectory Watch
With LME aluminium stocks below 300,000 tonnes and approaching levels last seen in 2022, any continued drawdown toward 280,000 tonnes would represent a significant tightening of the physically available buffer. This threshold, if breached, could trigger a repricing of the nearby premium and provide a meaningful catalyst for cash price recovery above the USD 3,200 per tonne resistance level.
Frequently Asked Questions: LME Aluminium Prices July 2026
What was the LME aluminium cash price on July 13, 2026?
The LME aluminium cash bid price was USD 3,138 per tonne on July 13, 2026, down 0.54% from USD 3,155.50 per tonne recorded on July 10. The cash offer price declined by a similar margin to USD 3,138.50 per tonne. Broader futures tracking also recorded prices near USD 3,155.65 per tonne as the market continued to recover from the early-July four-month low of USD 3,085 per tonne.
What is a cancelled warrant and why did it fall on July 13?
A cancelled warrant in LME terminology represents a quantity of metal stored in an LME-approved warehouse that has been officially earmarked for physical withdrawal. On July 13, cancelled warrants declined 3.63% to 39,825 tonnes from 41,325 tonnes. This reduction signals that fewer new withdrawal requests were lodged on that date, easing immediate physical delivery pressure, though the overall inventory drawdown trend continued with total stocks falling to 287,725 tonnes.
Why did December 2027 contracts gain while cash prices fell?
The divergence between short-dated contract weakness and long-dated contract strength reflects a classic contango steepening dynamic, where near-term supply adequacy or demand softness depresses prompt prices while medium-term structural demand expectations sustain longer-dated valuations. Investors comfortable with a multi-year horizon were pricing in the secular demand growth narrative, while near-term traders responded to tariff uncertainty and dollar-driven volatility.
What is the significance of the LME Asian Reference Price?
The LME Asian Reference Price of USD 3,169.50 per tonne on July 13 is calculated during Asian trading hours and reflects regional demand conditions. Its position above the London cash price on the same date suggests that Asian buyers, operating in markets with different tariff exposures and demand profiles, perceived greater scarcity or higher replacement costs than their London counterparts, a divergence worth monitoring as a leading indicator of future London price direction.
Key Takeaways From the July 13 LME Aluminium Session
- Cash bid declined 0.54% to USD 3,138/tonne; cash offer fell 0.55% to USD 3,138.50/tonne
- Three-month contracts softened by 0.19%–0.24%, signalling muted near-term demand confidence
- December 2027 contracts gained 0.39%, reflecting medium-term structural demand optimism
- LME stocks fell to 287,725 tonnes, extending a sustained drawdown below the 300,000-tonne psychological threshold not breached since 2022
- Cancelled warrants dropped 3.63% to 39,825 tonnes, moderating immediate physical withdrawal pressure
- LME Asian Reference Price at USD 3,169.50/tonne sat above London cash prices, indicating stronger regional demand signals from Asia
- Alumina Platts price of USD 330.9/tonne represented a relatively favourable feedstock ratio for smelter margins at prevailing aluminium prices
- Macro headwinds, including US tariff expansion and a receding geopolitical risk premium from Russian supply disruptions, continue to shape the H2 2026 price outlook
This article is intended for informational purposes only and does not constitute financial or investment advice. Commodity markets are subject to rapid change, and all price data, inventory figures, and market analysis should be independently verified before being used as the basis for any commercial or investment decision. Past price movements do not guarantee future outcomes.
Want to Capitalise on the Next Major Commodity Discovery Before the Market Moves?
Discovery Alert's proprietary Discovery IQ model delivers real-time alerts on significant ASX mineral discoveries, instantly converting complex commodity data into actionable investment insights — explore historic discoveries and their returns to understand the opportunity, then begin your 14-day free trial at Discovery Alert to position yourself ahead of the broader market.