July 14, 2026
The Vanishing Safety Net: Why the Trump Hormuz Blockade Exposes a Fragile Oil Market
Energy markets have a long history of underpricing tail risks until those risks materialise with sudden, painful clarity. The pattern repeats across decades: a geopolitical shock strikes, prices surge, emergency buffers absorb the blow, and traders gradually convince themselves the danger has passed. The Trump Hormuz blockade standoff between the United States and Iran is fundamentally different from every prior episode — not because of the political rhetoric or the competing blockade declarations, but because of the condition of the global oil supply cushion sitting beneath those declarations. That cushion has been consumed, and what remains is dangerously thin.
When big ASX news breaks, our subscribers know first
The Geography That Cannot Be Replaced
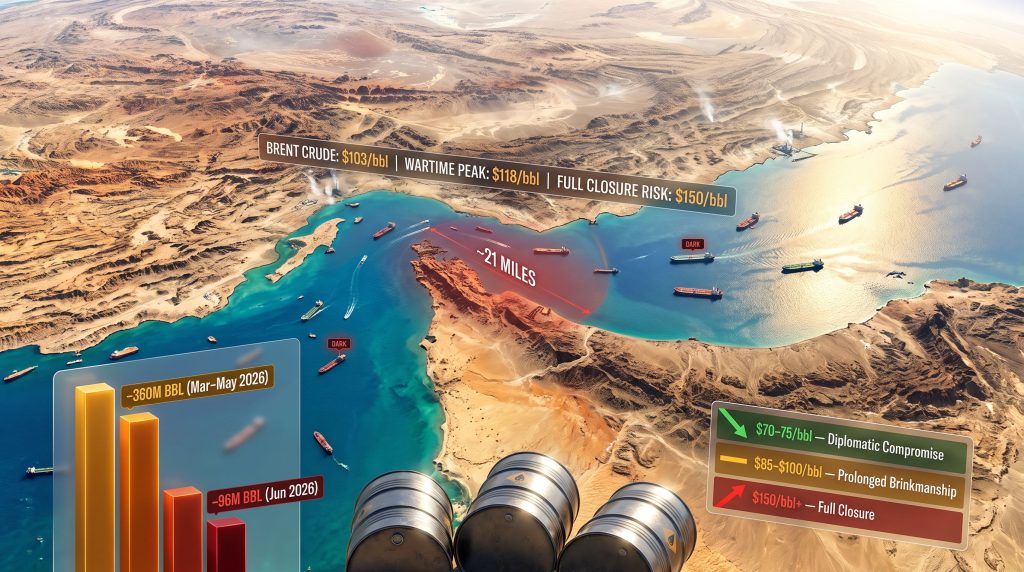
The Strait of Hormuz is a navigational corridor barely 21 nautical miles wide at its narrowest point, threading between Iran to the north and Oman and the United Arab Emirates to the south. Before the current conflict disrupted normal transit patterns, approximately one-fifth of all globally traded oil and liquefied natural gas volumes passed through this single chokepoint daily. No other waterway in the world concentrates so much energy trade in so little physical space.
The pipeline alternatives that theoretically exist are insufficient to compensate at scale. The East-West Pipeline across Saudi Arabia carries a fraction of the volume that transits Hormuz, and it is already operating. Overland routing options face insurmountable capacity constraints. The architecture of global oil trade was built around Hormuz, and decades of infrastructure investment have reinforced that dependency rather than diversified away from it.
This geography hands Iran a form of asymmetric leverage that no other regional power possesses. A nation that could not match American military capacity in a sustained conventional conflict retains the ability to inflict enormous economic pain on the global economy simply by making the strait unusable. Historical episodes in 1980, 1987, and 2019 each demonstrated how credible Hormuz closure threats translate into immediate and severe market reactions. The difference now is that those prior episodes occurred against a backdrop of healthy inventory levels.
The Dual Blockade Architecture and Its Internal Contradictions
The precise structure of competing blockade claims matters enormously for understanding where oil flows actually stand.
| Actor | Declared Action | Operational Scope | Legal Basis Claimed |
|---|---|---|---|
| United States | Naval blockade of Iranian-bound shipping | Vessels paying Iran for passage; not general transit | Executive authority and sanctions enforcement |
| Iran | Full waterway closure via mining and vessel attacks | All commercial traffic through the strait | Sovereign territorial claim |
| Houthi Forces | Red Sea disruption threatening Suez Canal bypass | Vessels transiting toward the canal | Political alignment with Iran |
CENTCOM's operational clarification of the U.S. position diverged notably from the public declaration made by President Trump, framing the action as targeted sanctions enforcement rather than a general blockade of transit shipping. Iran's approach, by contrast, relies on the physical mechanics of mining and vessel attack threats to create an effective closure without requiring a formally declared one.
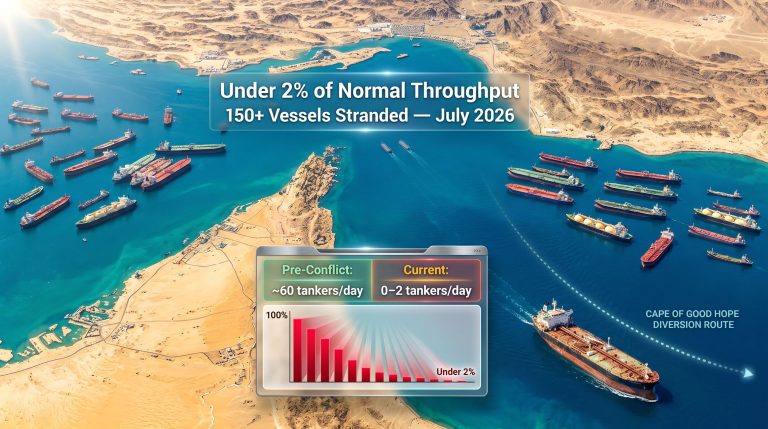
This distinction between declared and operational closure is critical for traders: an effective closure produces the same supply disruption regardless of its legal framing. The simultaneous Houthi threat to the Red Sea corridor eliminates the primary bypass route at exactly the moment it would otherwise be most needed. Cape of Good Hope rerouting, while physically possible, adds significant voyage time, cost, and fleet utilisation pressure that compounds the overall supply constraint.
How Oil Traders Initially Priced the Hormuz Crisis
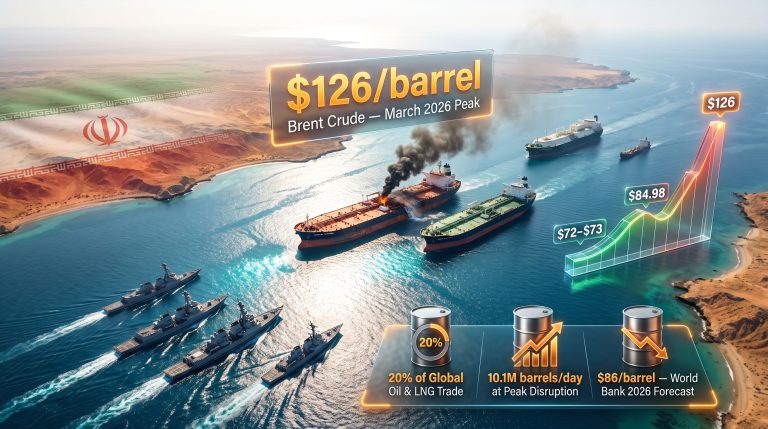
The initial market response to renewed escalation reflected genuine alarm. According to reporting from NBC News, WTI crude futures surged above $104 per barrel following the blockade announcements, while Brent crude climbed over 7% to breach $103 per barrel. The subsequent resumption of tit-for-tat attacks drove Brent up more than 10% to above $80 per barrel as of mid-July 2026. Furthermore, the oil price rally seen during this period echoed patterns from earlier geopolitical shocks, though the underlying supply conditions are markedly weaker.
Yet these price levels remain substantially below the wartime peak of $118 per barrel reached in late March 2026. That gap is the market's implicit statement about probabilities: traders are assigning a high likelihood to diplomatic resolution and a low likelihood to full strait closure. That probability assessment may be reasonable on its face, but it carries asymmetric downside consequences given the state of underlying inventories.
The spread between the wartime price ceiling and current trading levels reflects a market still betting heavily on a face-saving diplomatic outcome. The danger in that bet is not that it is wrong in expectation, but that the cost of being wrong has risen dramatically as emergency buffers have been drawn down. This article contains forward-looking price assessments that reflect analyst projections and should not be construed as financial advice.
The Hidden Supply Variable: Dark Fleet Activity
One factor suppressing visible price discovery deserves close attention from sophisticated market participants. In June 2026, it emerged that U.S. forces had covertly facilitated transit for approximately 200 commercial vessels, enabling the movement of an estimated 100 million barrels of oil through the strait via coordinated communications rather than formal naval escort.
Separately, analyst estimates suggest up to 2 million barrels per day may still be flowing through vessels deliberately operating with disabled AIS transponders. This shadow fleet activity, colloquially known in shipping markets as the dark fleet, creates a meaningful information asymmetry. The visible supply picture understates actual flow volumes, which temporarily dampens spot price formation.
However, dark fleet operations are inherently fragile: insurance coverage is often absent or legally ambiguous, enforcement actions can be sudden, and the vessels involved carry higher operational risk. Consequently, traders relying on official flow data without adjusting for dark fleet volumes are working with an incomplete dataset.
Supertanker Freight Rates as a Leading Risk Indicator
For traders seeking a real-time barometer that precedes spot price moves, the chartering market for Very Large Crude Carriers provides a more sensitive signal than headline futures. VLCC rates on Middle East-to-Asia routes have nearly doubled to record highs exceeding $400,000 per voyage. When physical cargo buyers are willing to pay these premiums, they are communicating something the futures market has not yet fully priced.
War-risk insurance premiums layered on top of elevated freight rates compound the total landed cost for Asian buyers, effectively creating a hidden tax on Persian Gulf crude that accelerates the procurement shift toward alternative sources such as U.S. crude grades. Understanding these oil price movements in the context of broader geopolitical pressures helps clarify why freight markets are behaving so unusually.
The Inventory Crisis: A Fundamentally Different Risk Environment
The most consequential analytical error currently embedded in market positioning is the assumption that the global oil system retains the same shock-absorbing capacity it possessed at the start of the February 2026 conflict. It does not.
| Metric | Data Point | Period |
|---|---|---|
| Global observed inventory decline | 360 million barrels | March to May 2026 |
| Average daily drawdown rate | approximately 3.9 million bpd | March to May 2026 |
| Additional onshore stock decline | 96 million barrels | June 2026 |
| June daily drawdown rate | approximately 3.2 million bpd | June 2026 |
| Middle Eastern export disruption | approximately 13 million bpd | Duration of conflict |
| Total oil lost from global supply chains | over 1 billion barrels | Since February 28, 2026 |
The IEA's observed inventory data, drawn from the International Energy Agency's monitoring of global commercial stocks, represents only a partial picture of total reserve depletion. It does not capture the full drawdown of strategic petroleum reserves held by governments, which were released in record volumes during the 108-day conflict to prevent the kind of catastrophic price shock analysts had feared when hostilities began.
Those emergency releases served their purpose during the conflict. They now represent a spent resource. The world enters the current escalation phase without the buffer that made the initial conflict manageable. In addition, the trade war oil impact from preceding months had already begun compressing inventory margins before the strait crisis intensified.
The U.S. Domestic Vulnerability
The American dimension of this inventory crisis carries a political dimension that directly constrains Washington's strategic freedom of action.
- Total U.S. crude and refined product stocks have fallen to their thinnest combined levels since 2003
- Gasoline inventories sit at their lowest seasonal reading since 2012, a politically sensitive metric entering peak summer driving demand
- U.S. crude export volumes during the conflict reached record highs as Washington supplied allied markets, accelerating domestic drawdown
- Vice President JD Vance publicly acknowledged that the ceasefire window was specifically needed to allow global inventory rebuilding
With gasoline stocks at multi-decade seasonal lows, any renewed disruption flowing through the Strait of Hormuz would transmit to U.S. pump prices within weeks rather than months. This timeline directly intersects with the political calendar ahead of November midterm elections, creating a powerful domestic constraint on the administration's willingness to tolerate prolonged escalation. Forward political assessments are speculative and reflect analytical inference rather than confirmed policy positions.
Three Scenarios and Their Oil Price Trajectories
Scenario 1: Face-Saving Diplomatic Compromise
This remains the highest-probability outcome. Both governments have strong incentives to de-escalate: Iran stands to receive substantial economic benefits from sanctions relief, unfrozen asset transfers, and potential foreign investment flows under the June 17 interim agreement framework. The Trump administration faces acute domestic political pressure from elevated gasoline prices heading into the midterm election cycle.
Under this scenario, a nominal compromise allows each party to claim partial victory while quietly restoring transit normalcy. Oil price trajectory under successful resolution points toward a gradual decline toward the $70 to $75 per barrel range as inventories rebuild over a six-to-nine-month horizon. Monitoring crude oil trends over the coming months will be essential for gauging how quickly this recovery path materialises.
Scenario 2: Prolonged Brinkmanship with Periodic Incidents
A moderate-probability scenario in which both sides conduct short-duration enforcement actions without triggering full-scale resumption of hostilities. This keeps prices range-bound between $85 and $100 per barrel with high volatility spikes on incident-specific news. The primary risk within this scenario is miscalculation during a naval confrontation or mining incident that neither side intended to escalate.
Scenario 3: Full Strait Closure and Return to Active Conflict
The lowest-probability but most consequential scenario. Complete cessation of Hormuz transit would remove approximately 20% of globally traded oil from accessible supply chains simultaneously. With emergency inventories already exhausted, the shock-absorption capacity that existed in February 2026 is no longer available.
Analyst projections place the potential price ceiling under this scenario at $150 per barrel or higher, with meaningful risk of demand destruction severe enough to trigger a global recession. The critical difference from the February conflict onset is structural: the world had full inventories then. It does not now. Iran has explicitly warned of $140 oil should the blockade persist, underscoring how quickly the ceiling could be tested.
The Transit Fee Proposal: Leverage, Not Policy
Trump's proposal to impose a 20% fee on vessels transiting Hormuz as payment for U.S. maritime protection deserves analysis as a negotiating instrument rather than an operationally viable policy. The International Maritime Organization was direct in its assessment that no legal mechanism exists under international maritime law to impose mandatory tolls on vessels transiting an international strait. Decades of U.S. freedom-of-navigation doctrine creates a direct legal contradiction with the fee proposal.
The more credible interpretation is strategic: the transit fee announcement functions as a pressure point in ongoing negotiations, signalling willingness to impose costs on Iranian-adjacent shipping activity rather than representing a genuinely enforceable toll regime.
How Global Trade Flows Are Being Permanently Reshaped
One underappreciated consequence of the current disruption is the potential permanence of procurement shifts that began as emergency diversification measures. European and Asian refiners who redirected crude purchasing toward U.S. grades during the conflict to avoid Hormuz-dependent supply chains are now evaluating whether to formalise those shifts into long-term offtake arrangements.
The premium commanded by U.S. hydrocarbons as a geopolitically lower-risk alternative has created a structural incentive for supply chain restructuring that persists independent of near-term diplomatic outcomes. Furthermore, OPEC market influence faces growing pressure from this dynamic, as member states whose export economics depend entirely on Hormuz passage have different interests than those with alternative export infrastructure.
The next major ASX story will hit our subscribers first
What Traders Should Monitor: Five Leading Indicators
For market participants navigating this environment, the most actionable intelligence comes from five real-time signals that precede spot price movements:
- VLCC freight rate movements on Middle East-to-Asia routes: the most sensitive barometer of physical supply risk currently available
- AIS transponder activity in the strait: changes in vessel tracking density provide early warning of traffic disruption before it appears in spot prices
- U.S. EIA weekly gasoline inventory reports: proximity to multi-year seasonal lows amplifies the political sensitivity of any supply deterioration
- Iranian sanctions relief progress: the pace of unfrozen asset transfers and investment commitment implementation measures ceasefire durability
- U.S. midterm election polling: Trump's domestic approval ratings on energy costs function as a practical constraint on escalation tolerance
The Asymmetric Risk Calculus
The fundamental analytical challenge for energy market participants is that the downside scenario — a full strait closure driving prices toward $150 per barrel against a backdrop of exhausted emergency reserves — is structurally more severe than any upside scenario involving diplomatic resolution. Yet options market positioning and futures curve structure suggest a market that has not fully priced this asymmetry.
Practical implications for different market participants include:
- Portfolio managers: Maintaining crude options exposure weighted toward upside scenarios reflects the asymmetric risk distribution more accurately than symmetric positioning
- Physical supply chain operators: Accelerating procurement shifts toward non-Hormuz-dependent supply sources while the diplomatic window remains open reduces exposure to sudden disruption
- Refiners and industrial consumers: Building precautionary inventory stocks during the current ceasefire window provides insurance against a renewed supply shock that the global system can no longer absorb through emergency releases
- Macro investors: Monitoring the five leading indicators as a systematic early warning framework rather than relying on headline diplomatic announcements
The Lesson the Market Keeps Refusing to Learn
The oil market's resilience during the 108-day conflict was genuine, but it rested on a foundation that no longer exists. Emergency reserves were full when the shooting started in February 2026. They are not full now. The rapid price recovery following the June 17 ceasefire announcement may have reinforced a dangerously misleading precedent: that geopolitical shocks to Hormuz can be absorbed without lasting damage.
The structural difference between February 2026 and July 2026 is not political or diplomatic. It is arithmetical. The world has approximately 456 million fewer observed barrels of oil inventory available to buffer a renewed shock than it did when this conflict began. Brinkmanship between powers capable of catastrophic miscalculation, conducted over a 21-mile-wide waterway with no viable alternative, deserves more risk premium than current prices imply.
The Trump Hormuz blockade and Iran's counter-declarations have created a situation where the most dangerous variable is not the next diplomatic statement. It is the number that does not appear in any headline: the depth of the safety net that no longer exists beneath this standoff.
This article is intended for informational purposes only and does not constitute financial or investment advice. Price projections and scenario analyses reflect analyst estimates and forward-looking assumptions that are subject to material uncertainty. Readers should conduct independent research and consult qualified advisors before making investment decisions.
For ongoing coverage of the Strait of Hormuz situation and its implications for regional energy markets, visit Zawya Energy Coverage.
Want to Stay Ahead of the Next Major Resource Discovery Triggered by Energy Market Volatility?
When geopolitical shocks reshape commodity markets at this speed, identifying the right resource opportunities before the broader market catches on becomes critical — Discovery Alert's proprietary Discovery IQ model delivers real-time alerts on significant ASX mineral discoveries, instantly translating complex data into actionable insights for both traders and long-term investors. Explore how historic discoveries have generated substantial returns by visiting Discovery Alert's dedicated discoveries page, and begin your 14-day free trial today to position yourself ahead of the next major market move.