July 14, 2026
The World's Most Critical Oil Chokepoint Is Now Barely Functioning
Consider a single geographic bottleneck so structurally embedded in the global energy system that no alternative can replace it at scale. A waterway where, under normal conditions, the rhythm of daily vessel movements functions as a real-time pulse reading of geopolitical stability across the world's most consequential energy region. When that pulse flatlines, the consequences extend far beyond the ships caught in the holding pattern.
They ripple through futures markets, refinery schedules, national energy budgets, and the inflation forecasts of economies on three continents. Furthermore, these crude oil price trends signal profound instability that markets struggle to absorb.
That is precisely the situation now unfolding at the Strait of Hormuz, where Strait of Hormuz tanker traffic has collapsed to levels that have no modern equivalent in terms of confirmed, sustained physical disruption.
When big ASX news breaks, our subscribers know first
What Makes the Strait of Hormuz Structurally Irreplaceable
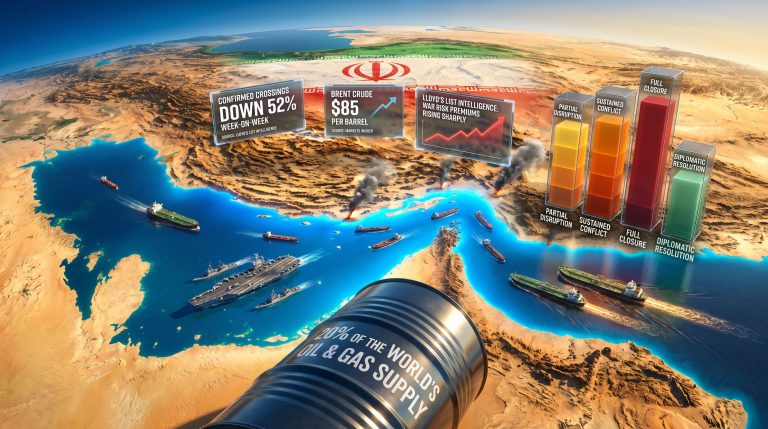
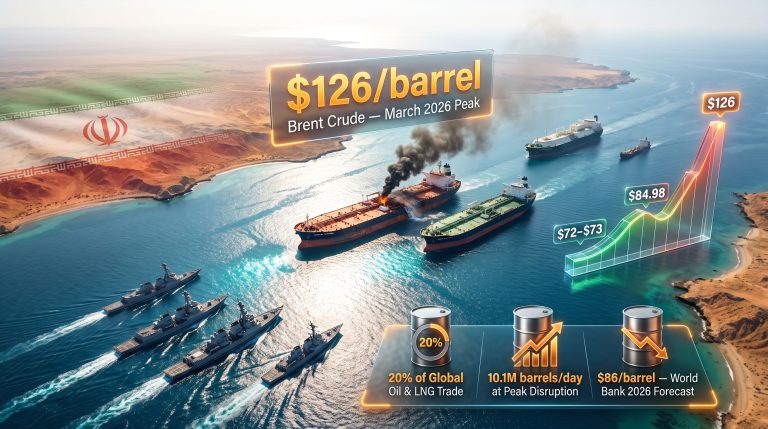
The strait connects the Persian Gulf to the Gulf of Oman at its narrowest navigable point of approximately 21 nautical miles. Despite this compressed geography, the volume of energy passing through it daily under baseline conditions is staggering. Roughly 20% of the world's total oil and LNG supply transits this single waterway, making it the single most consequential chokepoint in the global energy infrastructure.
Under pre-conflict operating conditions, the breakdown of daily vessel movements looked like this:
| Vessel Category | Pre-Conflict Daily Average |
|---|---|
| Oil and gas tankers | ~60 per day |
| All vessel types combined | ~125 to 140 per day |
| Share of global oil and LNG supply | ~20% |
No viable bypass exists that can absorb this volume without severe operational penalties. Saudi Arabia's East-West Pipeline, also known as Petroline, offers limited bypass capacity for Saudi crude specifically, but its throughput ceiling is far below what the strait handles daily. Rerouting via the Cape of Good Hope adds approximately 10 to 15 days to voyage times while dramatically increasing fuel consumption and charter costs.
How Vessel Traffic Functions as a Geopolitical Barometer
One of the less widely appreciated aspects of maritime chokepoint analysis is that commercial shipping operators respond to threat escalation faster, and with more precision, than diplomatic messaging does. War risk insurance underwriters reprice exposure within hours of credible threat signals. Flag-state advisories can immediately alter a vessel's operational parameters.
Ship operators weigh the cost of a war risk premium against the value of a cargo, and make routing decisions accordingly. Consequently, these oil price shocks often manifest in freight markets before they appear in official government communications.
This commercial calculus means that tanker transit data functions as a leading indicator of crisis severity, often moving ahead of official statements from governments involved. The primary data layer analysts use to track this is the Automatic Identification System (AIS), a transponder-based vessel tracking system that broadcasts a ship's position, speed, and heading. When vessels begin disabling these transponders, the data picture degrades, and the uncertainty itself becomes a market variable.
Current Conditions: Transit Data and the Scale of Disruption
The numbers describing the current state of Strait of Hormuz tanker traffic are striking in their severity. Platforms such as Windward AI and others provide maritime analytics that illustrate just how dramatically conditions have deteriorated.
| Metric | Pre-Conflict Baseline | Current Status (July 2026) |
|---|---|---|
| Total daily transits (all vessels) | ~125 to 140 ships | Near zero |
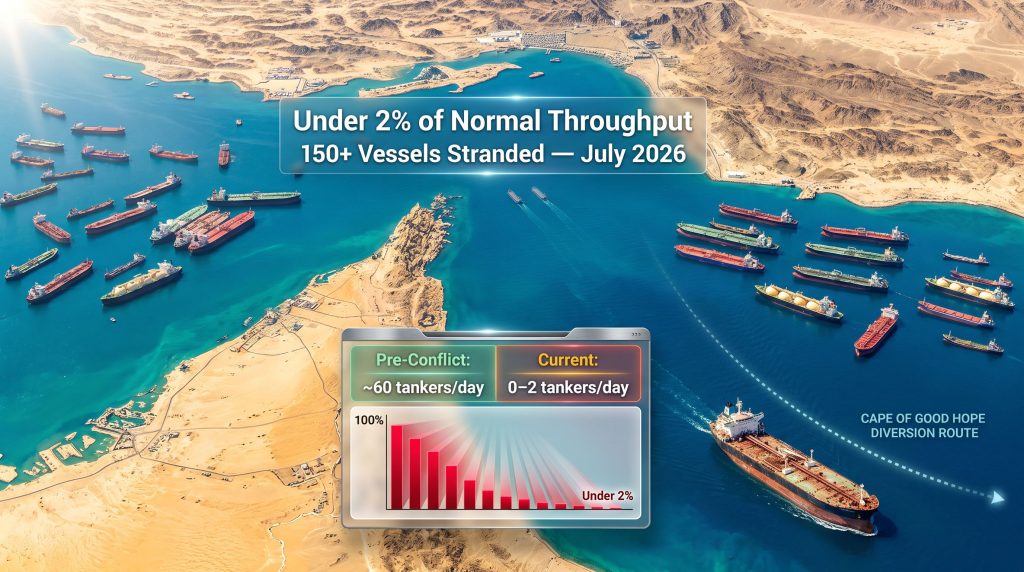
| Oil and gas tankers per day | ~60 | 0 to 2 |
| Daily throughput as % of normal DWT | 100% | Under 2% |
| Vessels stranded in Gulf of Oman and Persian Gulf | 0 | 150+ |
As of July 14, 2026, Kpler analysis confirmed that oil and gas tanker traffic had fallen to its lowest level since May 25, representing the most severe recorded drop in at least two months. By July 9, 2026, transit activity had effectively stalled, with only two tankers recorded as passing through during the early hours of the day.
More than 150 vessels, including crude tankers, bulk carriers, and container ships, remain stranded in holding positions across the Gulf of Oman and Persian Gulf, unable to transit and accumulating demurrage costs that compound daily.
One of the few vessels visibly recorded near the strait's entrance, on the Iranian side of the waterway, was the Sea Faith oil products tanker, which was tracked by LSEG and MarineTraffic data heading toward the Omani port of Sohar. Its presence as an outlier in the data underscores just how empty the waterway has become.
The Dark Shipping Problem: Why Published Figures May Understate Reality
A growing operational trend is complicating the already difficult task of measuring transit volumes accurately. Vessels approaching the strait are increasingly deactivating their public AIS transponders before entering the threat zone, a practice known in maritime analytics as dark shipping. The motivations are straightforward: visible vessels in an active conflict zone present a targeting profile that operators would rather not maintain.
The analytical consequence is significant. Platforms such as Kpler, LSEG, and MarineTraffic derive transit counts from AIS transponder data. When vessels go dark before crossing the strait, they disappear from the dataset entirely, even if they ultimately complete the transit. This means that any published figure for current transit volumes should be understood as a floor estimate, not a definitive count. Tracking tools such as Marine Vessel Traffic's Hormuz tracker illustrate the scale of the data gap in real time.
Critical Analytical Point: When AIS blackouts coincide with active geopolitical escalation, the information vacuum itself functions as a market-moving variable. Uncertainty in vessel tracking data amplifies price volatility beyond the level that confirmed physical supply disruptions alone would justify. Traders price the unknown, not just the known.
This is a meaningful distinction for commodity analysts who rely on vessel tracking data to estimate near-term crude arrivals at refining hubs. Degraded data quality at the input stage increases the probability of forecast errors, which in turn contributes to elevated options market volatility across crude and refined product benchmarks.
A Timeline of Escalation: How the Strait Reached This Point
The path to near-zero transit volumes unfolded across several months, with brief windows of recovery quickly reversed by renewed hostilities.
- The strait was briefly reopened on April 21, 2026, following a period of restricted access.
- Within 24 hours, on April 22, 2026, it closed again, demonstrating how fragile any operational recovery was.
- A partial diplomatic arrangement involving U.S. and Iranian parties in mid-June 2026 facilitated the passage of more than 20 tankers, temporarily lifting daily transits to approximately 40 ships per day.
- This figure remained well below the pre-conflict baseline of 125 to 140 daily transits, but represented a meaningful operational improvement.
- The resumption of U.S. airstrikes on Iranian targets and subsequent Iranian retaliatory actions in the Gulf rapidly erased these gains, driving transit volumes back toward zero.
- As of early July 2026, the strait remains functionally closed to commercial shipping, with no confirmed recovery in sight.
A critical but underappreciated dimension of this situation is the divergence between official government statements and the behaviour of commercial operators. Shipping companies, war risk underwriters, and security consultants are making routing decisions based on threat assessments that frequently diverge from the diplomatic positions being communicated through official channels. The market acts on the commercial calculus, not the diplomatic narrative.
Three Scenarios for Global Energy Markets
Ship broker Gibson, in analysis published coinciding with the current disruption, assessed that a prolonged Hormuz closure combined with already-depleted global inventories creates conditions for meaningfully tighter supply, higher prices, and significant downside risk across tanker markets. This framing positions the current disruption not as a transient shock but as a compounding structural event. In addition, OPEC market influence over production decisions will shape how quickly supply gaps can be partially addressed.
Three distinct scenarios frame the range of possible outcomes:
Scenario 1: Short-Term Disruption (1 to 4 weeks)
- Crude oil prices face upward pressure in the range of $10 to $20 per barrel above baseline
- Strategic petroleum reserve releases from the U.S. and IEA member nations partially offset supply gaps
- Cape of Good Hope rerouting adds 10 to 15 days to voyage times and increases freight costs substantially
- Tanker market dislocation is meaningful but potentially reversible
Scenario 2: Medium-Term Closure (1 to 3 months)
- Global inventory drawdowns accelerate, removing the primary shock-absorbing buffer from the supply system
- The LNG supply outlook for Asia deteriorates sharply as alternative supply sources prove insufficient to compensate
- War risk insurance premiums reach levels that render certain transit routes economically unviable for many operators
- Refinery margin compression begins as feedstock availability tightens across key processing hubs
Scenario 3: Extended Closure (3 or more months)
- Structural supply deficits emerge across multiple commodity classes simultaneously, not limited to crude
- Demand destruction in price-sensitive emerging markets begins to partially offset supply pressure through reduced consumption
- Long-term realignment of energy trade flows accelerates, with geopolitical trade tensions reshaping established supplier-buyer relationships across Asia, Europe, and beyond
Historical Context: The 2026 Closure in Perspective
Hormuz has been threatened and disrupted before, but never with the sustained physical severity now being recorded.
| Event | Year(s) | Duration | Actual Transit Impact | Market Response |
|---|---|---|---|---|
| Iran-Iraq Tanker War | 1984 to 1988 | ~4 years | Significant reduction | Price volatility; military convoy escorts introduced |
| Iranian Closure Threats Post-Sanctions | 2011 to 2012 | Threat only | Minimal physical disruption | $10 to $15/barrel spike on threat language alone |
| Houthi Red Sea Campaign | 2023 to 2024 | Ongoing | ~50% Red Sea volume rerouted | Freight rate surge; Cape rerouting normalised |
| 2026 Hormuz Closure | April to July 2026 | 3+ months (ongoing) | Over 98% throughput reduction | Near-zero transit; 150+ vessels stranded |
The historical record reveals something important for market analysis: in prior episodes, the threat of Hormuz closure generated price responses of $10 to $15 per barrel without any confirmed physical disruption. The 2026 event has produced a confirmed, sustained collapse in actual transit volumes, representing a categorically different scenario from any previous episode in the waterway's modern commercial history.
The Tanker War of the 1980s, which remains the closest historical precedent for physical disruption at this scale, resulted in the introduction of military convoy escorts and eventually a de facto militarisation of commercial transit through the strait. That precedent carries implications for how the current crisis might ultimately be resolved, or prolonged.
The next major ASX story will hit our subscribers first
Asia's Energy Vulnerability and the Importing Nation Risk Profile
The geographic concentration of Hormuz-dependent import exposure creates an asymmetric risk distribution across global economies.
Most exposed importing nations:
- India: Sources a substantial share of its crude imports from Gulf producers whose only viable export route passes through the strait. Indian refiners face both supply availability risk and cost pressure from elevated spot premiums.
- Japan and South Korea: With minimal domestic energy production, both nations face acute LNG and crude supply risks during extended closure periods, with limited ability to substitute alternative supply at equivalent cost.
- China: Possesses strategic petroleum reserves and a more diversified supplier base than most Asian importers, providing a partial buffer, though sustained Gulf supply disruption cannot be fully absorbed by these mechanisms.
Comparatively insulated markets:
- United States: Domestic production capacity provides meaningful insulation from direct supply impact, though global crude price linkages ensure that American consumers and downstream industries are not entirely immune.
- European nations with diversified sourcing: Face secondary exposure through refined product market tightening rather than direct crude supply disruption, though the severity depends heavily on the duration of closure.
Tanker Market Mechanics: Freight Rates, Routing, and Risk Premiums
The commercial response from vessel owners and operators follows a structural logic that produces its own set of market distortions.
Vessels capable of rerouting are choosing the Cape of Good Hope option, absorbing the additional voyage time and fuel cost in exchange for removing war risk exposure. This removes capacity from the effective supply of tanker services available to the market, even though the physical vessels still exist. Tighter effective capacity drives freight rates higher for routes that remain operational.
For operators who do consider a Hormuz transit, the economics require that war risk insurance premiums, security surcharges, and elevated crew risk allowances be recoverable from cargo owners. In practice, this means that any cargo moving through the strait in the current environment carries a significant cost premium embedded in the freight rate, raising the landed cost of crude and refined products for buyers at the receiving end.
The binary nature of this commercial calculus — accept elevated risk or absorb rerouting costs — means that neither option is cost-neutral relative to pre-crisis baselines. Tanker owner profitability is compressed either way.
Frequently Asked Questions: Strait of Hormuz Tanker Traffic
How many tankers normally transit the Strait of Hormuz each day?
Under pre-conflict baseline conditions, approximately 60 oil and gas tankers transit the Strait of Hormuz daily, with total vessel traffic across all categories reaching 125 to 140 ships per day. This volume accounts for roughly 20% of the world's daily oil and LNG supply.
Why are ships turning off their AIS transponders near the Strait of Hormuz?
Vessels deactivate AIS transponders to reduce their visibility to hostile actors in active conflict environments. In the current crisis, this dark shipping behaviour makes accurate real-time transit counts from open-source tracking platforms structurally impossible, meaning published figures represent floor estimates rather than complete counts.
What happens to global oil prices if the Strait of Hormuz remains closed?
A sustained closure drives upward pressure on crude prices through supply tightening, inventory drawdowns, and embedded freight cost increases. Price sensitivity is amplified by the pre-existing depletion of global inventories, which reduces the market's buffering capacity. The magnitude of the price response scales with the duration of the closure and the availability of strategic reserve releases.
How many ships are currently stranded near the Strait of Hormuz?
As of July 2026, more than 150 vessels, spanning oil tankers, bulk carriers, and container ships, are stranded in holding positions across the Gulf of Oman and Persian Gulf, awaiting the ability to transit the strait.
Is there an alternative route for tankers that cannot use the Strait of Hormuz?
The primary alternative is rerouting via the Cape of Good Hope, adding approximately 10 to 15 days to voyage times with substantial increases in fuel and operational costs. Saudi Arabia's Petroline pipeline offers limited bypass capacity for Saudi crude only, and cannot absorb the full volume ordinarily handled by the strait.
Key Takeaways
- Strait of Hormuz tanker traffic has collapsed to under 2% of normal daily throughput as of July 2026, with recorded daily transits of 0 to 2 tankers versus a baseline of approximately 60
- More than 150 vessels remain stranded in surrounding waters, creating a growing backlog with cascading supply chain and demurrage cost consequences
- AIS transponder deactivations are systematically degrading the accuracy of open-source vessel tracking data, introducing an additional layer of uncertainty into supply forecasting models
- Depleted global inventories entering this disruption remove the market's primary shock-absorbing mechanism, amplifying the price sensitivity of each additional day of closure
- Historical precedent confirms that even the threat of Hormuz closure generates $10 to $15 per barrel price responses. The confirmed, sustained physical closure of 2026 represents a fundamentally more severe scenario with no direct modern parallel
- The divergence between official diplomatic messaging and commercial operator behaviour is a defining feature of this crisis, with freight markets, insurance underwriters, and routing decisions acting as the more reliable signal layer
This article contains forward-looking assessments and scenario analysis based on publicly available data as of July 2026. Energy market conditions are subject to rapid change, and nothing in this article constitutes financial, investment, or trading advice. Readers should consult appropriate professional advisers before making decisions based on energy market developments.
Want To Catch The Next Major Mineral Discovery Before The Market Does?
While energy markets grapple with unprecedented supply disruptions, commodity volatility of this magnitude historically creates significant flow-on opportunities across the broader resources sector — and Discovery Alert's proprietary Discovery IQ model scans the ASX in real time to deliver instant alerts on significant mineral discoveries, turning complex data across more than 30 commodities into clear, actionable insights. Explore historic discoveries and their returns to understand the potential, then begin your 14-day free trial at Discovery Alert to position yourself ahead of the market.