July 14, 2026
The Geography of Vulnerability: Understanding Why the Strait of Hormuz Holds the World Hostage
There is a peculiarity in the architecture of global energy markets that rarely receives the attention it deserves during peacetime: the extraordinary degree to which the world's crude oil and liquefied natural gas supply chains converge on a single, narrow passage of water. The Strait of Hormuz attacks and oil prices have become inseparable headlines in 2026, as this passage — measuring roughly 33 kilometres at its narrowest navigable point — functions as the circulatory bottleneck of the global economy. When that bottleneck is threatened, energy markets do not respond gradually. They lurch.
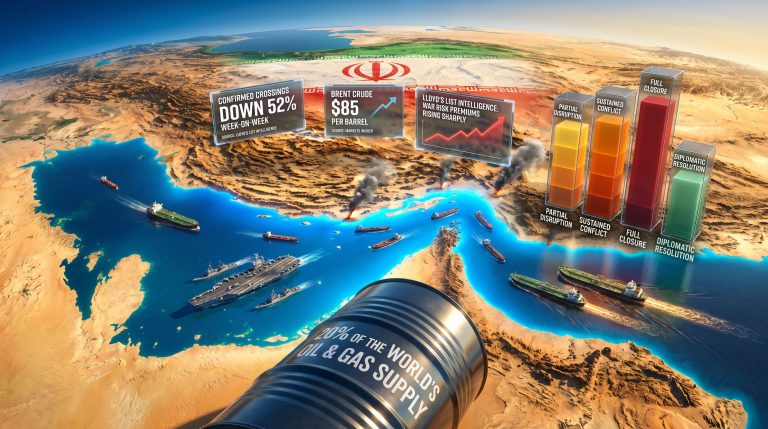
Approximately 20% of all globally traded oil and LNG transits this corridor every single day. That figure encompasses the combined export volumes of Saudi Arabia, Iraq, the UAE, Kuwait, Bahrain, and Qatar. Crucially, no viable pipeline alternative exists at the scale required to compensate for a sustained closure. The East-West Pipeline across Saudi Arabia, the only partial bypass option, has a maximum throughput capacity of around 5 million barrels per day, covering less than half of the strait's typical daily transit volume. For Persian Gulf LNG exporters, no pipeline alternative exists whatsoever.
This structural reality confers an asymmetric form of leverage on any regional actor capable of threatening shipping in the strait. The cost of disruption is borne globally, while the capability to cause that disruption is local. That asymmetry, furthermore, sits at the heart of every geopolitical risk premium currently embedded in crude oil prices. Understanding the crude oil volatility trends that preceded this crisis is essential context for what follows.
When big ASX news breaks, our subscribers know first
A Crisis Measured in Phases: How 2026 Became the Most Volatile Year in Oil Market History
February to March 2026: The Opening Shock
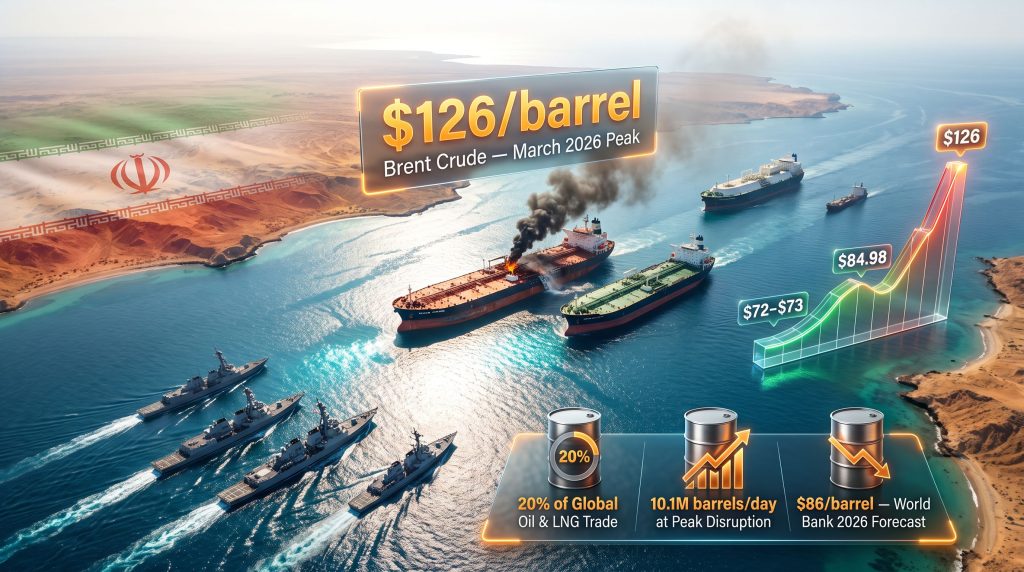
Military strikes conducted by the United States and Israel against Iranian targets in late February 2026 triggered a cascade of consequences that energy markets were structurally unprepared to absorb. Within weeks, Brent crude surged to $126 per barrel in March 2026, representing the largest single-month price increase ever recorded in oil market history. Shipping restrictions through the Strait of Hormuz reached 90% of normal traffic flow, and global oil supply contracted by an estimated 10.1 million barrels per day at peak disruption. To contextualise that volume: it exceeds the entire daily crude production of the United States.
This was not a slow-moving supply shock of the kind seen during the 1973 Arab oil embargo or the 1979 Iranian revolution. The speed of the March 2026 price acceleration was without modern precedent on a monthly basis. Traders, refiners, and governments scrambled simultaneously, creating feedback loops in freight markets, insurance pricing, and spot LNG markets that amplified the initial disruption well beyond what the physical supply shortfall alone would have implied.
June 2026: The Ceasefire That Almost Held
A memorandum of understanding signed on June 17, 2026 temporarily suspended hostilities and offered energy markets a moment of collective exhale. Brent crude retreated sharply toward $72 to $73 per barrel, approaching pre-conflict levels as market participants priced in the possibility of a durable resolution. The US Office of Foreign Assets Control issued licensing permitting limited Iranian crude oil sales, reinforcing the diplomatic framework.
What followed, however, illustrated a fundamental truth about geopolitical risk premiums: they can collapse faster than the underlying conditions warrant, leaving markets poorly positioned for renewed escalation. The oil market disruption risks that analysts had flagged in prior years proved prescient.
July 2026: The Second Escalation and Its Market Consequences
Less than four weeks after the ceasefire MOU was signed, the diplomatic framework unravelled. According to Al Jazeera, Iranian cruise missiles struck two UAE tankers in the southern lane of the Strait of Hormuz, within Omani territorial waters, killing one crew member and injuring eight others. A Qatari LNG tanker was also targeted during the broader escalation. The United States reinstated its naval blockade of Iranian shipping and revoked the OFAC licence permitting Iranian crude exports, effectively eliminating the primary economic incentive structure that had underpinned the ceasefire.
US Central Command confirmed it had commenced a third consecutive night of airstrikes against Iran, with explosions reported at the port city of Bandar Abbas and at Kish Island. Yemen's Houthi movement simultaneously launched missiles at Saudi Arabia, citing retaliation for airstrikes on an airport under its control.
The following table captures the key price movements across the full escalation timeline:
| Event | Date | Brent Crude Price Impact |
|---|---|---|
| Initial US and Israeli strikes on Iran | Late February 2026 | Surge commences |
| Peak price recorded | March 2026 | $126 per barrel |
| Ceasefire MOU signed | June 17, 2026 | Retreats to approximately $72–$73 |
| UAE tanker strikes and US blockade reinstated | July 14, 2026 | Rises to $84.98 |
| Prior session single-day surge | July 13, 2026 | +9.6% (largest daily gain since May 2020) |
Breaking Down the Numbers: What July 14, 2026 Actually Means for Energy Markets
The July 14 session produced the following confirmed market movements:
- Brent crude futures rose $1.68, or 2%, to $84.98 per barrel
- WTI crude advanced $1.65, or 2.1%, to $79.79 per barrel
- The prior session had recorded a 9.6% single-day surge in Brent, its largest daily gain since May 2020
- Prices reached their highest level since the June 17 ceasefire MOU was signed
A critical nuance worth understanding: the July 2026 price level of approximately $84 to $85 per barrel sits roughly 2% above pre-conflict levels, which on its surface suggests partial market resilience. However, the gap between the March 2026 peak of $126 and July levels reflects two distinct forces working in opposite directions: partial supply restoration following the ceasefire, now in tension with renewed military activity and the reimposition of the US naval blockade.
Market analysts have noted that sustained uncertainty, rather than a confirmed physical closure of the strait, is now the primary mechanism driving the risk premium. This is a technically important distinction. It means prices are responding not just to barrels actually removed from the market, but to the probability distribution of future supply scenarios. When that probability distribution shifts rapidly toward worse outcomes, prices overshoot physical fundamentals.
Tim Waterer, chief market analyst at KCM Trade, described the situation as one where the reinstated blockade and Iranian retaliatory responses have clearly injected fresh risk into crude markets, with the competing objectives of both sides creating a highly uncertain supply picture even without a full closure having occurred.
The Four Vectors of Supply Risk: A Structural Threat Analysis
Vector 1: Direct Strait of Hormuz Disruption
The targeting of UAE tankers in Omani territorial waters carries a specific strategic significance that extends beyond the immediate physical damage. By striking vessels flying neutral-flag within another country's territorial waters, Iran demonstrated a willingness to expand the operational geography of the conflict. This has profound implications for shipping operators, insurers, and the governments of non-combatant nations whose vessels transit the corridor.
Even if a new ceasefire were negotiated tomorrow, a less-discussed complication would remain: mine clearance operations. Iranian mining of the strait has historically been part of its asymmetric deterrence toolkit, and any future agreement would require verifiable mine clearance before shipping confidence could be restored. That process, based on historical precedent, can take weeks to months and requires international naval coordination.
Vector 2: The Houthi Dimension and the Dual-Chokepoint Risk
The simultaneous activation of Houthi missile attacks on Saudi Arabia introduces what analysts are calling an unprecedented dual-chokepoint scenario. The Strait of Hormuz handles Persian Gulf crude exports heading east and west. The Red Sea and the Bab-el-Mandeb strait handle a significant portion of Saudi and other Gulf crude exports destined for European markets.
If Houthi operations were to successfully target Saudi crude export infrastructure in the Red Sea, the combined disruption would be of a scale the global energy system has never encountered. Simon Wong, a portfolio manager at Gabelli Funds, has noted that an expansion of Houthi attacks to Saudi crude shipments through the Red Sea would add substantial further uncertainty to regional crude flows, compounding pressures already generated by the Hormuz situation.
Vector 3: The Diplomatic Vacuum
The revocation of the OFAC licence permitting limited Iranian crude sales removes the economic architecture that gave Iran a tangible incentive to maintain the ceasefire. Without that incentive structure, and without the June 17 MOU as an active framework, there is no current mechanism for de-escalation. This absence of a negotiated off-ramp materially increases the probability of a prolonged standoff, which markets are only beginning to price. The broader oil and geopolitics analysis reinforces how rapidly diplomatic vacuums translate into market volatility.
Vector 4: Downstream Inventory Dynamics
A preliminary Reuters poll conducted on July 14, 2026 indicated that US crude oil stockpiles were expected to have declined in the most recent reporting week, whilst gasoline and distillate inventories were forecast to have risen. This creates a mixed demand signal: crude-level drawdowns amplify upward price pressure during supply disruptions, while product inventory builds suggest demand softness that could cap the ceiling on retail fuel prices in the near term.
Modelling the Unthinkable: What a Full Strait Closure Would Mean
The current situation represents a partial disruption scenario. The more consequential analytical question is what a full, sustained closure would look like for global energy balances.
| Scenario | Estimated Supply Removed | Projected Brent Price Range |
|---|---|---|
| Partial disruption (current) | 3–5 million bpd | $80–$90 per barrel |
| Extended partial closure | 6–8 million bpd | $90–$100 per barrel |
| Full closure, sustained | 10+ million bpd | $100–$130+ per barrel |
| Full closure combined with Red Sea disruption | 12+ million bpd | Potentially above $130 per barrel |
Several structural constraints limit the global system's ability to absorb a full closure:
- Strategic Petroleum Reserve capacity: SPR release mechanisms across IEA member countries are estimated to cover a full closure for approximately 30 to 60 days at best before stockpile depletion becomes a binding constraint.
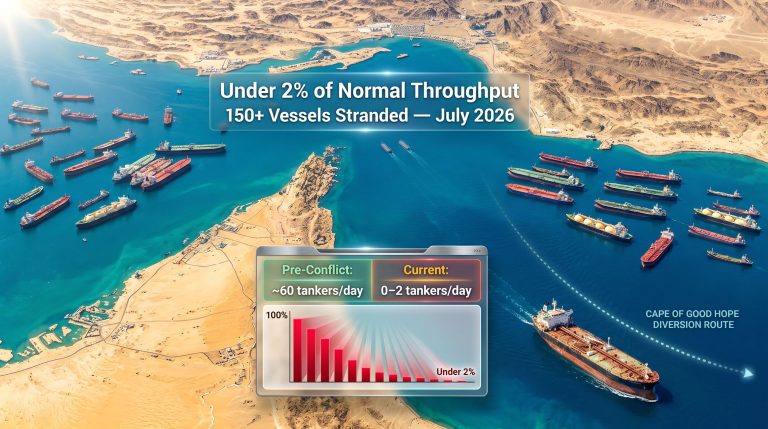
- Alternative routing costs: Rerouting tankers via the Cape of Good Hope adds 10 to 20 days of transit time and significantly elevated freight costs, effectively reducing the available tanker fleet by requiring vessels to spend longer at sea per voyage.
- LNG market vulnerability: Unlike crude oil, LNG has virtually no pipeline alternative for most Asian importers. The global LNG supply outlook makes clear that Qatar's role as the world's largest LNG exporter makes any sustained disruption of Qatari cargo flows an acute risk for European and Asian gas markets simultaneously.
- OPEC+ spare capacity limits: Whilst OPEC members possess spare production capacity, the volumes required to offset a full Hormuz closure exceed what can be physically mobilised within a 30-day window. OPEC market influence in this context is significant but ultimately insufficient to bridge the gap alone.
Beyond Crude: How the Crisis Is Reshaping Adjacent Energy Markets
LNG and European Gas Security
The targeting of a Qatari LNG tanker during the July escalation highlights a vulnerability that receives insufficient attention in mainstream coverage of the Strait of Hormuz attacks and oil prices. Qatar supplies a substantial proportion of European LNG imports, particularly following the structural shift in European energy purchasing patterns since 2022. Any reduction in Qatari LNG cargo flows would pressure European gas storage, particularly heading into northern hemisphere winter planning cycles.
Asian spot LNG prices are particularly sensitive to Qatari supply disruptions given the absence of alternative suppliers capable of filling the volume gap at comparable cost.
Refining Margins and Retail Fuel Prices
Crude price spikes translate into elevated refining input costs within days, not weeks. Refiners operating on thin margins in import-dependent economies face immediate pressure as feedstock costs rise faster than they can pass through to end consumers. India, as one of the world's largest Persian Gulf crude importers, faces particular structural exposure to sustained Hormuz disruption, with implications for domestic inflation, energy subsidy burdens, and the current account balance.
Shipping and Marine Insurance
War risk insurance premiums in the Strait of Hormuz corridor have risen sharply since the July 14 escalation. This creates a de facto capacity reduction even without any formal closure of the strait, as vessel operators reassess route viability and some shipping companies impose voluntary pauses. As reported by CNBC, tanker day rates reflect this elevated risk through premium pricing, adding a secondary cost layer to every barrel that does make it through the corridor.
The next major ASX story will hit our subscribers first
What Forecasters Project: Price Trajectories Through 2026 and Into 2027
The World Bank Baseline
Before the July 2026 escalation, the World Bank projected Brent crude would average $86 per barrel across full-year 2026, declining to approximately $70 per barrel in 2027 as supply conditions normalised. Given that the July events represent a material deterioration relative to the assumptions underpinning that forecast, analysts now treat the $86 figure as a floor rather than a central estimate for 2026 if hostilities persist through the third quarter.
Near-Term Price Scenarios
| Time Horizon | Scenario Assumption | Projected Price Range |
|---|---|---|
| Q3 2026 | Ceasefire restored, partial shipping resumption | $73–$85 per barrel |
| Q3 2026 | Continued low-intensity conflict | $85–$100 per barrel |
| Q3–Q4 2026 | Full closure sustained beyond 60 days | $100–$130+ per barrel |
| 2027 | Diplomatic resolution, supply normalisation | Approximately $70 per barrel |
Important Disclaimer: All price projections referenced in this article represent analyst estimates and institutional forecasts, not guaranteed outcomes. Oil markets are subject to rapid shifts based on geopolitical developments, OPEC+ production decisions, macroeconomic conditions, and demand dynamics. This article does not constitute financial advice.
The Historical Ledger: Placing 2026 in Context
Understanding where the 2026 Hormuz crisis sits within the arc of historical oil supply shocks provides essential perspective:
| Historical Event | Estimated Supply Removed | Peak Price Impact | Duration |
|---|---|---|---|
| 1973 Arab Oil Embargo | ~4.3 million bpd | +400% over 12 months | ~6 months |
| 1979 Iranian Revolution | ~5.6 million bpd | +150% over 12 months | ~2 years |
| 1990 Gulf War | ~4.3 million bpd | +100% over 3 months | ~7 months |
| 2022 Russia-Ukraine conflict | ~3 million bpd | +60% over 3 months | Ongoing |
| 2026 Hormuz Escalation (March peak) | ~10.1 million bpd | +73% from pre-war levels | Ongoing |
Three features distinguish the 2026 event from all prior supply shocks:
- The volume of supply removed at peak disruption is the largest in recorded oil market history, exceeding even the combined impact of the 1973 and 1979 crises.
- The speed of the March 2026 price surge on a monthly basis was without historical precedent.
- The simultaneous activation of the Hormuz and Red Sea chokepoints represents a dual-vector threat that prior oil market frameworks were never designed to model.
Frequently Asked Questions: Strait of Hormuz Attacks and Oil Prices
What percentage of global oil trade passes through the Strait of Hormuz?
Approximately 20% of all globally traded oil and LNG transits the strait daily, making it the most critical single energy chokepoint on earth. No alternative routing option exists at comparable scale for Persian Gulf producers.
Why did oil prices surge so dramatically in March 2026?
US and Israeli military strikes on Iran in late February 2026 triggered a near-shutdown of strait shipping, with traffic restrictions reaching 90% and global supply falling by an estimated 10.1 million barrels per day. Brent crude reached $126 per barrel as markets priced a worst-case closure scenario.
What caused the July 2026 oil price spike?
Iranian cruise missiles struck two UAE tankers in Omani territorial waters. The US simultaneously reinstated its naval blockade of Iran, revoked the OFAC licence permitting Iranian crude sales, and conducted a third consecutive night of airstrikes on Iran. Houthi forces also launched missiles at Saudi Arabia, adding a second dimension to regional supply risk.
Could oil prices reach $100 per barrel again?
Analysts consider a return to $100 or above a credible scenario if the Strait of Hormuz remains significantly disrupted for more than 60 days, particularly if Houthi activity simultaneously restricts Saudi crude exports through the Red Sea corridor.
What is the World Bank's oil price forecast for 2026?
The World Bank projected Brent at an average of $86 per barrel for full-year 2026, falling to approximately $70 per barrel in 2027, contingent on supply normalisation. The July 2026 escalation introduces meaningful upside risk to both projections.
How long could a Strait of Hormuz closure last?
Even following a ceasefire, analysts caution that mine clearance operations, damaged port infrastructure at locations such as Bandar Abbas, and the backlog of stranded cargo could delay full shipping normalisation by several weeks to several months.
Key Takeaways for Energy Market Participants
The Strait of Hormuz attacks and oil prices relationship in 2026 has demonstrated with brutal clarity how rapidly geopolitical frameworks can collapse and how poorly energy market infrastructure is equipped to absorb a shock at the scale of a near-full Hormuz closure. Several structural conclusions stand out:
- The June 17 ceasefire lasted fewer than four weeks before renewed hostilities erased its market impact, illustrating that diplomatic frameworks in this conflict are fragile and rapidly reversible.
- The dual-chokepoint risk combining Hormuz disruption with Houthi Red Sea activity represents a genuinely novel threat that existing strategic reserve systems and rerouting capabilities cannot fully offset.
- War risk insurance premium escalation and voluntary shipping pauses are creating supply reductions that operate independently of any formal strait closure, meaning markets are already absorbing a friction cost that will not disappear quickly even after a ceasefire.
- Investors and energy-dependent businesses should model price scenarios across a range from $73 to $130 or above, depending on the trajectory of US-Iran negotiations and the durability of any future diplomatic agreement.
- The World Bank's $86 per barrel 2026 average, established prior to the July escalation, may now represent a conservative floor rather than a central expectation.
For ongoing analysis of developments in oil and gas markets across the Middle East and Asia, ET EnergyWorld at energy.economictimes.indiatimes.com provides continuous coverage of the geopolitical and market dimensions of this evolving situation.
Want to Stay Ahead of Commodity Market Shifts Driven by Geopolitical Events Like the Strait of Hormuz Crisis?
Discovery Alert's proprietary Discovery IQ model scans ASX announcements in real time, delivering instant alerts on significant mineral discoveries — including those in commodities directly impacted by global energy market volatility — so investors can act on actionable opportunities before the broader market catches on. Explore how historic mineral discoveries have generated substantial returns and begin your 14-day free trial today to position yourself ahead of the market.