
June 15, 2026
The Hidden Signal Driving Aluminium Markets Higher
Most commodity market participants focus on headline prices, but the traders and analysts with the deepest edge in aluminium are watching something far less visible: the steady depletion of metal sitting inside exchange warehouses. When London Metal Exchange inventory levels fall persistently over months, they function as a kind of slow-burning pressure valve for the broader market. The price response is rarely immediate, but when it arrives, it tends to be both broad-based and durable.
That dynamic has been playing out across the aluminium complex through the first half of 2026 in a way that merits careful examination. Understanding why LME aluminium prices rise as stocks decline requires unpacking not just the surface-level price data, but the mechanical, structural, and psychological forces that transform warehouse inventory movements into sustained market repricing events.
When big ASX news breaks, our subscribers know first
The Inverse Relationship Between LME Inventory and Aluminium Pricing
LME warehouses do not simply store metal. They function as the world's buffer inventory for exchange-registered aluminium, and the volume of metal held within them is one of the most closely watched real-time proxies for physical market tightness available to market participants globally.
When stocks rise, it typically signals that supply is outpacing physical demand at prevailing prices. When stocks fall, the opposite is true: physical buyers are pulling metal out of the exchange system faster than producers and traders are depositing it. This drawdown signals genuine consumption pressure, and the LME pricing mechanism responds accordingly. Furthermore, aluminum alumina markets provide important upstream context for understanding why these drawdowns occur in the first place.
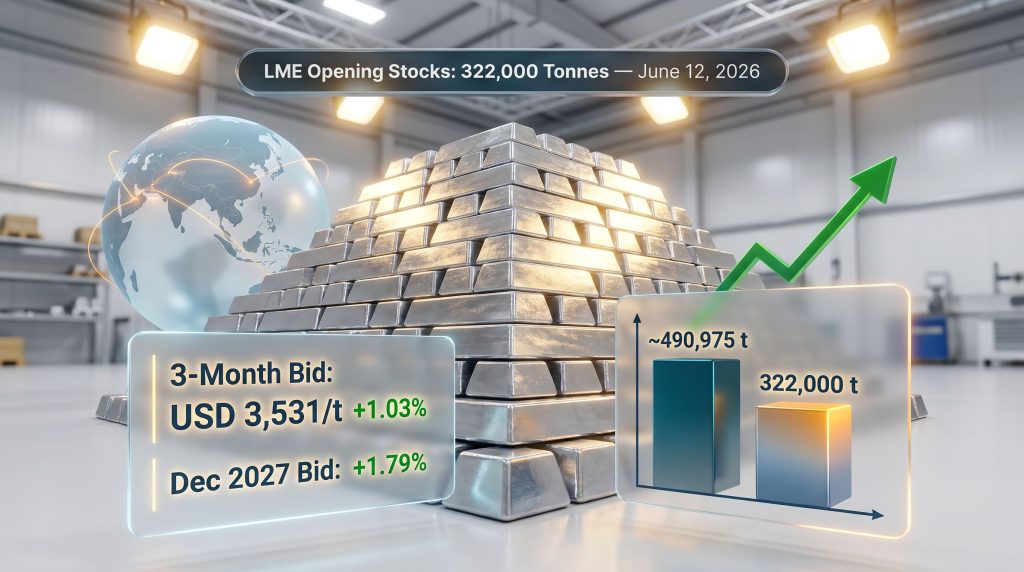
The data from June 12, 2026 captured this dynamic in concentrated form.
Key Price Metrics: June 12, 2026
Across every contract tenor, aluminium prices moved higher in a coordinated fashion. The structure of the gains, however, tells a more nuanced story than the raw numbers alone.
| Contract Type | Previous Session (USD/t) | June 12, 2026 (USD/t) | % Change |
|---|---|---|---|
| Cash Bid | 3,498.00 | 3,535.00 | +1.06% |
| Cash Offer | 3,498.50 | 3,536.00 | +1.07% |
| 3-Month Bid | 3,495.00 | 3,531.00 | +1.03% |
| 3-Month Offer | 3,495.50 | 3,532.00 | +1.04% |
| Dec 2027 Bid | 3,193.00 | 3,250.00 | +1.79% |
| Dec 2027 Offer | 3,198.00 | 3,255.00 | +1.78% |
| Asian Ref. Price | 3,502.00 | 3,535.00 | +0.94% |
The December 2027 forward contract gained approximately 1.79% on the day, nearly double the move recorded in near-term contracts. This divergence is analytically significant: when longer-dated contracts outperform prompt contracts, it indicates the market is pricing in structural tightness well beyond the current inventory cycle rather than a short-term supply blip.
This kind of forward curve repricing is not driven by speculation in isolation. It reflects a genuine shift in how market participants are assessing the medium-term supply-demand balance for primary aluminium. According to LME aluminium price data, these structural shifts are becoming increasingly pronounced across base metal markets.
What Do LME Aluminium Stock Movements Actually Mean for Prices?
The inventory picture behind the June 12 price gains reveals a market that has been tightening for months rather than days.
LME Warehouse Stock Summary: June 12, 2026
| Inventory Category | Previous Session (tonnes) | June 12, 2026 (tonnes) | Change |
|---|---|---|---|
| Opening Stocks | 324,825 | 322,000 | -0.87% |
| Live Warrants | 250,525 | 250,525 | Unchanged |
| Cancelled Warrants | 71,475 | 69,400 | -2.90% |
Each of these three data points carries distinct analytical weight.
Opening stocks represent the total volume of exchange-registered aluminium available within the LME system at the start of the trading session. A decline here confirms that net withdrawals are continuing.
Live warrants are warehouse receipts for metal that remains available for trading and physical delivery. Their stability at 250,525 tonnes across both sessions suggests that while total stocks are falling, the tradeable portion of the inventory has not yet tightened further.
Cancelled warrants represent metal that has been earmarked for imminent physical withdrawal from the exchange system. A decline in cancelled warrants can initially appear to be a softening of withdrawal pressure, but when interpreted alongside falling total stocks, it confirms that earlier cancelled-warrant volumes have already been physically removed and the drawdown pipeline remains active.
The 31% Stock Drawdown Narrative: February to June 2026
A single session's inventory move rarely moves markets on its own. The significance of the June 12 data lies in its position within a much larger drawdown cycle that began in early 2026.
- LME aluminium opening stocks stood at approximately 490,975 tonnes in February 2026, with cash offer prices near USD 3,045 per tonne
- By June 12, 2026, opening stocks had fallen to 322,000 tonnes, a reduction exceeding 31% in roughly four months
- Over the same period, the three-month aluminium price climbed from approximately USD 3,063.50 per tonne toward a four-year high in the weeks surrounding mid-June
This is not coincidence. The sustained pace of inventory drawdown, maintained across multiple consecutive weeks, built the fundamental foundation upon which the 2026 price rally was constructed.
How Physical Market Tightness Translates Into LME Price Premiums
The mechanics of how falling exchange stocks convert into higher prices involve several interconnected steps that experienced traders track closely but that are less well understood by generalist investors.
Step-by-Step: From Stock Decline to Price Rise
- LME warehouse stocks fall as physical buyers withdraw metal faster than new material enters the system
- Spot availability tightens and procurement timelines for physical buyers begin to extend
- Prompt delivery premiums widen as buyers compete for the available metal on shorter delivery windows
- Cash and three-month contracts reprice upward as the market reflects genuine near-term scarcity
- The forward curve steepens as market participants reassess whether structural tightness will persist beyond the current inventory cycle
- Speculative positioning amplifies the move as technical traders and momentum funds layer onto the fundamental signal
Physical tightness in exchange inventories does not operate in isolation. It amplifies existing supply-side constraints — including energy cost pressures, regional output disruptions, and geopolitical risk premiums — to produce outsized price responses relative to the absolute volume of stock movement involved. In addition, US aluminium tariffs have introduced further complexity into how these supply-side signals are being interpreted by market participants.
Understanding Backwardation in Aluminium Markets
One of the more technically sophisticated signals embedded in LME aluminium price data is the cash-to-three-month spread, which indicates whether the market is in contango or backwardation.
- Contango occurs when forward prices exceed spot prices, suggesting ample near-term supply and buyers are not under time pressure
- Backwardation occurs when spot prices trade at a premium to forward prices, signalling that prompt metal is genuinely scarce and buyers need it now
During periods of sustained LME stock drawdown, markets often transition toward backwardation or see existing backwardation deepen. This shift is one of the most reliable forward-looking indicators of genuine physical tightness, and it is precisely the kind of signal that distinguishes structurally supported price rallies from purely speculative ones.
Supply-Side Factors Amplifying the 2026 Aluminium Price Rally
Inventory mechanics explain the timing and structure of the price move, but the scale of the 2026 rally reflects a convergence of supply-side pressures that have collectively raised the structural floor under aluminium prices.
Energy Cost Pressures and Smelter Economics
Aluminium smelting ranks among the most energy-intensive industrial processes on the planet, consuming approximately 14 to 16 megawatt-hours of electricity per tonne of primary metal produced. This energy intensity creates a direct and powerful link between electricity pricing and aluminium production economics.
When power costs rise in key smelting regions, the economics of expanding or even maintaining existing output deteriorate. Producers face a structural dilemma: increase output at margins that may not justify the capital and operating cost, or curtail production and allow the market to tighten further. In 2025 and 2026, rising energy costs in several producing regions contributed to a reluctance to expand smelter capacity, creating a supply response asymmetry that has supported prices.
A less commonly understood aspect of this dynamic is that energy costs create a non-linear cost floor for aluminium. Unlike many commodities where marginal production costs decline as output falls, aluminium smelting requires continuous power draw even when operating at partial capacity. Curtailing a potline is expensive and operationally complex, which means producers are reluctant to reduce output incrementally. The result is that production changes tend to come in large, discrete steps rather than gradual adjustments, making supply responses slower and less finely calibrated than demand shifts.
Geopolitical Risk and the War Premium in Base Metals
Throughout 2025 and into 2026, West Asian supply chain disruptions introduced a geopolitical risk layer into aluminium pricing that went beyond standard supply-demand modelling. Markets began pricing in what traders refer to informally as a war premium: the additional buffer above fundamental value that reflects uncertainty around supply chains passing through or near active conflict zones.
This premium is particularly difficult to quantify precisely because it is psychological as much as it is physical. It reflects the cost of uncertainty rather than confirmed supply loss, and it tends to be sticky: once embedded in prices, it dissipates slowly even as the underlying geopolitical situation evolves. Consequently, commodity volatility hedging strategies have become increasingly important tools for market participants navigating these compounding risk factors.
For aluminium specifically, the war premium has interacted with physical inventory drawdowns to amplify price moves that fundamental analysis alone might have expected to be more modest.
The Alumina Price Signal: What USD 305 Per Tonne Tells Us
One of the more instructive data points from the June 11 and June 12 sessions was the stability of the LME alumina Platts price at USD 305 per tonne across both days. Alumina is the intermediate product refined from bauxite ore and fed directly into aluminium smelters, accounting for approximately 30 to 40% of total primary aluminium production costs.
When alumina prices remain stable while aluminium prices rise, smelter margins expand. This is a double-edged dynamic: improving margins can incentivise producers to restart idled capacity or accelerate planned expansions, which would eventually act as a supply-side counterweight to price gains. However, given the lead times involved in restarting smelter capacity — which typically run to several months at minimum — the near-term price-supportive effect of stable alumina costs dominates.
The alumina-aluminium price relationship is also a useful diagnostic for distinguishing demand-pull rallies from supply-push price events. When both alumina and aluminium prices rise together, it typically signals a demand surge pulling through the entire value chain. When aluminium rises while alumina holds steady or falls, it more often reflects tightness at the exchange inventory level or downstream demand pressure rather than upstream feedstock constraints.
Contextualising the 322,000-Tonne Inventory Position
Understanding whether the current LME stock level represents a genuinely tight market requires historical context that is rarely included in day-to-day price reporting.
How Low Is Low?
LME aluminium inventories have ranged across an extraordinary spectrum over the past two decades:
- During the post-Global Financial Crisis oversupply era, LME aluminium stocks peaked at over 5 million tonnes, creating the notorious warehouse financing deals of the early 2010s
- During periods of acute tightness, stocks have fallen below 200,000 tonnes, representing levels where exchange inventory provided almost no meaningful buffer against sudden supply disruptions
- The current 322,000-tonne position sits significantly closer to the tight end of this historical range
To put this in consumption terms: at current global aluminium consumption rates of approximately 70+ million tonnes per year, the entire LME registered inventory of 322,000 tonnes represents less than two days of global demand. Exchange warehouses are not designed to serve as primary supply buffers, but this ratio underscores just how thin the exchange-level safety net has become.
The Velocity of Drawdown Matters as Much as the Level
A subtlety that separates sophisticated aluminium market analysis from surface-level price commentary is the distinction between inventory levels and inventory velocity. A stock of 322,000 tonnes declining at 3,000 tonnes per day tells a fundamentally different story from the same stock level that has been stable for weeks.
The February-to-June 2026 drawdown of more than 31% within approximately four months implies an average net outflow that was sustained and accelerating rather than episodic. This kind of momentum in inventory reduction is consistent with structural demand outpacing available exchange supply rather than temporary logistics-driven fluctuations. Furthermore, top aluminium producers are watching these velocity signals closely as they inform medium-term capacity decisions.
The next major ASX story will hit our subscribers first
Is the LME Aluminium Price Rally Sustainable? Scenario Analysis
With the three-month price trading around USD 3,531 to 3,532 per tonne as of June 12 and the market having recently reached a four-year high, three broad trajectories are plausible for the second half of 2026.
| Scenario | Key Conditions | Price Implication | Primary Risk |
|---|---|---|---|
| Continued Drawdown | Stocks fall below 300,000t, cancelled warrants rebound | 3M contracts test USD 3,600-3,650/t | Demand softening in construction and automotive sectors |
| Inventory Stabilisation | Drawdown pace slows, forward curve flattens | Consolidation in USD 3,450-3,550/t band | Reduced geopolitical premium, stable alumina costs |
| Macro Headwinds Reverse | USD strengthens, Chinese demand disappoints, energy costs fall | Retracement toward USD 3,200-3,300/t | Chinese ingot destocking acceleration, speculative position unwinding |
Chinese aluminium ingot destocking represents a particularly important monitoring variable for the second half of 2026. At its peak, Chinese ingot social inventory reached approximately 1.47 million tonnes before entering an accelerated pullback phase. The pace and ultimate depth of that destocking cycle will have direct implications for global trade flows and LME price dynamics through the remainder of the year. Indeed, green steel pricing trends are adding a further layer of demand-side complexity, as decarbonisation commitments reshape industrial metal consumption patterns across key end-use sectors.
Price Benchmarks Across the 2026 Cycle
| Period | 3-Month Price (USD/t) | LME Opening Stocks (tonnes) | Market Condition |
|---|---|---|---|
| February 2026 | ~3,063.50 | ~490,975 | Early drawdown phase beginning |
| Mid-June 2026 (peak) | ~3,600+ (estimated) | ~322,000 | Four-year high reached |
| June 12, 2026 | 3,531-3,532 | 322,000 | Post-peak consolidation |
Note: Mid-June 2026 peak price estimates are based on directional analysis of the price trajectory and should be treated as approximate. Past price performance does not guarantee future outcomes. This article does not constitute investment advice.
Frequently Asked Questions: LME Aluminium Prices and Stock Movements
Why do LME aluminium prices rise when stocks fall?
When LME warehouse inventories decline, it indicates that physical buyers are removing metal from the exchange system at a pace that exceeds new deposits. This reduces near-term spot availability, intensifying competition among buyers for prompt delivery and driving cash and three-month contract prices higher. The price response reflects genuine scarcity of exchange-registered metal rather than speculative activity in isolation.
What are cancelled warrants and why do they matter?
A cancelled warrant is a warehouse receipt for metal that has been formally committed for physical withdrawal from an LME facility. Once cancelled, that metal is no longer available for trading within the exchange system and will soon physically leave the warehouse. High cancelled warrant volumes relative to total stocks act as a leading indicator of imminent further inventory drawdown, making them a forward-looking signal that experienced traders monitor closely.
What is the difference between the LME cash price and the three-month price?
The LME cash price reflects the cost of aluminium for immediate delivery, conventionally settled two business days forward. The three-month price covers delivery 90 calendar days out and serves as the global benchmark for physical aluminium contracts. The spread between the two, known as the cash-to-three-month spread, signals whether the market is in contango or backwardation. Transitions from contango to backwardation during inventory drawdown cycles are among the most reliable signals of genuine physical market stress. For a broader perspective, LME aluminium prices and the uncertainties shaping their trajectory have been closely examined in recent industry commentary.
What does the Asian Reference Price represent?
The LME aluminium three-month Asian Reference Price is a regionally calculated benchmark derived from the same underlying LME contract but computed during Asian trading hours. It serves as the primary pricing reference for physical aluminium transactions across Asia-Pacific supply chains, where the majority of global aluminium fabrication and end-use demand is concentrated. Its convergence with or divergence from the London-session price reflects regional demand conditions and arbitrage dynamics.
How does alumina pricing relate to aluminium price movements?
As the direct feedstock for aluminium smelting, alumina represents roughly 30 to 40% of primary production costs. Stable alumina prices alongside rising aluminium prices expand smelter margins, which over time can incentivise output increases. However, the multi-month lead times required to restart or expand smelter capacity mean that margin improvement does not translate into immediate supply response. In the short term, stable alumina pricing during an aluminium rally is broadly price-supportive because it reduces the urgency of the supply response.
Key Takeaways From the June 12, 2026 LME Data
The data from this single trading session, when placed within its broader inventory and price context, delivers several analytically significant messages.
- Price gains were broad-based across all contract tenors, confirming the rally reflects structural reassessment rather than narrow prompt-market speculation
- The December 2027 forward contract's outperformance (+1.79% versus +1.03% for near-term contracts) signals that the market expects tightness to persist well into the medium term
- A 31%+ inventory drawdown from early 2026 levels has materially reduced the physical buffer within the LME system, creating the supply conditions that underpin sustained price support
- Alumina price stability at USD 305 per tonne simultaneously supports smelter margins and reduces the risk of demand destruction at current aluminium price levels
- Geopolitical and energy cost pressures are functioning as compounding amplifiers on top of the inventory-driven fundamental signal, helping explain why LME aluminium prices rise as stocks decline by a greater magnitude than raw stock movements alone might suggest
- Chinese ingot destocking dynamics remain a critical variable to monitor, given their capacity to alter global trade flows and LME inventory trajectories in the second half of 2026
This article is intended for informational purposes only and does not constitute financial or investment advice. Commodity markets involve significant risk and past price trends do not guarantee future performance. Readers should conduct their own due diligence before making investment decisions.
Want To Capitalise on the Next Major Commodity Discovery Before the Market Catches On?
The same inventory-driven tightness reshaping aluminium markets highlights how quickly commodity dynamics can shift — and how critical it is to receive real-time intelligence the moment a significant discovery is announced. Discovery Alert's proprietary Discovery IQ model instantly scans ASX announcements across 30+ commodities, delivering actionable alerts to subscribers before the broader market reacts; explore historic discoveries and their returns to see what early positioning can mean, then begin your 14-day free trial at Discovery Alert to secure your market-leading edge.