July 20, 2026
When Input Costs Rise and Output Prices Fall: Decoding the Aluminium Value Chain Split
Few situations expose the structural complexity of commodity markets quite like a divergence between a raw material and its finished derivative. In metals, this phenomenon is relatively rare, yet when it does occur, it tends to carry meaningful signals about where the market is heading. The aluminium value chain is currently experiencing precisely this kind of split, with LME aluminium prices slip and alumina Platts price rises becoming the defining headline of mid-July 2026 trading sessions.
Understanding why these two benchmarks are moving in opposite directions requires looking beyond simple supply-and-demand narratives. Furthermore, it demands a closer look into the mechanics of how aluminium is actually produced, traded, and priced across different stages of its production journey.
When big ASX news breaks, our subscribers know first
The Architecture of Aluminium Pricing: Two Markets, One Value Chain
Aluminium does not arrive at a smelter as a finished metal. It begins as bauxite ore, which is refined into alumina (aluminium oxide) through the Bayer process, and only then is it smelted into primary aluminium metal via electrolytic reduction. This means there are effectively two separate commodity markets operating within a single production chain.
The LME aluminium price reflects the value of finished primary metal, heavily influenced by exchange warehouse inventories, downstream industrial demand, and macroeconomic sentiment. The Platts alumina benchmark, assessed by S&P Global Commodity Insights, reflects the spot value of alumina, responding to refinery capacity, energy costs, and the procurement behaviour of smelters.
When these two markets move in the same direction, the value chain functions in relative equilibrium. When they diverge, however, it typically signals a structural imbalance building between the refining and smelting stages of production. Monitoring aluminium and alumina markets helps contextualise why such divergences occur and what they might mean for producers.
What Is Driving the Softness in LME Aluminium Prices?
The Role of Rising Exchange Inventories in Suppressing Aluminium Valuations
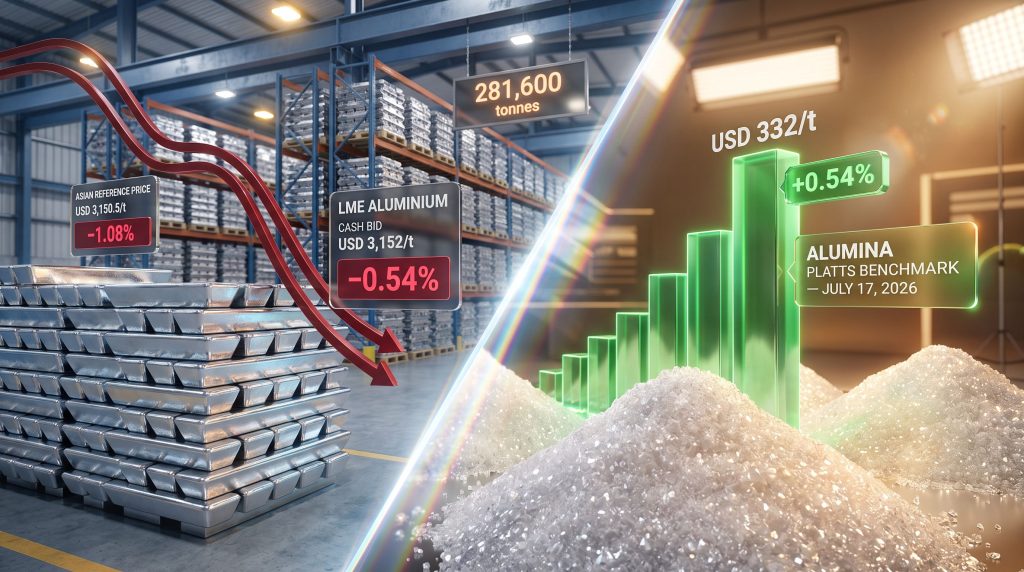
On July 17, 2026, LME aluminium opening stocks fell modestly to 281,600 tonnes from 283,100 tonnes the prior session, a decline of 0.53%. While this represents a marginal reduction, the absolute level of warehouse stocks remains elevated enough to exert persistent downward pressure on pricing sentiment across the forward curve.
Cancelled warrants, which represent metal that has been claimed for physical delivery out of LME warehouses, declined from 35,700 tonnes to 34,200 tonnes, a 4.20% decrease. This reduction is significant because it suggests fewer buyers are actively drawing down stocks for physical use. Live warrants held steady at 245,900 tonnes, a figure that underscores the continued availability of supply relative to active consumption signals.
A high ratio of live-to-cancelled warrants is a well-established indicator of excess available supply relative to near-term demand, and it consistently reinforces bearish positioning among institutional traders.
Price Deterioration Across the LME Aluminium Forward Curve
Weakness on July 17 was not confined to the cash market. Every tenor across the LME aluminium forward curve registered a decline:
| Contract Tenor | Bid Price (July 16) | Bid Price (July 17) | Change |
|---|---|---|---|
| Cash | USD 3,169/t | USD 3,152/t | -0.54% |
| 3-Month | USD 3,166/t | USD 3,146/t | -0.63% |
| December 2027 | USD 3,100/t | USD 3,077/t | -0.74% |
| Asian Reference (3M) | USD 3,185/t | USD 3,150.5/t | -1.08% |
The pattern here tells an important story. The steeper the contract tenor, the larger the percentage decline. The December 2027 contract fell by 0.74%, while the cash price dropped a more moderate 0.54%. This kind of term structure behaviour, where longer-dated contracts fall faster than near-term ones, is a classic bearish signal. It indicates that forward participants are pricing in deteriorating demand conditions over the medium term, not simply reacting to a one-session inventory fluctuation.
Why Is the Asian Reference Price Leading the Decline?
The LME aluminium three-month Asian Reference Price recorded the sharpest single-session move at -1.08%, settling at USD 3,150.5 per tonne. This benchmark is calculated specifically to reflect market conditions during Asian trading hours, giving it relevance as a real-time indicator of physical demand in the Asia-Pacific region.
The acceleration of this decline beyond Western benchmarks points to subdued industrial consumption from key manufacturing economies across the region. Consequently, persistent softness in manufacturing purchasing manager indices (PMIs) has been reducing aluminium offtake from automotive, construction, and packaging sectors. China industrial demand trends have played a particularly prominent role in compounding inventory accumulation at the exchange level.
Why Is Alumina Platts Pricing Rising While Aluminium Falls?
Supply-Side Constraints Pushing Alumina Benchmark Prices Higher
While aluminium weakened, the Platts alumina benchmark moved in the opposite direction. On July 17, the LME alumina Platts price increased from USD 330.2 per tonne to USD 332 per tonne, a gain of 0.54%.
This upward movement is being driven by supply-side dynamics operating independently of downstream aluminium demand. Key structural drivers include:
- Refinery outages and capacity disruptions reducing available alumina volumes in the spot market
- Elevated energy input costs, which are compressing refinery margins and limiting the incentive to expand production
- Competitive smelter procurement behaviour, as aluminium producers compete for available alumina volumes in a tight spot market
- Logistical constraints affecting bauxite-to-refinery supply chains in certain producing regions
It is worth noting that alumina pricing tends to have a lower public profile than LME aluminium, yet it is arguably a more sensitive leading indicator of smelter economics. Historically, sharp moves in the alumina-to-aluminium price ratio have preceded significant adjustments in primary production capacity.
The Historical Context: Alumina-to-Aluminium Price Ratio Dynamics
| Period | Alumina as % of LME Aluminium Price | Market Condition |
|---|---|---|
| Pre-2024 baseline | ~13% | Oversupplied alumina market |
| Q3 2024 | ~16% (spot at USD 455/mt) | Supply disruption-driven spike |
| July 17, 2026 | ~10.5% (USD 332 vs USD 3,152) | Moderate tightness, directional divergence |
The current ratio of approximately 10.5% sits below longer-term historical norms, suggesting alumina has room to move higher before smelter procurement patterns are severely disrupted. However, the direction of travel matters as much as the absolute level, and the simultaneous weakening of aluminium adds complexity to how smelters respond.
The Smelter Margin Squeeze: A Mechanism That Reshapes Supply
Reading the Value Chain: When Input Costs Rise and Output Prices Fall
The combination of rising alumina costs and falling aluminium prices creates a textbook margin compression scenario for primary aluminium smelters. Smelters purchase alumina as their primary feedstock and sell finished aluminium metal, meaning their profitability is directly exposed to the spread between these two benchmarks.
When this spread narrows or inverts, the historical market response tends to follow one of two paths:
- Smelter curtailments occur as uneconomic producers reduce or halt output, eventually tightening the aluminium supply side and providing a floor under prices
- Alumina price correction follows if aluminium weakness is sustained long enough to cause smelters to reduce procurement volumes, easing demand pressure on the refining side
Both outcomes effectively act as self-correcting mechanisms within the value chain, but the timing and severity of each depends on the depth of margin compression and the financial resilience of individual producers. The top aluminium producers globally tend to have greater resilience during these periods due to their vertically integrated operations.
Short-Term vs. Long-Term Implications of the Price Divergence
| Timeframe | Aluminium Outlook | Alumina Outlook |
|---|---|---|
| Short-term (0-3 months) | Continued softness as inventories remain elevated | Sustained firmness if supply disruptions persist |
| Medium-term (3-12 months) | Potential floor formation if smelter curtailments accelerate | Gradual normalisation as refinery capacity recovers |
| Long-term (1-3 years) | Demand recovery tied to energy transition infrastructure | Structural tightness possible if bauxite supply constraints emerge |
Macro and Sector Events Shaping the Current Pricing Environment
The mid-July 2026 price configuration did not emerge in isolation. Several proximate events have shaped the trajectory of both benchmarks over recent weeks:
- In early July 2026, geopolitical uncertainty temporarily lifted aluminium prices by approximately 0.71% before inventory accumulation reversed that momentum
- Around July 10, 2026, a major Gulf-region aluminium producer restarted an alumina refinery, signalling a production ramp-up that contributed to a 1.8% single-session price decline
- Ongoing uncertainty in global trade policy continues to dampen capital expenditure decisions among large industrial aluminium consumers, reducing forward purchasing activity
These events illustrate how event-driven volatility layers on top of structural conditions. Furthermore, global industrial output trends confirm that short-term price spikes generated by geopolitical news tend to be absorbed back into the prevailing trend when underlying inventory and demand fundamentals remain unchanged.
The next major ASX story will hit our subscribers first
A Lesser-Known Dynamic: The Bauxite Quality Factor in Alumina Pricing
One aspect of alumina pricing that rarely receives mainstream attention is the role of bauxite grade variability in determining refinery output efficiency and cost. Not all bauxite is equal. Higher-gibbsite-content bauxite requires less energy to refine into alumina than boehmite or diaspore-bearing bauxite, which demands higher digestion temperatures and greater energy input.
When refinery operators face elevated energy costs, the effective cost of processing lower-grade bauxite increases disproportionately. This creates a tiered cost structure within the global alumina refining industry, where refineries processing lower-quality bauxite face margin pressure far earlier than those with access to premium-grade feedstock. This cost asymmetry is one underappreciated reason why alumina spot prices can move sharply even when bauxite supply volumes appear broadly adequate.
How LME Warrant Structures Drive Price Discovery
Decoding the Live and Cancelled Warrant Relationship
For investors and traders less familiar with LME mechanics, the warrant structure deserves explanation. According to Trading Economics aluminium data, understanding the mechanics behind exchange pricing requires unpacking these structures carefully:
- Live warrants represent aluminium stored in LME-approved warehouses that is available for immediate delivery to buyers holding ownership certificates
- Cancelled warrants represent metal that has been earmarked for physical removal from LME storage, typically reflecting a buyer taking delivery for industrial use
- When cancelled warrants fall (as they did to 34,200 tonnes on July 17), it signals that fewer industrial buyers are drawing metal from exchange storage for active use
- When live warrants remain stable at 245,900 tonnes, it confirms that metal is not being depleted from the system at a pace that would reduce available supply
The key insight for price direction is not simply the total inventory level but the ratio and rate of change between live and cancelled warrants. A declining cancelled warrant figure alongside stable live warrants is a reliable signal that physical demand is not accelerating, which historically correlates with continued price weakness.
Frequently Asked Questions: LME Aluminium and Alumina Platts Pricing
What Is the LME Aluminium Cash Price and How Is It Determined?
The LME aluminium cash price represents the spot settlement price for primary aluminium delivered immediately, determined through trading activity on the London Metal Exchange. It reflects real-time supply and demand dynamics, warehouse inventory levels, currency movements, and broader macroeconomic sentiment.
Why Do Aluminium and Alumina Prices Sometimes Move in Opposite Directions?
The two benchmarks respond to different sets of fundamentals. LME aluminium pricing is shaped by finished metal inventory levels, industrial consumption trends, and forward sentiment. Alumina pricing responds to refinery capacity, energy costs, bauxite feedstock availability, and smelter procurement behaviour. When these factors pull in opposing directions simultaneously, both benchmarks can diverge within the same trading session, as occurred on July 17, 2026.
What Does a Steeper Decline in Long-Dated Contracts Signal?
A larger percentage decline in long-dated futures relative to the cash price is typically interpreted as a bearish structural signal. On July 17, the December 2027 contract fell 0.74% compared to the cash price decline of 0.54%, indicating that forward market participants are pricing in sustained demand weakness through the medium term rather than treating the session's move as a short-term correction.
How Does the LME Asian Reference Price Differ from the Standard Three-Month Contract?
The LME Asian Reference Price is a daily benchmark calibrated to reflect trading conditions during Asian market hours. It is used widely by physical traders and smelters in the Asia-Pacific region as a regionally relevant pricing reference. Its sharper decline of 1.08% on July 17 pointed to particularly weak demand signals from Asian industrial buyers, reinforcing the broader bearish picture for aluminium consumption.
Key Takeaways: What the July 17 Data Reveals About Market Direction
The July 17 session delivered a clear message across multiple data points. In addition, understanding commodity price impacts on producers helps frame the broader significance of these movements. Synthesising the key signals:
- LME aluminium prices weakened across every contract tenor, with long-dated futures declining faster than spot, confirming medium-term bearish positioning
- The Asian Reference Price led the decline at -1.08%, reflecting weaker regional industrial demand in Asia-Pacific markets
- Alumina Platts pricing rose counter-cyclically by 0.54% to USD 332 per tonne, driven by supply-side constraints at the refinery level rather than demand growth
- LME warehouse stocks remain elevated at 281,600 tonnes, with declining cancelled warrants confirming subdued physical offtake
- Smelter margin compression is building, as LME aluminium prices slip and alumina Platts price rises simultaneously, creating the conditions that historically precede either production curtailments or alumina price corrections
Disclaimer: This article is intended for informational purposes only and does not constitute financial or investment advice. Commodity price forecasts and market projections involve significant uncertainty and should not be relied upon as the sole basis for investment decisions. Past price relationships and market patterns do not guarantee future outcomes.
Want to Stay Ahead of Significant ASX Mineral Discoveries Before the Broader Market?
Discovery Alert's proprietary Discovery IQ model delivers real-time alerts on high-potential ASX announcements across more than 30 commodities — including aluminium and alumina-related plays — translating complex mineral data into clear, actionable investment insights for traders and long-term investors alike. Explore historic discoveries and the substantial returns they have generated, then begin your 14-day free trial at Discovery Alert to position yourself ahead of the next major market-moving announcement.