May 13, 2026
The Hidden Architecture of Aluminium Pricing: What Forward Curves and Warehouse Data Really Tell You
Most commodity price headlines focus on a single number: the spot price. Yet for professional participants in the aluminium market, a solitary cash offer figure tells only a fraction of the story. The real intelligence sits in the architecture surrounding that number — specifically the shape of the forward curve, the behaviour of exchange inventories, the spread between upstream and downstream pricing, and the regional pricing signals embedded in Asian reference benchmarks. When all of these layers are read together, a session where the LME aluminium cash offer slips to $3,639.5 per tonne can carry meaningful signals about where the market is heading over weeks and months.
When big ASX news breaks, our subscribers know first
Understanding the LME Pricing Ecosystem Before Reading the Numbers
The London Metal Exchange operates as the world's primary benchmark for base metal pricing, and aluminium is one of its most actively traded contracts. Before interpreting any single session's data, it is worth understanding the distinct roles played by different contract types.
The cash offer is the price at which sellers commit to immediate delivery of exchange-grade aluminium. It is the most responsive contract to intraday supply and demand signals, making it the most volatile across short time horizons. The cash bid is the corresponding price at which buyers are willing to accept immediate delivery. The spread between the two, known as the bid-ask spread, reflects market liquidity conditions: tight spreads indicate competitive, liquid markets, while widening spreads signal reduced dealer participation or stress.
Forward contracts, such as the LME 3-month and longer-dated contracts like December 2027, incorporate expectations about future supply, demand, and cost dynamics. They tend to absorb single-session volatility less severely than cash prices because they reflect multi-month or multi-year equilibrium expectations rather than immediate order-flow imbalances.
The LME 3-month Asian Reference Price is a regionally adjusted benchmark derived from LME pricing but calibrated to reflect supply and demand conditions across Asian time zones. This benchmark is particularly influential for physical offtake decisions across Southeast Asia, Japan, South Korea, and China's import-dependent regions. Furthermore, it frequently acts as a directional precursor to broader LME complex movements.
Understanding these mechanics is foundational to correctly interpreting what the LME aluminium cash offer slips to $3,639.5 per tonne data point on May 12, 2026 actually signals.
A Complete Price Breakdown: May 12, 2026 Session Data
The May 12 session produced a uniform but differentiated decline across the LME aluminium complex. Every contract tier moved lower, however the magnitude of decline varied considerably by maturity and by regional benchmark.
| Contract | May 11 Level (USD/t) | May 12 Level (USD/t) | Change (USD/t) | Change (%) |
|---|---|---|---|---|
| Cash Bid | $3,654.00 | $3,639.00 | -$15.00 | -0.41% |
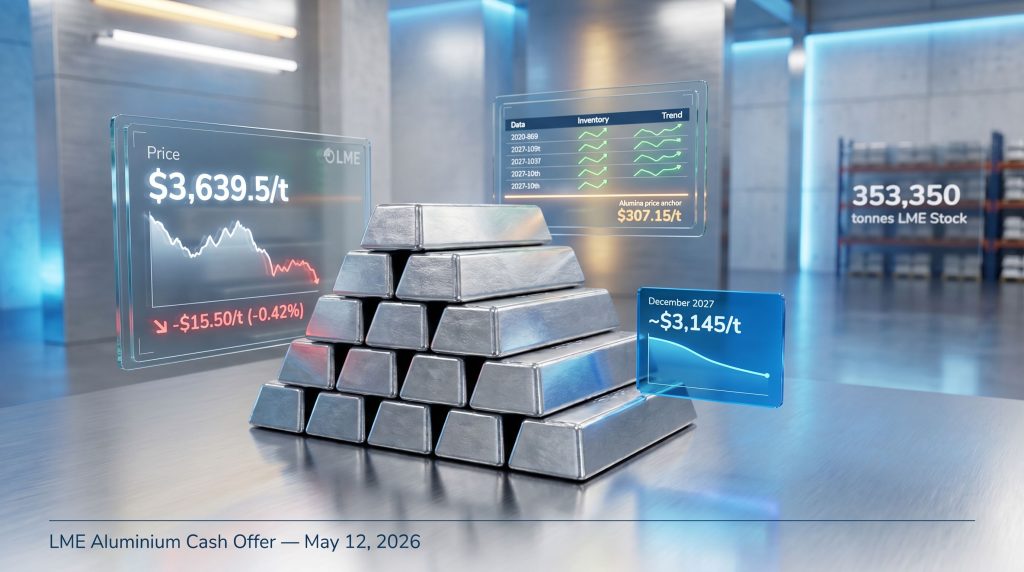
| Cash Offer | $3,655.00 | $3,639.50 | -$15.50 | -0.42% |
| 3-Month Bid | $3,570.00 | $3,565.50 | -$4.50 | -0.13% |
| 3-Month Offer | $3,571.00 | $3,566.00 | -$5.00 | -0.14% |
| Dec 2027 Bid | $3,153.00 | $3,145.00 | -$8.00 | -0.25% |
| Dec 2027 Offer | $3,158.00 | $3,150.00 | -$8.00 | -0.25% |
| Asian Ref. Price | $3,579.50 | $3,562.00 | -$17.50 | -0.49% |
Several features of this data deserve close attention.
First, the bid-ask spreads held at $0.50/t across both cash and 3-month contracts. In distressed or illiquid markets, these spreads typically widen significantly, sometimes reaching $1–$3/t or beyond. The maintenance of tight $0.50/t spreads despite a 0.42% decline in the cash offer is a strong indicator that the session decline was orderly and that dealer participation remained consistent.
Second, the volatility hierarchy across maturities is instructive. Cash contracts declined 0.41–0.42%, the 3-month contracts declined just 0.13–0.14%, and the December 2027 contracts declined 0.25%. Under normal conditions, shorter-dated contracts should exhibit the highest volatility relative to long-dated ones. The December 2027 contract's intermediate position is consistent with a mild reassessment of medium-term supply expectations without any fundamental repricing of the long-term demand outlook.
Third, and perhaps most critically, the Asian Reference Price posted the largest percentage decline of any tracked contract at -0.49%, exceeding even the cash offer's -0.42% move. This anomaly deserves dedicated analysis.
Why Does the Asian Reference Price Decline Matter Most?
When a regionally adjusted benchmark declines more sharply than the global cash price, the difference carries a specific message: regional physical demand conditions are softer than the global average at that moment. A -0.49% move in the Asian Reference Price against a -0.42% cash offer decline implies that Asian buyers were pulling back from the market with greater conviction than their global counterparts.
This is significant for several reasons. Asian markets account for the majority of global primary aluminium consumption, with China alone producing and consuming over half of global output. Softness in Asian reference pricing can precede reductions in physical procurement by downstream fabricators, packaging producers, and automotive component manufacturers across the region. Consequently, when the Asian Reference Price leads the broader complex downward, market participants should treat it as a potential early signal rather than a lagging confirmation.
It is worth noting, however, that a single session's data point does not constitute a trend. The -0.49% move needs to be monitored across subsequent sessions to determine whether it represents the beginning of regional demand deterioration or simply a one-day positioning adjustment in Asian trading hours. Furthermore, China industrial demand trends remain a key variable in interpreting whether Asian benchmark softness signals a broader structural shift.
The Forward Curve Structure and What It Reveals
A key but often overlooked analytical tool in aluminium trading is the shape of the forward curve. On May 12, 2026, the LME aluminium forward curve was in contango, meaning forward prices were trading below the spot cash price rather than above it.
- Cash offer: $3,639.50/t
- 3-month offer: $3,566.00/t (a discount of $73.50/t to cash, or -2.0%)
- December 2027 offer: $3,150.00/t (a discount of $489.50/t to cash, or -13.4%)
This contango structure carries specific interpretive weight:
A contango market in aluminium typically signals that near-term supply is adequate relative to immediate demand. Holders of physical metal face storage costs while waiting for higher forward prices, which creates a natural deterrent to hoarding. The result is orderly physical market function and reduced pressure on spot prices from artificially constrained supply.
The steepness of the contango is equally informative. A $489.50/t discount on the December 2027 contract relative to the cash offer represents a 13.4% implied depreciation over approximately 19 months. Market participants pricing this spread are essentially forecasting that the combination of production cost normalisation, potential demand growth moderation, and capacity additions will bring long-term equilibrium prices back toward the $3,100–$3,200/t range.
This creates an interesting tension with the structural demand arguments for aluminium. If the green energy transition, electric vehicle adoption, and grid infrastructure investment are as powerful as widely projected, one would expect December 2027 contracts to be pricing closer to or above current spot levels, not $490/t below them. This gap may reflect either that the market is discounting long-term structural demand too aggressively, or that participants have factored in substantial new production capacity entering service before late 2027 that will offset demand-side tailwinds.
LME Inventory Movements: The Warehouse Signals on May 12
Exchange warehouse inventories are among the most direct real-time indicators of physical market balance available to aluminium market participants. On May 12, three distinct inventory metrics provided a nuanced picture.
Inventory Snapshot – May 12, 2026
LME opening stock: declined from 355,775 tonnes to 353,350 tonnes, a reduction of 2,425 tonnes (-0.68%).
Cancelled warrants: fell from 21,625 tonnes to 19,275 tonnes, a reduction of 2,350 tonnes (-10.9%).
Live warrants: held unchanged at 331,725 tonnes.
Cancelled Warrants: A Closer Look at Physical Demand Signals
Understanding cancelled warrants is essential for reading warehouse data correctly. A cancelled warrant represents metal that has been formally earmarked for physical removal from an LME-registered warehouse. The process works as follows:
- Metal arrives at an LME warehouse and receives a live warrant, confirming it as exchange-deliverable inventory.
- When a buyer wishes to physically remove metal, they cancel the warrant, converting it from live (tradeable) to cancelled (committed for delivery).
- Once cancelled, the metal is scheduled for departure, typically within a defined window of days.
- After physical removal, the cancelled warrant ceases to appear in LME inventory statistics.
A rise in cancelled warrants therefore signals increasing physical demand, as more buyers are committing to remove metal from the exchange system. A decline in cancelled warrants, as seen on May 12 (-10.9%), suggests that the pace of physical removals is slowing. In addition, this could indicate:
- Buyers have temporarily paused procurement, waiting for lower prices or clearer demand signals
- Physical orders have been satisfied in prior sessions and the pipeline is temporarily empty
- Regional demand conditions have softened enough that fabricators and downstream consumers are drawing on existing inventory rather than procuring fresh exchange metal
The -10.9% single-session drop in cancelled warrants is the most notable inventory signal from the May 12 session. It partially explains the softness in the Asian Reference Price, as a pause in Asian procurement would simultaneously reduce cancelled warrants and pressure the Asian Reference Price benchmark.
The Six-Week Inventory Context
The May 12 reading does not occur in isolation. Placing it within the trajectory of 2026 inventory movements provides critical context.
| Period | Cash Settlement (USD/t) | LME Stocks (tonnes) | Notable Context |
|---|---|---|---|
| January 22, 2026 | ~$3,093.50 | ~497,000 | Post-holiday demand softness |
| March 11, 2026 | ~$3,467.00 | ~452,000 | Supply tightening begins |
| April 1, 2026 | – | 414,175 | Inventory drawdown accelerates |
| April 23, 2026 | $3,642.00 | 378,825 | Near-term price peak zone |
| April 24, 2026 | $3,685.00 | 376,275 | Cycle high for Q2 2026 |
| May 1, 2026 | $3,584.00 | 364,725 | Post-peak consolidation |
| May 8, 2026 | $3,560.50 | 355,775 | Continued inventory draw |
| May 11, 2026 | $3,655.00 | 353,350 | Recovery before May 12 dip |
| May 12, 2026 | $3,639.50 | ~350,925* | Softer session, minor pullback |
Estimated based on warrant cancellation data
From approximately 414,000 tonnes in early April to roughly 353,000 tonnes by mid-May, LME aluminium stocks declined by approximately 61,000 tonnes over six weeks, a reduction of around 14.7%. This is a meaningful drawdown by historical standards and reinforces the interpretation that fundamental demand for physical metal remains active, even if a single session's warrant cancellation data showed a pause.
Historically, sustained LME inventory drawdowns of this magnitude, when accompanied by relatively stable production costs, have tended to provide a price floor during softening sessions. A threshold level worth monitoring is 300,000 tonnes. If LME aluminium stocks were to decline toward or below this level, the available pool of exchange-deliverable metal would tighten sufficiently to create acute short-term scarcity premiums, potentially pushing the cash offer sharply above the $3,700/t ceiling established earlier in Q2 2026.
The Alumina Price Divergence: A Cost-Floor Signal
One of the most analytically significant data points from the May 12 session is the behaviour of the LME alumina price, which held completely unchanged at $307.15/t while aluminium cash prices declined 0.42%.
| Metric | Value (May 12, 2026) |
|---|---|
| LME Aluminium Cash Offer | $3,639.50/t |
| LME Alumina Price | $307.15/t |
| Alumina-to-Aluminium Ratio | ~8.44% |
| Implied Smelter Input Cost Pressure | Moderate, within historical range |
To understand why this matters, it is helpful to trace the aluminium value chain. Bauxite ore is mined and refined through the Bayer process to produce alumina (aluminium oxide). Alumina is then smelted using the Hall-Heroult electrolytic process to produce primary aluminium. Alumina typically represents one of the largest variable input costs for primary smelters, alongside electricity.
When alumina prices remain stable while aluminium prices decline, smelter profit margins compress. This compression is not immediately catastrophic at the current levels — with the alumina-to-aluminium ratio at approximately 8.44%, which sits within historical norms. However, if aluminium prices were to continue declining while alumina remained anchored at $307.15/t, the margin squeeze would eventually create incentives for smelters to curtail production. This self-correcting mechanism means that alumina price stability at $307/t acts as an implicit cost-floor anchor for aluminium prices over the medium term.
The next major ASX story will hit our subscribers first
Three Structural Forces Shaping the $3,500–$3,700 Trading Range
The May 12 session does not occur in a macro vacuum. Three structural forces are currently defining the upper and lower boundaries of the price corridor within which the LME aluminium cash offer has been trading.
1. Energy Cost Dynamics in Chinese Primary Production
China accounts for well over half of global primary aluminium production, and Chinese output is disproportionately concentrated in provinces where electricity pricing is subject to seasonal and regulatory variability. Regions such as Yunnan have experienced hydropower-driven electricity constraints during dry seasons. Any significant curtailment in Chinese output has historically produced sharp near-term price spikes on the LME.
2. US-China Trade Policy and Physical Premium Divergence
The LME cash offer is a global benchmark price, but physical aluminium transactions frequently occur at premiums or discounts to this benchmark depending on regional market conditions. In the United States, the Midwest Premium reflects the additional cost of procuring aluminium domestically, and this premium is sensitive to tariff structures and trade policy. US aluminium tariffs have historically widened the Midwest Premium even when LME prices remain stable, creating a divergence between benchmark pricing and the actual cost faced by US manufacturers. In addition, tariff-driven supply chain risks continue to add layers of complexity for participants managing cross-border procurement.
3. Green Economy Demand and the Long-Term Structural Demand Argument
Aluminium's unique combination of light weight, corrosion resistance, conductivity, and recyclability positions it as a critical material across multiple green economy verticals. Electric vehicle battery casings, solar panel frames, heat management components, and grid transmission infrastructure all rely heavily on aluminium. Demand growth projections from these sectors through 2030 are broadly constructive, which is why the December 2027 contract pricing at $3,145–$3,150/t appears to underestimate long-term structural demand in the view of many commodity analysts.
For instance, among the aluminium industry leaders, several have already positioned strategically around anticipated long-term demand. Furthermore, Alcoa aluminium strategy provides one prominent example of how major producers are structuring themselves ahead of anticipated green economy demand acceleration.
Scenario Modelling: Price Pathways Over the Next Three to Six Months
| Scenario | Key Driver | Price Outlook (3-6 Months) |
|---|---|---|
| Bull Case | Inventory falls below 300,000t combined with Chinese production curtailments | $3,800-$4,000+/t |
| Base Case | Gradual inventory draw continues, macro conditions stable | $3,550-$3,750/t |
| Bear Case | Demand slowdown in Asia combined with trade policy headwinds | $3,200-$3,450/t |
These scenarios are illustrative projections based on structural market factors and should not be treated as investment advice. Commodity markets are subject to rapid and unpredictable change.
The base case range of $3,550–$3,750/t is consistent with the trading corridor already established through Q2 2026. Given the $3,639.50/t cash offer on May 12, the market is currently sitting in the middle of this range, providing balanced risk in both directions. The bull case requires a convergence of supply-side shocks with continued inventory drawdowns, while the bear case requires a material deterioration in Asian physical demand that the May 12 warrant data may be hinting at but has not yet confirmed.
Practical Implications for Different Market Participants
The May 12 price action carries different implications depending on where a participant sits in the supply chain.
- Downstream buyers (fabricators, packaging producers, automotive OEMs): A -0.42% cash offer decline in a single session is insufficient justification for adjusting procurement strategy. The more relevant signal is whether the inventory drawdown trajectory and the Asian Reference Price direction maintain their current pattern over the following two to three weeks.
- Primary producers and smelters: With alumina holding at $307.15/t and aluminium cash declining to $3,639.50/t, the May 12 session narrowed margins modestly. However, no structural deterioration is visible at these levels. The more critical threshold to monitor is whether the cash offer sustains a move below $3,500/t, which would begin to create genuine margin pressure for higher-cost producers.
- Traders and financial market participants: The flattening of the forward curve warrants attention. A narrowing differential between cash and 3-month prices can signal either reduced near-term oversupply or a transition toward backwardation, which historically precedes more aggressive price appreciation in cash markets.
Key Metrics to Monitor in the Sessions Ahead
For market participants seeking to anticipate directional moves beyond May 12, the following metrics deserve priority monitoring:
- Whether LME warehouse stocks continue declining toward the 300,000-tonne threshold, which has historically acted as a trigger for acute price premium formation.
- The trajectory of cancelled warrants across subsequent sessions. A sustained decline would confirm that physical procurement is slowing and that the Asian Reference Price weakness may deepen.
- Whether the Asian Reference Price continues to lead the broader complex downward or reverts to convergence with the cash offer, which would suggest the May 12 regional softness was transitory.
- Alumina price behaviour at the $307.15/t level. A break above this level would squeeze smelter margins and potentially accelerate production curtailments. A break below would signal upstream cost relief.
- Any developments in US-China trade policy that could affect physical market premiums independently of LME benchmark movements.
Frequently Asked Questions: LME Aluminium Pricing Explained
What does the LME aluminium cash offer price represent?
The cash offer is the price at which a seller is willing to deliver exchange-grade aluminium for immediate settlement. It is the primary global spot benchmark used across physical contracts, derivative pricing, and financial instruments tied to aluminium market conditions.
Why did the LME aluminium cash offer fall to $3,639.5/t on May 12, 2026?
The decline of $15.50/t (-0.42%) reflected softer trading conditions across the session, with reduced buying pressure evident in both spot and forward contracts. The move remained within the established Q2 2026 trading range and occurred against a backdrop of orderly liquidity conditions, suggesting normal market function rather than a distressed price event. Prior sessions had seen the cash offer reach $3,655/t, highlighting just how quickly conditions can shift.
What is the difference between the cash offer and the 3-month offer on the LME?
The cash offer reflects pricing for immediate delivery, while the 3-month offer represents pricing for delivery approximately three months forward. When the 3-month price is lower than cash (as on May 12), the market is in contango, signalling adequate near-term supply. When the 3-month price exceeds cash (backwardation), it signals immediate supply tightness and typically precedes sharper spot price appreciation.
What are cancelled warrants and why do they matter for price analysis?
A cancelled warrant is a formal instruction to remove physical aluminium from an LME-registered warehouse. Rising cancelled warrants indicate strengthening physical demand, while declining cancelled warrants — such as the -10.9% drop seen on May 12 — suggest a temporary pause in procurement. They act as a leading indicator because they precede actual inventory reductions by several days.
How does alumina pricing affect aluminium market dynamics?
Alumina is the refined feedstock fed into aluminium smelters, and it represents a significant share of variable production costs. When alumina prices hold firm while aluminium cash prices decline, smelter margins compress. Sustained margin compression eventually incentivises production curtailments, reducing supply and stabilising or reversing the aluminium price decline. This self-correcting mechanism gives alumina price behaviour a structural importance that is disproportionate to its headline visibility in commodity markets.
What is the LME 3-month Asian Reference Price and why did it decline most on May 12?
This benchmark is a regionally calibrated pricing reference derived from LME 3-month contracts, designed to reflect market conditions for aluminium purchasers operating in Asian time zones. Its -0.49% decline on May 12 — the largest percentage move across all tracked contracts — suggests that Asian physical demand softness was the primary driver of the session's price weakness, and that the global LME complex was to some degree following regional signals rather than generating its own independent selling pressure.
Readers seeking further context on LME aluminium pricing history, warehouse inventory data, and forward curve analysis can access publicly available market data through the London Metal Exchange's official data services and established commodity information platforms. These resources provide real-time and historical settlement data for professional market participants and serve as the primary reference for verifying the figures discussed in this article.
Want to Know Which ASX Mineral Discoveries Could Deliver Returns Like the Next Major Commodity Cycle?
Discovery Alert's proprietary Discovery IQ model scans ASX announcements in real time, instantly identifying significant mineral discoveries — including in commodities like aluminium's upstream supply chain — and delivering actionable alerts before the broader market reacts. Explore historic discovery returns on Discovery Alert's discoveries page and begin your 14-day free trial to position yourself ahead of the next major find.