June 14, 2026
The Physical Market Forces Reshaping Global Aluminium Pricing in 2026
Few commodity markets reveal as much about global industrial health as aluminium. As the second most widely used metal on Earth, its price trajectory reflects the intersection of energy economics, trade policy, manufacturing demand, and exchange inventory dynamics in ways that few other benchmarks can match. In 2026, the convergence of structurally declining warehouse stocks, shifting cross-border trade flows, and the emergence of energy-transition demand as a permanent consumption driver has pushed the LME aluminium cash offer price to $3,635 per tonne — territory not seen in approximately four years. Understanding what this means requires looking beyond the headline number.
When big ASX news breaks, our subscribers know first
Why Is the LME Aluminium Cash Offer Price Trading Near Multi-Year Highs in 2026?
The Structural Context Behind Elevated Aluminium Pricing
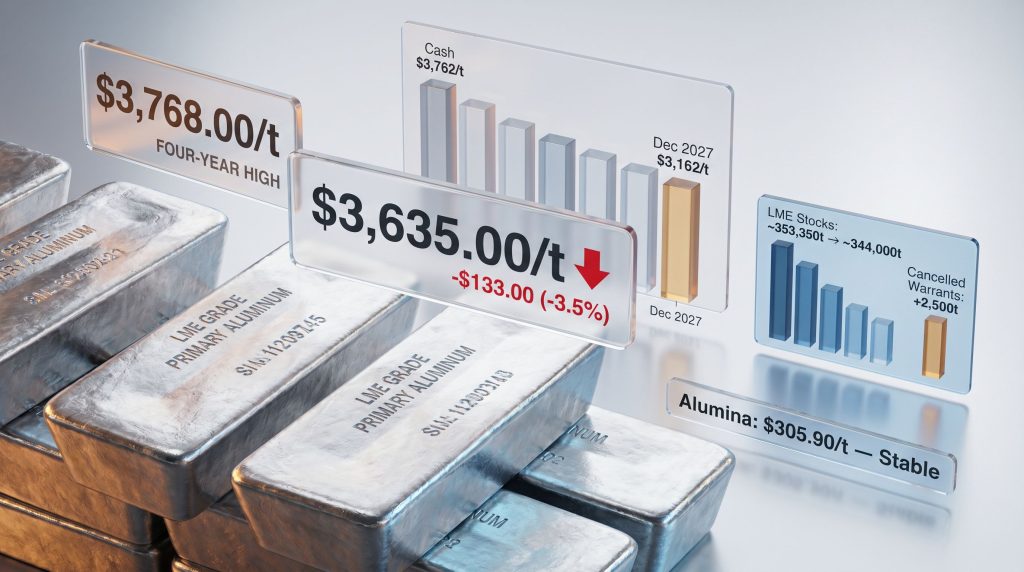
Global aluminium markets have undergone a fundamental repricing over the past eighteen months, driven by forces that are structural in nature rather than purely speculative. The LME aluminium cash offer price to $3,635 per tonne on May 15 followed a peak of $3,768/t on May 14, 2026, representing the culmination of a multi-month tightening cycle rooted in declining exchange inventories, constrained smelter output, and a demand composition that looks materially different from the previous four-year price cycle.
LME aluminium warehouse stocks have declined by approximately 42% from their 2023 peak of around 603,500 tonnes to current levels near 344,000–346,500 tonnes. At that level, exchange-held inventory represents less than two days of global consumption, a figure that dramatically amplifies the price sensitivity of the market to even modest supply disruptions. This is not a temporary inventory drawdown driven by seasonal restocking; it reflects a persistent gap between production growth and demand acceleration that has been building since late 2024.
China's evolving trade position has added further complexity. The world's largest aluminium producer accounted for roughly 59% of global primary output in 2025 according to International Aluminium Institute data, yet the country's import volumes showed a year-on-year increase of approximately 18.7% in Q1 2026 while export volumes declined by around 22.4% over the same period. This shift in China's trade balance, from a net exporter to a tighter domestic market orientation, has materially reduced the global physical surplus that previously acted as a price ceiling.
How the LME Cash Settlement Mechanism Works
The LME official settlement price is derived from the last cash offer price recorded during the second Ring trading session of each trading day, making this benchmark the single most-watched reference point in global aluminium commerce. Ring trading at the LME involves open outcry sessions between approved ring-dealing members, and the resulting cash bid and offer prices are used to settle approximately 70% of physical aluminium contracts worldwide.
The cash offer price specifically represents the price at which metal can be purchased for immediate delivery, and its relationship to forward-dated contracts provides one of the most reliable signals of physical market conditions:
- Backwardation occurs when cash prices trade at a premium to forward contracts, signalling that physical metal is in short supply relative to immediate demand
- Contango describes the opposite condition, where forward prices exceed cash prices, typically indicating ample physical availability or expectations of future scarcity
- The spread magnitude between cash and three-month prices quantifies the degree of tightness, with wider backwardation correlating with more severe physical constraints
Key Concept: When the LME cash offer price for aluminium trades significantly above forward-dated contracts, it represents a direct signal that physical buyers are competing for immediately available metal — a condition that has been characteristic of the 2025–2026 market environment.
The carbon border adjustment mechanism (CBAM), now fully operational in European markets, has introduced an additional pricing layer that overlays the traditional cash-forward spread analysis. Physical aluminium buyers must now factor the embedded carbon cost of their procured metal into purchasing decisions, creating a new source of regional price variation that can add an estimated $50–150/t to the effective acquisition cost depending on the smelter's energy mix and production methods.
What Do the Numbers Actually Tell Us? A Full Curve Breakdown
Spot Price Movement: May 13–15, 2026
The price action across the three trading sessions ending May 15, 2026 illustrates both the strength of the preceding rally and the mechanics of a technically-driven correction:
| Date | LME Cash Offer (USD/t) | Daily Change |
|---|---|---|
| 13 May 2026 | $3,729.50 | Prior session |
| 14 May 2026 | $3,768.00 | +$38.50 (+1.0%) |
| 15 May 2026 | $3,635.00 | -$133.00 (-3.5%) |
The $3,768/t level established on May 14 represented a four-year high for LME aluminium cash pricing. The $133/t single-session decline that followed reflects the mechanics of profit-taking after an extended rally rather than a reversal of underlying fundamentals — a distinction that becomes clearer when examining the full forward curve behaviour during the same session.
Forward Curve Pricing: Three-Month and Long-Dated Contracts
| Contract | Previous Close (USD/t) | 15 May Close (USD/t) | Change |
|---|---|---|---|
| 3-Month Bid | $3,665.50 | $3,578.00 | -$87.50 (-2.4%) |
| 3-Month Offer | $3,666.00 | $3,580.00 | -$86.00 (-2.3%) |
| Dec 2027 Bid | $3,190.00 | $3,157.00 | -$33.00 (-1.0%) |
| Dec 2027 Offer | $3,195.00 | $3,162.00 | -$33.00 (-1.0%) |
| Asian Ref Price (3M) | $3,657.50 | $3,563.00 | -$94.50 (-2.6%) |
What the Forward Curve Structure Reveals
The differential in the magnitude of price declines across the curve on May 15 carries significant analytical weight. The cash price fell 3.5% while December 2027 contracts declined only 1.0% — a pattern that reveals important information about where market participants believe the correction is concentrated:
- Front-end technical pressure: The steeper cash price decline indicates that short-term position rebalancing and profit-taking were concentrated in near-dated contracts, consistent with a technically-driven correction rather than a demand-outlook deterioration
- Long-dated resilience: December 2027 contracts holding above $3,157–$3,162/t demonstrates that forward commercial buyers have not revised their medium-term demand assumptions in response to the single-session price movement
- Asian market adjustment: The LME 3-Month Asian Reference Price declining by $94.50/t to $3,563/t signals that Asian physical market participants are recalibrating near-term procurement strategies, potentially creating a short-term buying opportunity for price-sensitive consumers
The persistence of long-dated contract pricing above $3,150/t is particularly notable given that during the previous four-year price cycle, comparable forward contracts rarely sustained levels above $2,800/t for extended periods, reflecting the structural change in demand composition driven by energy-transition applications.
Is the LME Aluminium Inventory Trend Signalling Further Price Support?
LME Warehouse Stock Movements: A Tightening Physical Market
The inventory data released on May 15, 2026 confirmed that the price correction was not accompanied by any loosening of physical market conditions. In fact, the inventory metrics moved in a direction that typically precedes renewed price support:
| Metric | Previous Level | 15 May Level | Change |
|---|---|---|---|
| Opening Stock | 348,750 t | 346,500 t | -2,250 t |
| Live Warrants | 291,725 t | 286,725 t | -5,000 t |
| Cancelled Warrants | 54,775 t | 57,275 t | +2,500 t |
The distinction between live warrants and cancelled warrants is critical for understanding physical market dynamics. Live warrants represent metal held in LME-approved warehouses that is available to the broader market. Cancelled warrants, by contrast, represent metal that has been designated for physical withdrawal, meaning buyers have already committed to removing that tonnage from exchange storage.
Once cancelled, warrants cannot be traded on the LME until the metal is re-warranted, which effectively removes it from the pool of available exchange inventory.
Analyst Insight: Rising cancelled warrants alongside falling total stocks is one of the most reliable leading indicators of near-term price support in base metal markets. It signals that physical buyers are actively pulling metal from exchange warehouses, reducing the buffer available to the broader market.
The four-day drawdown from approximately 353,350 tonnes on May 11 to roughly 344,000–346,500 tonnes by May 15 represents a decline of 7,000–9,000 tonnes in less than a week. Annualised, a pace of inventory drawdown at this rate would eliminate the entire current LME aluminium stock position in a matter of months — a scenario that would exert extreme upward pressure on cash prices and dramatically widen any backwardation structure in the forward curve.
Contextualising the Inventory Decline
At approximately 344,000–346,500 tonnes, LME aluminium stocks represent less than two days of global consumption against a market that exceeds 70 million tonnes of annual demand. This relationship between exchange inventory and daily consumption has historically been a powerful predictor of price volatility. When exchange stocks fall below the equivalent of two to three days of consumption, the market typically lacks the physical buffer needed to absorb supply disruptions without sharp price responses.
It is also important to recognise that LME warehouse stocks represent only a fraction of total global aluminium inventory. Privately held stocks at consumer facilities, trader warehouses, and producer storage are not publicly reported, but industry estimates suggest that China's privately held aluminium stocks declined by approximately 12% year-to-date through May 2026, compounding the exchange-level inventory tightness with reduced off-exchange availability.
What Is Driving the Sustained Rally Toward Four-Year Highs?
Supply-Side Pressures Constraining Physical Availability
Physical supply tightness, rather than purely speculative capital flows, appears to be the primary driver of the aluminium price rally into the $3,600–$3,768/t range. Several distinct supply-side pressures have converged to constrain physical availability. Furthermore, the role of aluminium smelter energy costs has become increasingly significant in shaping production economics across key regions:
- Energy cost escalation at smelters: European smelter profitability margins have compressed significantly, with the price-to-cost margin falling to approximately $85/t in Q1 2026 versus around $220/t in Q1 2025 according to Wood Mackenzie analysis, limiting incentive to expand output
- Geographic concentration risk: The concentration of global bauxite reserves in Guinea, Australia, and a small number of other jurisdictions creates structural vulnerability in the upstream supply chain that amplifies any local disruption
- Production capacity ceiling: The energy-intensive nature of primary aluminium smelting, which requires approximately 13–15 kilowatt-hours per kilogram of metal produced, creates a hard ceiling on output growth in regions where electricity prices are elevated
- Environmental compliance costs: Increasingly stringent environmental regulations on smelting operations in multiple jurisdictions have raised the effective cost of maintaining existing capacity, let alone expanding it
Demand Dynamics Supporting Price Floors
The demand side of the aluminium equation has been transformed by the energy transition in ways that have created a structural price floor absent from previous cycles.
Energy-transition applications, including electric vehicle battery systems, solar panel framing, and electrical grid infrastructure, collectively accounted for approximately 8.5% of global aluminium consumption in 2025, compared with less than 2% during the previous comparable price cycle. This represents a permanent addition to the demand base that did not exist at scale four years ago.
The aluminium intensity of electric vehicles is substantially higher than that of conventional internal combustion engine vehicles, with full EVs using approximately 250–350 kg of aluminium per vehicle compared to roughly 150–200 kg for conventional vehicles. As EV penetration rates rise across major automotive markets, this differential creates a demand increment that compounds annually regardless of broader economic conditions.
The Role of Trade Policy and Cross-Border Flows
Shifting trade policy frameworks across major aluminium-consuming and producing economies have introduced additional complexity into physical metal routing, creating regional price premiums and supply dislocations that feed back into the LME cash offer price. In addition, the effects of US aluminium tariffs have materially reshaped cross-border trade patterns, redirecting metal flows in ways that have tightened certain regional markets:
- Carbon border adjustment mechanisms are now actively influencing sourcing decisions in European markets, with buyers increasingly incorporating embedded carbon costs into procurement economics
- The alumina-to-aluminium value chain price ratio provides a useful cross-check on whether price movements reflect genuine metal market dynamics or input cost inflation
- Regional physical premiums in key consuming markets, including European duty-paid premiums and the US Midwest premium, have elevated substantially in 2026, reflecting inadequate local supply relative to industrial demand
How Does the LME Alumina Price Fit Into the Broader Picture?
Alumina Price Stability at $305.90/t
The LME alumina Platts price held steady at $305.90/t on May 15, 2026, unchanged from the prior session. This stability during a period of aluminium price correction carries constructive implications for smelter economics and market interpretation.
The alumina-to-aluminium price ratio at current levels sits at approximately 8.4%, within the historical range of 7.5–10% that prevails during balanced market conditions. This ratio's stability during the May 15 price correction confirms that the aluminium price movement was driven by metal market dynamics — specifically by position rebalancing in near-dated contracts — rather than by upstream cost escalation flowing through from the refining stage.
Technical Context: Alumina is the direct feedstock for primary aluminium smelting, and the relationship between alumina and aluminium pricing is a critical barometer of smelter economics. When alumina prices rise faster than aluminium prices, smelter margins compress, which eventually forces production curtailments that reduce supply and support aluminium prices. The current stable alumina price environment reduces this risk in the near term.
The Bauxite-Alumina-Aluminium Value Chain Under Pressure
The broader value chain connecting bauxite mining through alumina refining to primary aluminium smelting operates under tight input ratios that amplify the impact of upstream disruptions on end-metal availability. Approximately 4–5 tonnes of bauxite are required to produce one tonne of aluminium, with roughly 2 tonnes of alumina as the intermediate product.
Consequently, any supply disruption at the bauxite or alumina refining stage has an amplified downstream effect on primary aluminium production economics. The bauxite supply fundamentals underpinning this value chain point to continued complexity driven by geographic concentration of bauxite reserves — with implications for both pricing and supply security that will influence aluminium market dynamics well beyond the current price cycle.
The next major ASX story will hit our subscribers first
Frequently Asked Questions: LME Aluminium Pricing
What is the LME aluminium cash offer price?
The LME aluminium cash offer price is the benchmark spot price at which aluminium can be purchased for immediate delivery on the London Metal Exchange. It is determined during the second Ring session each trading day and serves as the global reference price for physical aluminium transactions, contract settlements, and financial derivatives pricing worldwide.
Why did the LME aluminium cash offer price drop to $3,635/t after reaching a four-year high?
The decline from $3,768/t to $3,635/t on May 15, 2026 represents a single-session correction of $133/t (3.5%) following an extended rally period. Such corrections are a normal feature of commodity markets after rapid price appreciation, as profit-taking and position rebalancing temporarily outweigh fundamental buying pressure. The underlying physical market tightness evidenced by declining LME inventory and rising cancelled warrants suggests the fundamentals supporting elevated prices remain intact.
What do rising cancelled warrants mean for aluminium prices?
Cancelled warrants represent LME warehouse stock that has been designated for physical removal from exchange storage. Rising cancelled warrants indicate that buyers are actively withdrawing metal, which reduces the available physical buffer and typically supports prices. The increase from 54,775 to 57,275 tonnes on May 15 reinforces the view that physical demand remains robust despite the concurrent price correction.
What is the LME 3-Month Asian Reference Price?
The LME 3-Month Asian Reference Price is a pricing benchmark specifically designed for Asian market participants, calculated during Asian trading hours to provide regional relevance. It declined by $94.50/t to $3,563/t on May 15, 2026, indicating that Asian physical market participants were adjusting near-term procurement strategies in response to the global price movement.
How does the alumina price relate to aluminium pricing?
Alumina is the primary feedstock for primary aluminium smelting, and its price directly influences production costs across the global smelting industry. The LME alumina Platts price at $305.90/t on May 15, 2026 remained stable, confirming that input cost dynamics were not driving the aluminium price correction observed on that date and that smelter margin conditions remain relatively constructive. For further context on how these dynamics interact, the broader outlook for aluminum and alumina markets provides useful comparative analysis.
What Should Aluminium Market Participants Watch Next?
Key Indicators to Monitor
The following metrics will determine whether the May 15 correction represents a temporary pause in the uptrend or the beginning of a more sustained price retreat:
- LME cancelled warrant trajectory: Continued increases would signal further inventory drawdowns and renewed price support as physical buyers keep pulling metal from exchange storage
- Cash-to-three-month spread: Any narrowing of this spread toward parity or contango would indicate easing near-term physical tightness and potential for further price consolidation
- LME alumina price movement: Any sustained break above $305.90/t would signal building upstream cost pressure with implications for smelter margins and production economics
- Regional physical premium dynamics: Premiums in key consuming regions including Europe, Japan, and the US Midwest provide early signals of demand shifts that typically precede LME price moves by several weeks
- China import and export data: Monthly trade statistics from China's customs authority remain critical leading indicators given China's dominant role in both production and consumption
Scenario Framework: Where Does the Price Go From Here?
| Scenario | Trigger Conditions | Implied Price Direction |
|---|---|---|
| Bullish Continuation | Cancelled warrants keep rising; supply disruptions persist | Re-test of $3,700–$3,800/t range |
| Consolidation | Inventory stabilises; no new supply shocks | Range-bound $3,500–$3,650/t |
| Bearish Correction | Inventory rebuilds; demand softens in key regions | Potential retreat toward $3,200–$3,400/t |
The scenario framework above is speculative in nature and reflects possible outcomes rather than forecasts. Commodity markets are subject to rapid and unpredictable change, and this analysis should not be construed as investment advice. Readers should conduct independent research and consult qualified financial advisers before making any trading or investment decisions.
Key Takeaways: LME Aluminium at $3,635/t and What It Means for the Market
The LME aluminium cash offer price to $3,635 per tonne on May 15, 2026 — following a four-year high of $3,768/t the previous session — captures a market at a pivotal juncture. The single-session correction of $133/t (3.5%) reflects the normal mechanics of profit-taking after an extended rally, but the underlying physical market evidence points firmly toward continued structural tightness. However, the influence of top aluminium producers on global supply dynamics remains a key variable in determining whether current price levels are sustained:
- LME aluminium stocks declined from approximately 353,350 tonnes on May 11 to roughly 344,000–346,500 tonnes by May 15, a drawdown of 7,000–9,000 tonnes in four trading days
- Rising cancelled warrants, moving from 54,775 to 57,275 tonnes, confirm that physical buyers are actively removing metal from exchange storage rather than using the price correction as an opportunity to wait
- Long-dated December 2027 contracts held above $3,157–$3,162/t despite the front-end sell-off, reflecting sustained commercial buyer confidence in medium-term demand fundamentals
- LME alumina price stability at $305.90/t confirms that the correction originated in metal market dynamics rather than upstream cost escalation, preserving smelter margin incentives
- The structural demand contribution from energy-transition applications, including electric vehicles and solar infrastructure, has permanently altered the aluminium demand equation relative to the previous comparable price cycle
For market participants tracking the LME aluminium cash offer price, the balance of evidence suggests that the May 15 movement represents a technically-driven correction within an ongoing structural bull market rather than a trend reversal. The key variables to monitor remain the cancelled warrant trajectory, regional physical premiums, and China's evolving trade balance in primary aluminium.
Readers seeking additional context on LME aluminium pricing trends and physical market dynamics can explore related industry coverage and historical price data available through AL Circle's aluminium market news platform, which provides ongoing price tracking and market analysis for aluminium industry participants. Furthermore, the LME's official aluminium page offers direct access to contract specifications, historical pricing, and real-time market data for those requiring primary source reference material.
Want to Capitalise on the Next Major ASX Mineral Discovery Before the Broader Market?
Discovery Alert's proprietary Discovery IQ model delivers real-time alerts on significant ASX mineral discoveries — turning complex commodity data across more than 30 resources into a single, actionable gold-equivalent metric — so subscribers can identify high-potential opportunities the moment they are announced. Explore how historic discoveries have generated substantial market returns on Discovery Alert's dedicated discoveries page, and begin a 14-day free trial today to position ahead of the market.