August 1, 2026
How LNG Market Concentration Creates Systemic Energy Security Risks
Global energy markets operate under the assumption that supply disruptions will be temporary and manageable. However, the concentration of liquefied natural gas production in specific regions creates vulnerabilities that extend far beyond typical market corrections. When a single facility represents substantial global capacity, infrastructure damage transforms from operational inconvenience into structural market transformation.
The energy industry has historically managed supply interruptions through diplomatic solutions, maintenance scheduling, or alternative sourcing arrangements. Furthermore, physical infrastructure destruction presents entirely different challenges, requiring complete reconstruction rather than operational adjustments. This fundamental distinction shapes how markets respond and how quickly supply chains can adapt.
When big ASX news breaks, our subscribers know first
Understanding the Scale of Qatar's LNG Infrastructure Damage
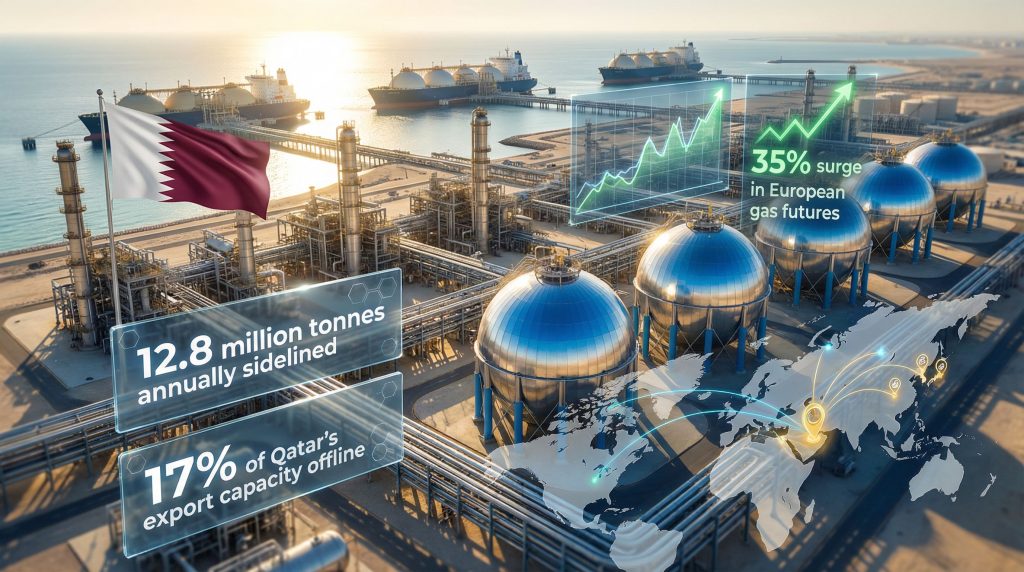
The Qatar LNG crisis demonstrates how concentrated production capacity creates systemic vulnerabilities in global energy markets. The Ras Laffan complex damage represents approximately 17% of Qatar's total export capacity, translating to substantial volumes in a tightly balanced global market.
Key Impact Metrics from the Qatar LNG Crisis:
• Capacity Loss: 17% of Qatar's LNG export capacity offline for extended period
• Recovery Timeline: 3-5 year reconstruction period confirmed by industry leadership
• Price Response: European gas futures surged 35% within hours of damage assessment
• Market Share Impact: Qatar maintains approximately 20% of global LNG export capacity
The reconstruction timeline fundamentally alters market dynamics. Unlike temporary disruptions resolved through diplomatic channels or operational adjustments, physical infrastructure damage requires complete facility rebuilding. This includes specialised equipment with extended manufacturing lead times and complex engineering requirements.
Technical Complexity of LNG Infrastructure Reconstruction:
• Liquefaction train replacement requires 18-24 month manufacturing periods
• Specialised cryogenic equipment sourced from limited global suppliers
• Complete facility recertification and safety testing procedures
• Integration with existing downstream operations and storage systems
Consequently, the extended timeline reflects the sophisticated nature of LNG processing technology. Each liquefaction train operates under extreme temperature and pressure conditions, requiring precision engineering and specialised materials that cannot be rapidly sourced or installed.
What Makes This Crisis Different from Previous LNG Disruptions
Historical LNG market disruptions typically involved operational shutdowns, geopolitical tensions, or scheduled maintenance activities. However, the US natural gas forecast indicates that the Qatar situation represents physical infrastructure destruction requiring complete reconstruction rather than restart protocols.
Comparison Analysis: LNG Market Disruption Types
| Disruption Category | Typical Duration | Recovery Method | Market Impact |
|---|---|---|---|
| Maintenance Shutdowns | 2-8 weeks | Scheduled restart | Temporary price elevation |
| Geopolitical Closures | 3-18 months | Diplomatic resolution | Regional supply rebalancing |
| Infrastructure Damage | 3-5+ years | Complete reconstruction | Structural market transformation |
The distinction between operational and physical disruptions creates different market expectations and response mechanisms. For instance, operational shutdowns maintain facility integrity while addressing technical or political issues. Physical damage eliminates production capacity until reconstruction completion.
Unique Characteristics of Infrastructure Damage Events:
• Complete loss of operational capability requiring total rebuilding
• Extended engineering and construction timelines beyond typical project schedules
• Supply chain constraints for specialised LNG processing equipment
• Regulatory recertification requirements following reconstruction
• Integration challenges with existing facility operations
Moreover, the complexity extends beyond primary liquefaction systems to include downstream operations affecting polymers and methanol production. This integrated facility design means reconstruction impacts multiple product streams simultaneously, amplifying economic consequences.
Which Regional Markets Face the Greatest Vulnerability
Regional exposure to the Qatar LNG crisis varies significantly based on import dependency, contract structures, and alternative supply access. Asian markets demonstrate highest vulnerability due to long-term contract obligations and geographic proximity to Middle Eastern suppliers.
Asia-Pacific: Long-Term Contract Dependencies
Asian LNG buyers maintain extensive contractual relationships with Qatar through take-or-pay agreements spanning 15-25 year terms. These contracts provide supply security during normal market conditions but create vulnerability during extended disruptions.
Regional Dependency Analysis:
• Japan: Heavy reliance on Middle Eastern LNG suppliers for baseload power generation
• South Korea: Industrial users dependent on stable LNG pricing for petrochemical operations
• China: Fastest-growing LNG demand market with expanding import infrastructure
• Taiwan: Limited storage capacity increases vulnerability to supply interruptions
Long-term contracts typically include force majeure provisions allowing temporary supply suspension during infrastructure damage events. However, buyers remain obligated to secure alternative supplies at potentially elevated market prices.
European Markets: Storage and Seasonal Demand Pressures
European natural gas markets face dual challenges during the crisis: depleted winter storage inventories requiring seasonal rebuilding and increased competition for spot market cargoes from Asian buyers seeking alternative supplies.
European Market Vulnerabilities:
• Storage rebuilding requirements during spring and summer seasons
• Competition with Asian spot buyers for available cargoes
• Limited pipeline gas alternatives during regional supply constraints
• Industrial demand sensitivity to sustained price elevation
The timing of the Qatar LNG crisis coincides with typical European storage rebuilding seasons, when inventories require replenishment following winter consumption. This seasonal dynamic amplifies pricing pressure as buyers compete for limited available supplies, creating significant LNG market implications across the continent.
How Alternative Suppliers Respond to Market Gaps
Alternative LNG suppliers benefit from Qatar's capacity loss through improved pricing and increased utilisation rates. Nevertheless, existing global LNG infrastructure cannot immediately replace lost volumes, creating sustained market tightness.
United States: Production Capacity Expansion Potential
The United States operates the world's largest LNG export capacity, providing strategic advantage during global supply constraints. However, existing terminal capacity limits immediate response capability to fill Qatar's supply gap.
U.S. LNG Market Position:
• Current Capacity: Approximately 95 million tonnes annually across multiple export terminals
• Expansion Projects: 40+ million tonnes under construction with 2027-2029 in-service dates
• Operational Flexibility: Ability to optimise production rates and cargo destinations
• Natural Gas Supply: Abundant shale gas production supporting export growth
U.S. LNG terminals demonstrate operational flexibility by adjusting production rates and cargo destinations based on global market conditions. This flexibility provides valuable supply response capability during international crises, particularly given the current global energy outlook.
Australian LNG: Geographic and Operational Advantages
Australian LNG operations benefit from geographic proximity to Asian markets and established infrastructure supporting consistent production. Major operators can optimise facility utilisation to capture premium pricing during supply constraints.
Australian Supply Response Capabilities:
• Geographic Advantage: Shorter shipping distances to primary Asian demand centres
• Operational Stability: Established production facilities with consistent operational history
• Contract Flexibility: Portfolio optimisation opportunities during market tightness
• Expansion Potential: Existing infrastructure capable of incremental production increases
Australian producers benefit from long-term relationships with Asian buyers and operational experience managing market volatility. This positions them favourably during extended supply disruptions from competing regions.
Investment Implications and Market Structure Changes
The Qatar LNG crisis accelerates existing investment trends toward supply diversification, enhanced security measures, and alternative production technologies. Investment flows reflect changing risk assessments regarding concentrated production regions.
Infrastructure Security and Geographic Diversification
Energy infrastructure investors increasingly prioritise geographic diversification and enhanced security measures following Qatar's experience. This shifts capital allocation toward projects in politically stable regions with reduced concentration risk.
Investment Trend Analysis:
• Floating LNG Technology: Mobile production platforms reducing fixed infrastructure vulnerability
• Regional Diversification: Accelerated development in Africa, North America, and other regions
• Enhanced Security: Improved facility protection and redundancy systems
• Strategic Storage: Expanded LNG storage capacity in consuming regions
Floating LNG technology represents particularly attractive investment opportunity due to mobility advantages and reduced infrastructure vulnerability. These facilities can relocate during security threats while maintaining production capability.
Technology Innovation and Alternative Energy Acceleration
Extended LNG supply constraints create stronger economic incentives for renewable energy adoption and energy efficiency improvements. Industrial users facing sustained higher gas costs accelerate electrification and process optimisation initiatives, particularly as concerns about energy transition security intensify.
Technology Investment Drivers:
• Renewable Energy: Enhanced competitiveness versus sustained high gas pricing
• Energy Storage: Battery systems supporting renewable integration and grid stability
• Industrial Electrification: Process conversion from gas to electric power sources
• Efficiency Technologies: Demand reduction through improved industrial processes
The crisis demonstrates vulnerability of gas-dependent systems, encouraging investment in alternative energy sources and reduced fossil fuel dependency. This acceleration may persist beyond crisis resolution due to changed risk perceptions.
The next major ASX story will hit our subscribers first
Pricing Mechanisms and Contract Structure Evolution
Extended supply shortages create sustained price elevation patterns different from temporary market spikes. The multi-year Qatar timeline fundamentally alters pricing expectations and contract negotiation dynamics.
Spot Market Volatility and Premium Pricing
Historical analysis indicates extended supply shortages generate sustained price premiums rather than temporary volatility spikes. The multi-year Qatar timeline creates structural pricing changes affecting both spot and contract markets.
Price Impact Modelling Scenarios:
• Short-term (6-12 months): 25-40% premium over pre-crisis baseline pricing
• Medium-term (1-3 years): 15-25% structural premium reflecting supply scarcity
• Long-term (3+ years): New equilibrium pricing based on alternative supply costs
Sustained pricing elevation reflects fundamental supply-demand imbalance rather than temporary market disruption. This creates different market dynamics and participant behaviour compared to short-term price spikes.
Long-Term Contract Adaptations
LNG purchase agreements evolve to incorporate enhanced force majeure provisions and supply diversification requirements. Buyers demand multiple supplier arrangements reducing concentration risk exposure.
Contract Structure Evolution:
• Enhanced Force Majeure: Clearer provisions addressing infrastructure damage scenarios
• Supply Diversification: Requirements for multiple regional suppliers within contract portfolios
• Flexible Delivery: Options for alternative supply sources during disruption periods
• Price Adjustment: Mechanisms reflecting actual market conditions during supply constraints
The Qatar LNG crisis demonstrates limitations of traditional contract structures during extended infrastructure damage events. Future agreements incorporate lessons learnt regarding supply security and risk allocation.
Strategic Responses and Emergency Preparedness
Energy companies and governments implement enhanced emergency response protocols following Qatar's experience. These initiatives focus on supply chain resilience and rapid response capability during future disruption events, while considering the broader implications of US‑China trade impact on global energy markets.
Corporate Supply Chain Diversification
Major energy companies accelerate geographic diversification strategies reducing dependency on single-region suppliers. This includes both production investments and contract portfolio rebalancing across multiple supply sources.
Corporate Response Strategies:
• Portfolio Optimisation: Balanced exposure across multiple producing regions and suppliers
• Emergency Protocols: Rapid deployment procedures for alternative supply activation
• Storage Enhancement: Increased inventory levels providing disruption buffer capacity
• Technology Investment: Advanced systems supporting supply chain visibility and management
Companies recognise concentration risk extends beyond operational efficiency to fundamental business continuity. Diversified supply portfolios become essential risk management tools rather than optional optimisation strategies.
Government Energy Security Policies
National governments reassess energy security policies incorporating lessons from Qatar's extended disruption. This includes strategic reserve expansion and enhanced international coordination mechanisms.
Policy Development Areas:
• Strategic Reserves: Expanded LNG storage capacity for emergency supply situations
• International Cooperation: Enhanced coordination protocols with allied nations during crises
• Domestic Production: Accelerated development of indigenous energy resources
• Infrastructure Protection: Enhanced security measures for critical energy facilities
The Qatar experience demonstrates how regional disruptions create global consequences requiring coordinated international response. Government policies evolve to address these interconnected vulnerabilities.
What Are the Long-Term Consequences for Global Energy Markets?
Extended gas supply constraints and elevated pricing strengthen economic incentives for renewable energy adoption across multiple sectors. The crisis serves as catalyst for accelerated clean energy investment and deployment.
Industrial Sector Electrification
Manufacturing operations dependent on natural gas for process heat and power generation evaluate electrification alternatives during sustained supply uncertainty. Higher gas costs improve renewable energy project economics and payback periods.
Electrification Investment Drivers:
• Cost Competitiveness: Renewable electricity versus sustained high gas pricing
• Supply Security: Reduced dependency on volatile international gas markets
• Technology Maturity: Improved performance and reliability of electric industrial processes
• Policy Support: Government incentives encouraging clean energy adoption
Industrial users facing multi-year gas supply uncertainty accelerate planned electrification timelines and expand project scope beyond original planning parameters.
Power Sector Grid Flexibility Requirements
Electric power systems adapt to reduced natural gas availability for peak load management and backup generation. This drives investment in battery storage, demand response systems, and grid modernisation initiatives.
Grid Adaptation Requirements:
• Energy Storage: Battery systems replacing gas peaking plants for load balancing
• Demand Response: Advanced systems managing electricity consumption during supply constraints
• Grid Modernisation: Smart grid technologies optimising renewable energy integration
• Regional Coordination: Enhanced interconnection supporting resource sharing during emergencies
Power system operators develop enhanced flexibility capabilities reducing reliance on gas-fired generation during supply disruptions or price volatility periods.
How Will Market Structure Evolve Following This Crisis?
The Qatar LNG crisis catalyses fundamental changes in global energy market structure and risk management approaches. These modifications address concentration vulnerabilities and enhance system resilience against future disruption events.
Supplier Concentration Risk Mitigation
Energy market development emphasises geographic and operational diversification reducing concentration risk exposure. This includes both supply source diversification and technology platform variety.
Market Structure Evolution:
• Regional Balance: More distributed global production capacity across multiple regions
• Technology Diversity: Combination of conventional and floating LNG production systems
• Operational Redundancy: Multiple supply pathways for critical market segments
• Enhanced Coordination: Improved international cooperation during emergency situations
Market participants recognise concentration risk represents fundamental systemic vulnerability requiring structural solutions rather than temporary adjustments.
Emergency Coordination and Response Mechanisms
International energy agencies develop enhanced coordination protocols for supply crisis management. This includes strategic reserve coordination, emergency allocation frameworks, and rapid response deployment systems.
Coordination Framework Development:
• Reserve Coordination: Strategic stockpile management across multiple nations during crises
• Allocation Protocols: Framework for distributing limited supplies during extended disruptions
• Information Sharing: Enhanced data exchange supporting coordinated decision-making
• Technology Deployment: Rapid response systems for alternative supply activation
These mechanisms address the reality that regional disruptions create global consequences requiring coordinated international response rather than individual national actions. For instance, according to Bloomberg's analysis, the crisis has reshaped the entire future of gas markets globally. Similarly, Reuters reports suggest that despite the significant challenges, Qatar retains strategic options for recovery and market repositioning.
The Qatar LNG crisis represents a watershed moment demonstrating how infrastructure concentration creates systemic vulnerabilities in interconnected global energy markets. The multi-year reconstruction timeline transforms temporary disruption into fundamental market restructuring, accelerating investment in supply diversification, renewable energy alternatives, and enhanced emergency preparedness systems. Organisations adapting quickly to these new market realities position themselves advantageously for navigating future challenges while contributing to more resilient global energy infrastructure development.
This analysis reflects current market conditions and available information as of March 2026. Energy market dynamics remain subject to rapid change based on geopolitical developments, technology advancement, and policy modifications. Readers should consult current market data and professional advice when making investment or operational decisions.
Looking to Capitalise on Energy Market Disruptions?
Discovery Alert's proprietary Discovery IQ model delivers real-time alerts on significant ASX mineral discoveries, instantly empowering subscribers to identify actionable opportunities ahead of the broader market. Begin your 14-day free trial today and secure your market-leading advantage during these transformative periods in global energy markets.