June 4, 2026
When Geography Becomes Destiny: LNG Markets in the Age of Gulf Conflict
Energy markets operate on the assumption that supply routes are predictable. Decades of globalisation reinforced this belief, embedding the idea that physical commodity flows could be optimised, hedged, and managed through financial instruments. The Iran war has stress-tested that assumption in ways that pipeline economics never could, exposing a structural fragility at the heart of the global liquefied natural gas trade. Uniper LNG prices volatility Iran war Asia Europe has become a defining theme of mid-2026 energy markets, as buyers from Tokyo to Rotterdam reckon with a supply shock that no hedge fully absorbed. When geography fails, no contract structure fully insulates you from the consequences.
Understanding why LNG markets are so uniquely vulnerable to Gulf disruption requires stepping back from the price headlines and examining how the system actually works.
When big ASX news breaks, our subscribers know first
How LNG Markets Transmit Geopolitical Shocks Into Consumer Prices
Unlike pipeline gas, which moves through fixed infrastructure between predetermined endpoints, LNG is transported as a supercooled liquid at approximately minus 162 degrees Celsius in specialised tankers. This physical flexibility is often cited as a strength of the LNG trade: cargoes can, in theory, be redirected to where prices are highest. In practice, however, this flexibility is constrained by long-term offtake agreements, shipping availability, regasification capacity at destination terminals, and crucially, the concentration of liquefaction infrastructure in a small number of geographic hubs.
The Persian Gulf represents one of those hubs. Qatar alone accounts for a significant share of globally traded LNG volumes, and its Ras Laffan Industrial City is among the largest LNG export complexes on earth. When that infrastructure is threatened, the flexibility of the LNG trade system is suddenly much less relevant than the physical reality of reduced supply. The broader geopolitical risk landscape affecting commodities in 2025 and 2026 had already forewarned analysts that Gulf exposure was underpriced.
The Strait of Hormuz compounds this vulnerability considerably. Roughly 21 million barrels of oil equivalent in hydrocarbons transit the strait daily under normal conditions, and LNG tanker traffic originating from Qatar and other Gulf producers passes through this narrow waterway before reaching open ocean. Any sustained interference with Hormuz transit transforms a regional conflict into a global energy supply event almost instantly.
What Asian LNG Benchmark Prices Are Telling Us in Mid-2026
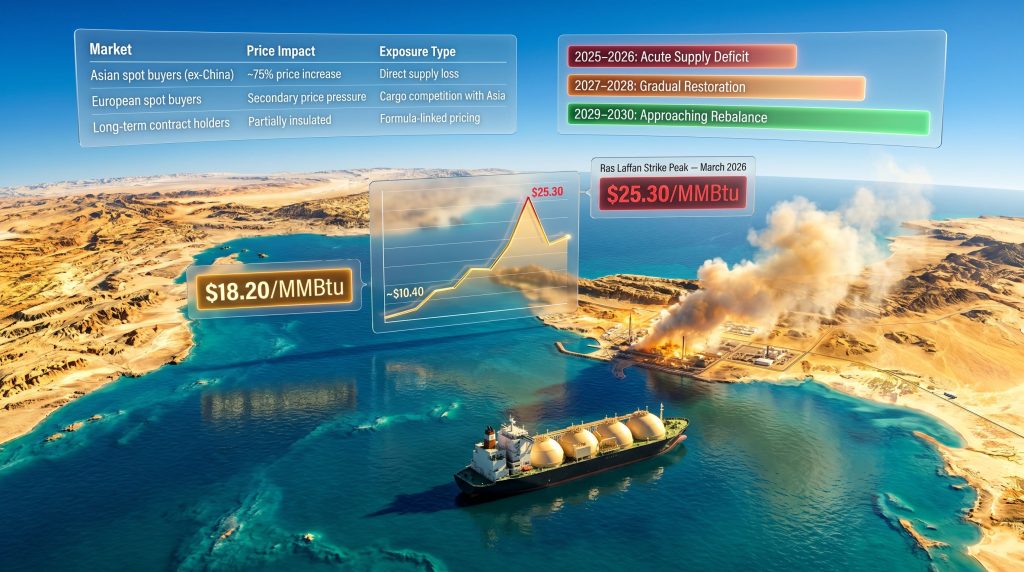
The numbers arriving from Asian spot markets in mid-2026 are stark. Asian LNG benchmark prices have risen approximately 75% from their pre-conflict baseline, reaching $18.20 per MMBtu as of June 2026, according to LSEG market data reported via Reuters and Mining Weekly. According to an Uniper executive speaking at the S&P Global Energy conference, further price increases remain a credible risk given the structural nature of the current supply disruption.
The most acute moment came in March 2026, when a strike on Qatar's Ras Laffan facility drove spot prices to $25.30 per MMBtu, the highest level recorded since December 2022. The table below contextualises this price movement across the current cycle:
| Price Event | Price Level ($/MMBtu) | Timeframe |
|---|---|---|
| Pre-war Asian LNG benchmark (implied) | ~$10.40 | Pre-2026 conflict |
| Post-Ras Laffan strike peak | $25.30 | March 2026 |
| Current Asian spot price | $18.20 | June 2026 |
| All-time record high | $70.50 | August 2022 |
The March spike is a reminder of how quickly physical supply fears can overwhelm financial hedging positions. Ras Laffan is not simply a facility; it is a node through which a substantial portion of globally traded LNG passes. Damage to it removes supply that cannot be quickly replaced from alternative sources because spare liquefaction capacity globally is limited, and new trains take years to commission.
Critically, while $25.30 per MMBtu is alarming in isolation, it remains well below the August 2022 record of $70.50 per MMBtu, reached when European demand destruction, aggressive Russian supply curtailments, and intense global competition for flexible spot cargoes converged simultaneously. That historical precedent matters for understanding the ceiling of what current markets could theoretically face if conditions deteriorate further.
Why Asian LNG Buyers Outside China Are Most Exposed
The distribution of pain across Asia is uneven in ways that reveal important structural features of the market. Senior energy industry executives, including Uniper's Chief Executive for the Middle East John Roper, speaking at the S&P Global Energy Middle East Petroleum and Gas Conference in London in June 2026, indicated that the supply disruption impact has fallen disproportionately on Asian LNG-importing nations outside China.
Several factors explain this divergence:
- Contract structure: China has historically negotiated a larger proportion of its LNG supply under long-term oil-indexed contracts, which insulate buyers from spot price swings, at least partially.
- Alternative supply access: Chinese national energy companies maintain more diversified supply portfolios, including pipeline gas from Russia and Central Asia, which reduces spot market dependency.
- Storage capacity: China's domestic gas storage infrastructure, while still developing, provides meaningful buffer capacity that smaller Asian economies lack.
- Spot market exposure: Countries such as Japan, South Korea, Taiwan, and several Southeast Asian nations source a meaningful share of their LNG requirements through short-term and spot market purchases, directly absorbing price spikes.
The result is a two-speed Asia, where the world's largest LNG importer by volume faces a different set of price pressures than its neighbours. For the rest of the region, the 75% price increase from pre-war levels is not an abstraction; it translates directly into electricity generation costs, industrial energy bills, and household utility charges. Furthermore, the LNG supply outlook through 2025 had already flagged this structural disparity in Asian buyer resilience as a key risk variable.
Europe's Delayed Exposure: The Storage Refill Risk
At first glance, Europe appears less affected than Asia. This is partially accurate: European buyers have not experienced the same direct supply loss as Asian importers who relied heavily on Gulf LNG volumes. However, framing this as European insulation misunderstands how globally integrated LNG markets function.
When Asian spot prices exceed European prices by a wide enough margin, flexible LNG cargoes that would ordinarily flow toward European regasification terminals are redirected eastward by cargo owners seeking the best netback. This tightens European supply indirectly, pushing European gas hub prices higher even without any direct supply disruption affecting Europe. Consequently, the trade war impacts layered on top of the conflict have further complicated European procurement strategies for the remainder of 2026.
| Market | Approximate Price Impact | Primary Exposure Type |
|---|---|---|
| Asian spot buyers (ex-China) | ~75% price increase | Direct supply loss |
| European spot buyers | Secondary price pressure | Cargo competition with Asia |
| Long-term contract holders | Partially insulated | Formula-linked pricing |
The more acute near-term risk for Europe involves the intersection of seasonal dynamics. European gas storage facilities typically require intensive refilling during summer months ahead of winter heating demand. If this injection season coincides with a period of peak Asian summer cooling demand, compressed spot cargo availability, and continued Gulf supply constraints, the competitive pressure for flexible LNG cargoes could push European hub prices significantly above their current levels.
"If Asian heatwave conditions, reduced spot cargo availability, and accelerated European storage refill requirements align simultaneously, market conditions could become materially more stressed than current price levels suggest."
This is precisely the scenario that Uniper's John Roper highlighted as a credible upside risk in his June 2026 conference remarks. The convergence of multiple demand drivers competing for a constrained spot cargo pool is what drove the 2022 price record, and the structural preconditions for a similar dynamic are present in 2026.
The Supply Gap Through 2030: What the Closure of Hormuz Actually Removed
Perhaps the least appreciated aspect of the current disruption is its duration. The closure of the Strait of Hormuz, combined with damage to Gulf LNG export facilities, effectively removed most of the anticipated LNG supply growth from 2025 and 2026 from the global market. This is not a temporary cargo rerouting problem; it is a multi-year supply deficit that fundamentally alters the market's demand-supply balance. The oil market disruption running in parallel has compounded the energy cost pressures facing importing nations across both regions.
| Period | Market Condition | Key Driver |
|---|---|---|
| 2025-2026 | Acute supply deficit | Hormuz closure and facility damage |
| 2027-2028 | Gradual supply restoration | New project commissioning |
| 2029-2030 | Approaching rebalance | Full new capacity contribution |
| Post-2030 | Structural normalisation | Demand-supply equilibrium |
New LNG liquefaction projects already under construction and scheduled to begin commissioning in 2027 and 2028 are expected to progressively restore supply balance. These include large-scale projects in the United States, Canada, and Africa, where Gulf-region geopolitics have no direct operational impact.
However, the medium-term recovery trajectory depends on several variables that are not within market participants' control:
- Whether the Gulf supply disruption extends or deepens before new project volumes arrive.
- The pace of demand growth across Asia, particularly in emerging LNG importers such as Vietnam, the Philippines, and Bangladesh.
- Whether European demand management and efficiency improvements reduce the region's competitive bidding pressure on spot cargoes.
- The operational ramp-up timeline of new liquefaction trains, which historically run behind schedule.
The next major ASX story will hit our subscribers first
Scenario Analysis: How High Could LNG Prices Go?
Investors and energy planners are working through three credible price scenarios for the remainder of 2026 and into 2027.
Scenario 1: Base Case
Supply disruptions stabilise at current levels, new project announcements provide forward market confidence, and seasonal demand peaks are manageable. Prices ease gradually from current levels toward the mid-teens ($/MMBtu) by late 2026 as market participants adjust.
Scenario 2: Stress Case
An Asian summer heatwave drives record cooling demand across Japan, South Korea, and Southeast Asia simultaneously. European storage operators accelerate purchases to meet refill targets ahead of a projected cold winter. Spot cargo availability contracts sharply. Prices revisit or exceed the March 2026 high of $25.30 per MMBtu.
Scenario 3: Tail Risk
Additional strikes on Gulf LNG infrastructure, or a further escalation affecting Hormuz transit, remove incremental supply volumes from an already deficit market. Combined with either of the demand pressures from Scenario 2, prices could move toward the $40-50 per MMBtu range. Reaching the 2022 record of $70.50 per MMBtu would require a convergence of extreme factors not yet visible in current market data, but the 2022 experience demonstrates that such convergence is not impossible.
"The August 2022 record of $70.50/MMBtu was not the result of a single shock but of multiple compounding pressures arriving in rapid succession. The structural preconditions for a similar compounding effect exist in 2026, even if baseline probabilities favour a more moderate outcome."
The Structural Vulnerabilities the Iran War Has Laid Bare
Beyond the immediate price dynamics, the current crisis has exposed several architectural weaknesses in the global LNG trade that deserve attention from both policymakers and investors. Research published by the Oxford Institute for Energy Studies on the Iran war's disruption to LNG has reinforced these concerns across a number of dimensions.
Geographic concentration of liquefaction capacity: A disproportionate share of globally traded LNG originates from a small number of geographic clusters, with the Persian Gulf representing the most significant single concentration risk. This is partly a function of geology: the world's largest natural gas fields are heavily concentrated in Iran, Qatar, and Russia.
The spot market amplification effect: LNG spot markets represent a relatively small proportion of total traded volumes, since the majority of LNG trade occurs under long-term contracts. However, spot prices act as the marginal price signal for the entire market. When spot volumes tighten, the price signal is amplified well beyond what the volume change alone would suggest.
Regasification bottlenecks: Even when alternative supply sources are theoretically available, receiving countries need sufficient regasification terminal capacity to process increased volumes. Several European and Asian nations commissioned floating storage and regasification units (FSRUs) rapidly after the 2022 crisis, but capacity constraints remain a binding factor in specific markets.
Shipping rate co-movement: During supply disruption events, LNG tanker charter rates typically rise sharply alongside cargo prices as demand for vessels increases. This creates a compounding cost effect for end buyers, particularly those without dedicated long-term shipping arrangements.
Energy Security Strategies in a Structurally Volatile LNG Market
The Iran war's impact on LNG prices has accelerated conversations about energy security that were already underway following the 2022 Russia-Ukraine crisis. Both Asian and European governments are reassessing the adequacy of their strategic gas reserve frameworks, long-term contract portfolios, and infrastructure investment pipelines. In addition, the broader oil price movements accompanying this period have placed additional fiscal pressure on energy-importing governments managing multiple commodity cost increases simultaneously.
For Asian importers, the primary strategic response involves diversifying away from Gulf supply concentration through:
- Accelerating long-term offtake agreements with North American and East African LNG projects.
- Expanding domestic gas storage infrastructure to extend buffer capacity during supply disruptions.
- Investing in demand-side flexibility through fuel switching capability in power generation.
- Deepening bilateral energy security arrangements with alternative supplier countries.
For European buyers, the challenge is layered. Post-Russia energy transition investments have already reduced pipeline gas dependency, but the LNG import infrastructure built as a replacement is now subject to the same global price volatility dynamics that were theoretically being avoided by moving away from Russian supply.
The investment case for LNG infrastructure expansion, including both liquefaction in producing countries and regasification in importing nations, has strengthened considerably in a world where Uniper LNG prices volatility Iran war Asia Europe dynamics are likely to remain elevated through at least 2030. Projects that looked marginal at $10 per MMBtu become substantially more compelling in a sustained $15-20 per MMBtu environment.
FAQ: LNG Prices, the Iran War, and Global Gas Market Volatility
What is causing LNG prices to rise in 2026?
The primary driver is the disruption of Gulf LNG supply routes through the closure of the Strait of Hormuz and damage to Qatar's Ras Laffan export facility during the Iran war, which removed most anticipated 2025-2026 supply growth from the market.
How does the Strait of Hormuz closure affect global LNG supply?
The strait is the primary transit route for LNG tankers departing Qatar and other Gulf producers. Its closure prevents these vessels from reaching open ocean, blocking a significant share of globally traded LNG from reaching buyers in Asia and Europe.
Why are Asian LNG buyers more affected than European buyers?
Asian importers outside China have higher spot market dependency and fewer alternative supply options than European buyers, who had already diversified away from some supply concentrations following the 2022 Russia-Ukraine energy crisis.
When will LNG prices stabilise after the Iran conflict disruptions?
New liquefaction capacity scheduled for commissioning in 2027 and 2028 is expected to progressively restore market balance, with genuine structural normalisation likely not arriving before 2029-2030.
What was the highest LNG price ever recorded, and could it be exceeded?
The all-time high of $70.50 per MMBtu was reached in August 2022. Exceeding this level would require a compounding of multiple simultaneous adverse factors, including additional infrastructure strikes, extreme Asian heat demand, and a European storage deficit arriving in the same market window.
How does Ras Laffan fit into global LNG supply infrastructure?
Ras Laffan Industrial City in Qatar is one of the world's largest integrated LNG export complexes, processing gas from the North Field, the single largest natural gas reservoir on earth. Damage to this facility removes supply volumes that have no near-term equivalent replacement source.
Key Takeaways: LNG Price Volatility in the Iran War Era
- Asian LNG spot prices have risen approximately 75% from pre-conflict levels, reaching $18.20/MMBtu in mid-2026, according to LSEG data.
- The March 2026 strike on Qatar's Ras Laffan facility drove prices to $25.30/MMBtu, the highest reading since December 2022.
- The all-time record of $70.50/MMBtu set in August 2022 remains the benchmark for extreme stress scenarios, demonstrating the ceiling that compounding shocks can reach.
- Asian importers outside China face the most direct price exposure due to higher spot market dependency and limited alternative supply access.
- Europe faces secondary but meaningful exposure through global cargo competition, particularly during the summer storage injection season.
- Supply disruptions are expected to weigh on the market until at least 2030, when new project capacity from 2027-2028 commissioning cycles reaches full contribution.
- The convergence of Asian summer cooling demand, European storage refill pressure, and continued Gulf supply constraints represents the primary upside price risk for Uniper LNG prices volatility Iran war Asia Europe through the remainder of 2026.
This article is intended for informational purposes only and does not constitute financial or investment advice. LNG price forecasts and market scenarios involve significant uncertainty, and actual market outcomes may differ materially from those described. Readers should consult qualified financial and energy market advisers before making investment or procurement decisions based on commodity price projections.
Want to Track the Commodity Opportunities Emerging From Global Energy Disruptions?
Discovery Alert's proprietary Discovery IQ model delivers real-time alerts on significant ASX mineral discoveries, instantly translating complex market data into actionable insights for investors navigating volatile commodity environments like those reshaping LNG and energy markets in 2026. Explore historic examples of major discovery returns and begin your 14-day free trial to position yourself ahead of the broader market.