
June 30, 2026
Understanding the Current Maritime Crisis: Unique Characteristics of Modern Strait of Hormuz Disruption
The global energy transportation system faces unprecedented challenges as maritime chokepoints evolve from passive obstacles to active conflict zones. The strait of Hormuz traffic restoration has become a critical priority for global markets as the current crisis differs fundamentally from historical precedents. Furthermore, modern shipping disruptions require completely different risk assessment frameworks compared to previous maritime incidents, particularly when military targeting of commercial vessels creates psychological barriers that extend far beyond physical blockades.
Critical Differentiating Factors in Current Crisis:
- Active threat environment: Unlike weather-related delays or mechanical blockages, vessels face direct military targeting
- Insurance market collapse: War risk premiums have surged to over 1000 basis points above normal levels
- Coordinated carrier withdrawal: Major shipping lines have simultaneously suspended operations
- Infrastructure damage: Regional LNG facilities remain offline pending repairs
The current situation represents a fundamental shift from historical maritime disruptions. The 1973 Yom Kippur War involved supply-side production cuts, while the 1990-1991 Gulf War created temporary port closures. Today's crisis involves real-time threat assessment requirements where vessels need active military escort and surveillance protection.
In addition, market analysts are closely monitoring US oil production decline factors that could compound the current supply chain challenges. The complexity of this situation has led to unprecedented oil price movements as traders attempt to price in multiple risk scenarios.
Market Response Data (March 12, 2026):
- ICE Brent Crude: $100.01/barrel (8.7% increase, $8.03/barrel gain)
- Peak intraday high: $101.59/barrel
- April NYMEX WTI: $94.40/barrel (8.2% increase)
Iraq's decision to halt operations at all oil ports following a tanker attack in territorial waters exemplifies how regional infrastructure targeting creates cascading effects throughout the energy supply chain. The psychological impact extends beyond physical damage, as evidenced by the complete withdrawal of major shipping operators despite limited actual vessel losses.
Current Port Operational Status:
| Facility Type | Operational Capacity | Primary Constraint |
|---|---|---|
| UAE ports | 85% | Security concerns |
| Saudi terminals | 70% | Security protocols |
| Qatari LNG facilities | Offline | Infrastructure repairs |
The insurance market dysfunction represents a critical distinction from previous crises. Lloyd's of London syndicate participation remains essential for normal operations, yet current war risk coverage remains unavailable at standard terms, creating operational gridlock independent of physical blockade conditions.
Diesel Price Impact Analysis:
US retail diesel prices experienced their largest weekly increase on record, rising nearly $1.00 per gallon in the week ending March 9, 2026. This surge reflects the immediate downstream effects of transportation route disruptions on refined product markets.
When big ASX news breaks, our subscribers know first
Strategic Scenario Modeling: Three Potential Restoration Pathways
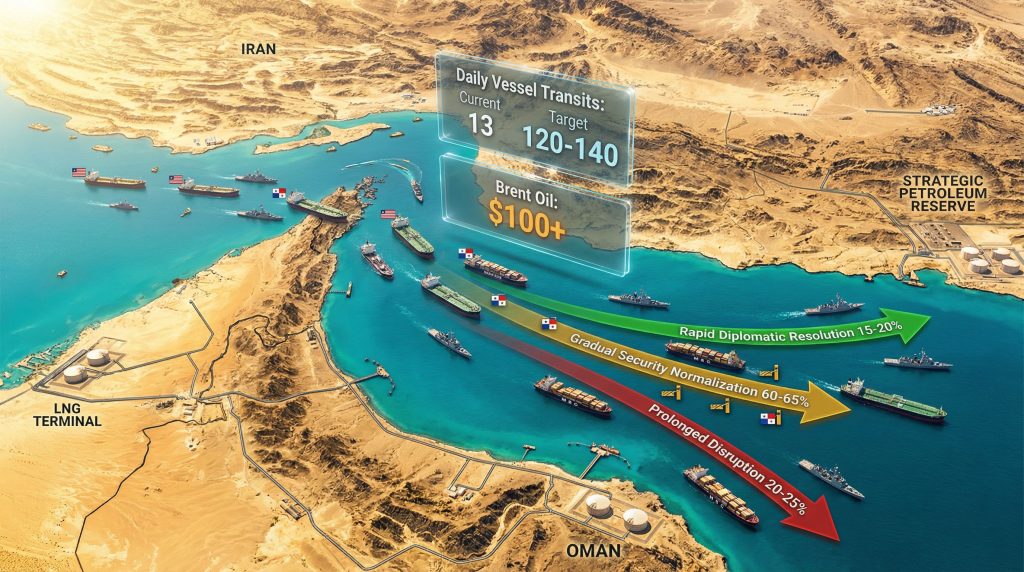
Strategic scenario modeling reveals three distinct pathways for strait of Hormuz traffic restoration, each carrying different probability weightings and timeline expectations. Current market pricing at $100.01/barrel for Brent crude suggests traders are positioning between moderate and prolonged disruption scenarios rather than anticipating rapid resolution.
Scenario A: Rapid Diplomatic Resolution (15-20% Probability)
This pathway assumes comprehensive ceasefire agreements within 2-4 weeks, supported by international naval escort commitments and immediate insurance market re-engagement. Success requires unprecedented diplomatic coordination and military de-escalation.
Key Prerequisites:
- Ceasefire agreement between all conflicting parties
- Coalition naval presence commitment (minimum 12-15 vessels)
- Insurance syndicate participation restoration
- Vessel repositioning from alternative routes
Economic Implications:
- Oil prices stabilise at $85-90/barrel range
- LNG spot prices normalise within 30 days
- Container shipping rates decrease 40-60% from current elevated levels
Scenario B: Gradual Security Normalisation (60-65% Probability)
The most likely pathway involves phased reopening over 6-12 weeks with enhanced security protocols and selective vessel category prioritisation. This approach balances operational necessity with risk management requirements.
Implementation Characteristics:
- Phased reopening with limited vessel categories initially
- Enhanced security protocols including convoy systems
- Selective insurance coverage restoration with elevated premiums
- Partial traffic restoration achieving 30-50% of normal volumes
Market Dynamics:
- Extended price volatility across energy commodities
- Structural shift toward alternative shipping routes
- Long-term insurance premium increases (400-500 basis points target)
Harold Hamm, founder and chairman of Continental Resources, provided industry perspective on restoration timelines, indicating that whilst resolution efforts will proceed rapidly, the process may require several weeks. He emphasised that market focus on $100/barrel oil prices understates the real concern, warning that prices reaching $200/barrel would create severe global economic disruption.
Scenario C: Prolonged Disruption with Structural Changes (20-25% Probability)
Extended disruption lasting 3-6 months would trigger permanent alterations in global shipping patterns and accelerated development of alternative transportation infrastructure. This scenario would significantly delay strait of Hormuz traffic restoration efforts.
Structural Features:
- Permanent traffic reduction through Hormuz strait
- Accelerated pipeline capacity development
- Investment in Red Sea and Suez Canal infrastructure
- Long-term shipping route optimisation
Strategic Petroleum Reserve Implementation:
President Trump's administration authorised a 172 million barrel drawdown from the US Strategic Petroleum Reserve over 120 days, representing a sustained discharge rate of 1.4 million barrels per day. This exceeds the 1.2 million barrel per day peak achieved during the 2022 Biden administration release, testing SPR infrastructure capabilities.
International Coordination Structure:
The International Energy Agency coordinated release represents 400 million barrels across 32 member nations, with specific commitments including:
- United States: 172 million barrels over 120 days
- Japan: 80 million barrels starting March 16, 2026
- United Kingdom: 13.5 million barrels confirmed
Critical Success Factors for Maritime Traffic Restoration
Successful strait of Hormuz traffic restoration depends on synchronised military, insurance, and operational infrastructure components. Each element requires specific performance thresholds to achieve sustainable commercial shipping resumption.
Military and Security Infrastructure Requirements
Naval Escort Specifications:
- Coalition naval presence: Minimum 12-15 vessels maintained continuously
- Air defence coverage: 24/7 surveillance and interception capability
- Communication protocols: Real-time threat assessment and vessel guidance systems
The French government, through President Emmanuel Macron's statements, established that traffic restoration missions will proceed only once the strait no longer functions as an active war zone. This political framework creates clear military prerequisites for commercial operations resumption.
Consequently, the current security situation has implications beyond the immediate region, with Saudi exploration licenses potentially being impacted by the broader regional instability affecting energy markets.
Insurance Market Recovery Mechanisms:
Current war risk premiums exceed 1000 basis points above normal levels, with major insurers requiring a 30-day conflict-free period before standard underwriting processes resume. Lloyd's syndicate participation remains essential for normal commercial operations, creating a binary trigger point for industry restoration.
Target Premium Normalisation Timeline:
| Phase | Duration | War Risk Premium | Coverage Availability |
|---|---|---|---|
| Current | Ongoing | 1000+ basis points | Limited/Suspended |
| Phase 1 | Weeks 1-4 | 400-500 basis points | Escorted vessels only |
| Phase 2 | Weeks 5-12 | 200-300 basis points | Graduated expansion |
| Phase 3 | Weeks 13+ | 100-150 basis points | Near-normal terms |
Vessel Repositioning and Fleet Management
Current Displacement Analysis:
- Tanker fleet: 180-220 vessels currently in alternative employment
- Container ships: 45-60 day timeline required for route switching
- LNG carriers: Limited global fleet constrains rapid restoration capabilities
The vessel repositioning challenge extends beyond simple route changes. Ships deployed to Cape of Good Hope routing require 14-18 additional days per voyage with extra fuel costs of $180,000-$250,000 per large tanker. These economics create significant barriers to rapid fleet redeployment once security conditions improve.
Port Infrastructure Assessment:
Qatar's LNG facilities remain offline pending infrastructure repairs, representing a critical bottleneck for global natural gas supply chains. UAE ports maintain 85% operational capacity whilst Saudi terminals operate at 70% capacity due to enhanced security protocols.
US Energy Secretary Chris Wright emphasised the logistics dimension of restoration efforts, noting that oil supply needs are geographically specific, with refineries in Europe and Asia requiring targeted supply allocation strategies rather than general market intervention.
Alternative Transportation Routes and Economic Impact Analysis
Alternative routing strategies reveal the economic pressures driving restoration timeline urgency. Current shipping diversions create substantial cost penalties whilst testing global transportation infrastructure capacity limits.
Cape of Good Hope Routing Economics
Additional Voyage Costs:
- Extra fuel consumption: $180,000-$250,000 per large tanker
- Extended voyage time: 14-18 additional days
- Port congestion delays: 3-7 days average waiting time
- Weather-related delays: 15-20% higher during winter months
Capacity Constraints:
- Maximum additional daily throughput: 2.5-3.0 million barrels
- Infrastructure bottlenecks: South African port limitations
- Seasonal weather impacts: Winter routing carries higher delay risks
Suez Canal Alternative Capacity
The Suez Canal operates at 85-90% utilisation with diverted traffic, approaching 95% maximum sustainable capacity without significant delays. Egypt benefits from premium pricing with 25-30% higher transit fees for expedited passage, generating potential additional revenue of $2.8-3.2 billion annually.
However, experts are monitoring whether this situation affects broader regional decisions, including OPEC production impact strategies as member nations adapt to changing market dynamics.
Revenue Implications for Egypt:
- Transit fee premiums: 25-30% above standard rates
- Additional annual revenue: $2.8-3.2 billion potential
- Infrastructure investment required: $1.5-2.0 billion for capacity expansion
Furthermore, the disruption has accelerated conversations about energy security, with some analysts conducting oil price rally analysis to understand how geopolitical tensions affect long-term pricing trends.
Strategic Petroleum Reserve Deployment and Market Stabilisation
Strategic petroleum reserve releases represent unprecedented international coordination in response to maritime supply disruption. The scale and timeline of deployments reveal expectations for extended market intervention requirements.
International Energy Agency Coordination
The 400 million barrel coordinated release represents the largest emergency stock deployment in IEA history, with unanimous approval from all 32 member states. This coordination mechanism demonstrates the severity assessment among energy-importing nations.
Market Impact Modelling:
- Price suppression effect: $8-12 per barrel reduction potential
- Duration of impact: 90-120 days based on historical precedents
- Refill strategy timeline: 12-18 months post-crisis resolution
US SPR Technical Implementation:
The 172 million barrel drawdown requires sustained discharge rates of 1.4 million barrels per day over 120 days. This exceeds previous maximum capacity, as the 2022 Biden release peaked at 1.2 million barrels per day and resulted in tens of millions of dollars in infrastructure repairs.
Current SPR Status:
- Total holdings: 415.4 million barrels
- Capacity utilisation: 58% of authorised 714 million barrel capacity
- Planned drawdown: 172 million barrels (41.4% of current holdings)
Regional Strategic Reserve Utilisation
Asia-Pacific Emergency Stock Capabilities:
- South Korea: 96-day import coverage available
- India: 74-day strategic reserve capacity
- China: Estimated 90-100 day coverage (official data limited)
Japan's commitment to release 80 million barrels starting March 16, 2026, combines government and privately-held reserves, demonstrating public-private coordination in emergency response mechanisms.
Shipping Industry Structural Transformation
The current crisis accelerates existing shipping industry consolidation trends whilst creating new competitive dynamics favouring regional operators and specialised service providers.
Container Shipping Market Dynamics
Market Concentration Effects:
- Major carrier withdrawal creates capacity gaps across key trade routes
- Regional operators gain market share opportunities previously dominated by global carriers
- Charter rates increase 200-300% for available capacity
Route Optimisation Strategies:
- Permanent shift to Cape routing for 15-25% of Asia-Europe trade volume
- Investment in larger vessel classes for efficiency gains on extended routes
- Hub-and-spoke model expansion in alternative regions
Energy Transportation Evolution
LNG Carrier Fleet Implications:
- Global fleet utilisation: Currently 95%+ due to longer voyage times
- Newbuild orders acceleration: 40-50 vessels contracted in Q1 2026
- Charter rates: $200,000-$300,000/day (300% above normal)
Crude Tanker Market Dynamics:
- VLCC rates: $80,000-$120,000/day (400% increase from baseline)
- Suezmax premium: 250% above normal rates
- Floating storage economics: Extended voyages make storage economically viable
In addition, recent reports from AP News regarding Iranian shipping operations provide additional context on the complex maritime dynamics affecting strait of Hormuz traffic restoration efforts.
The next major ASX story will hit our subscribers first
Long-term Geopolitical and Infrastructure Implications
Strategic infrastructure development accelerates as nations reassess energy security assumptions and supply chain vulnerabilities exposed by current disruptions.
Energy Security Architecture Transformation
Strategic Partnership Evolution:
- US-Gulf state cooperation: Deepening military and commercial ties
- European energy diversification: Accelerated non-Middle East sourcing
- Asian buyer coalitions: Formation for enhanced negotiating power
Infrastructure Investment Priorities:
- Trans-Arabian Pipeline: Capacity expansion projects
- East-West Pipeline development: Saudi Arabia internal routing
- Alternative pipeline projects: Turkmenistan-Afghanistan-Pakistan-India revival
Maritime Security Framework Development
International Cooperation Mechanisms:
- Combined Maritime Forces: Operational expansion and mandate extension
- Regional naval agreements: Burden-sharing arrangements
- Commercial vessel protection: Standardised security protocols
Technology Integration Priorities:
- Autonomous vessel deployment: High-risk transit applications
- Satellite-based threat detection: Real-time monitoring systems
- Blockchain cargo tracking: Security verification protocols
The situation has prompted detailed analysis from maritime security experts, with Lloyd's List providing comprehensive coverage of the ongoing shipping disruptions and their implications for global trade patterns.
Recovery Timeline and Performance Benchmarks
Restoration success requires measurable benchmarks across multiple dimensions, with specific targets for traffic volume, pricing normalisation, and insurance market functionality.
Phase 1: Immediate Stabilisation (Weeks 1-4)
Performance Targets:
- Traffic restoration: 25% of normal vessel transit levels
- Price targets: Brent crude below $95/barrel sustained
- Insurance coverage: Limited availability for escorted vessels
Success Indicators:
- Daily vessel transits increase from current 13 vessels to 40-50 vessels
- War risk premiums decline to 400-500 basis points above normal
- Major shipping lines announce conditional service resumption
Phase 2: Operational Normalisation (Weeks 5-12)
Performance Targets:
- Traffic restoration: 60-70% of pre-crisis levels
- Price targets: Oil prices stabilise in $80-85/barrel range
- Insurance market: Graduated premium reduction begins
Operational Benchmarks:
- Daily transits reach 120-140 vessels (approaching normal levels)
- LNG spot prices decline to $25-30/MMBtu in Asian markets
- Container shipping rates decrease 40-60% from peak crisis levels
Phase 3: Full Recovery (Weeks 13-24)
Performance Targets:
- Traffic restoration: 90%+ of pre-crisis levels achieved
- Price normalisation: Return to fundamental-driven pricing
- Insurance normalisation: Near-normal premium levels restored
Long-term Success Metrics:
| Recovery Metric | Current Status | 4-Week Target | 12-Week Target |
|---|---|---|---|
| Daily Vessel Transits | 13 | 40-50 | 120-140 |
| Oil Price (Brent) | $100+ | $90-95 | $80-85 |
| LNG Spot Price (Asia) | $45-50/MMBtu | $25-30/MMBtu | $18-22/MMBtu |
| War Risk Premium | 1000+ bps | 400-500 bps | 100-150 bps |
Critical Success Dependencies
The restoration of Strait of Hormuz traffic depends on synchronised progress across military security provision, insurance market normalisation, and operational infrastructure readiness. Whilst multiple timeline scenarios remain viable, the most probable pathway involves gradual normalisation over 6-12 weeks, fundamentally reshaping global energy transportation markets during the recovery process.
Market Intelligence Note: This analysis incorporates real-time market data and expert assessments from energy industry sources. Readers seeking additional perspectives on Middle Eastern energy market developments can explore specialised maritime and commodity intelligence services for complementary analysis.
Disclaimer: This article contains forward-looking statements and scenario analysis based on current market conditions and expert assessments. Actual outcomes may differ materially from projected scenarios due to geopolitical developments, market dynamics, and operational factors beyond current analysis scope. Investment and operational decisions should incorporate additional risk assessment and professional advisory consultation.
Looking to capitalise on energy market volatility and geopolitical developments?
Discovery Alert's proprietary Discovery IQ model delivers real-time alerts on significant energy and commodities discoveries, instantly empowering subscribers to identify actionable opportunities ahead of the broader market during periods of heightened volatility. Begin your 14-day free trial today and secure your market-leading advantage when traditional supply chains face unprecedented disruption.