
July 19, 2026
Understanding the Strategic Importance of Maritime Energy Chokepoints
Global energy security hinges on a network of narrow waterways that channel massive flows of oil and natural gas across international markets. These strategic maritime passages represent critical vulnerabilities where geopolitical tensions can instantly cascade into economic disruption, affecting energy prices and supply chains worldwide. When examining Strait of Hormuz oil disruption scenarios, the concentration of energy transit through these bottlenecks creates systemic risks that extend far beyond regional conflicts.
The modern energy infrastructure depends heavily on predictable shipping routes through constrained geographic corridors. When these pathways face disruption, alternative routing options often prove inadequate to handle the massive volumes typically flowing through primary channels. Understanding these dynamics becomes essential for assessing global energy market stability and preparing for potential supply chain interruptions.
When big ASX news breaks, our subscribers know first
What Makes the Strait of Hormuz So Critical to Global Energy Security?
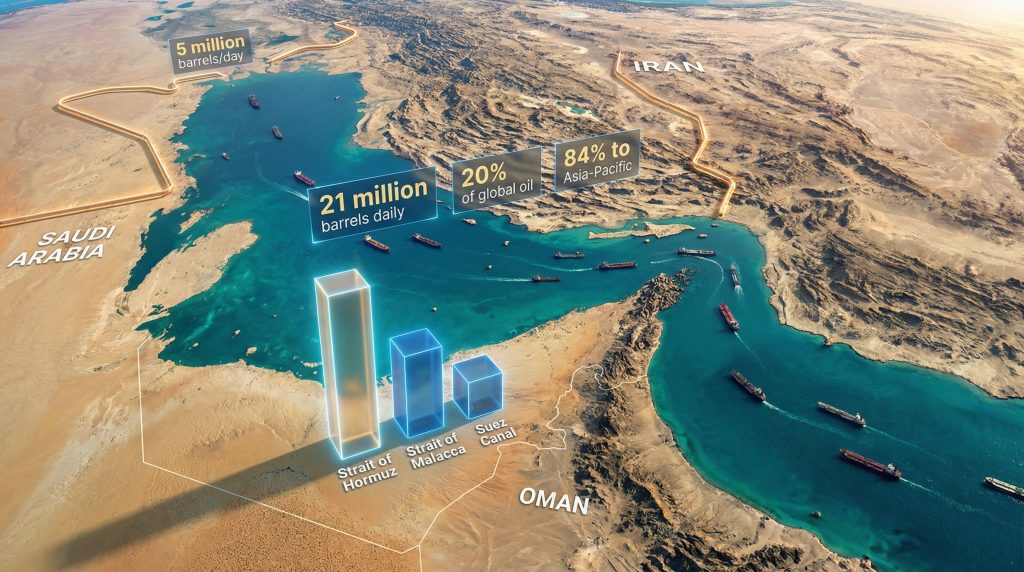
The Persian Gulf's narrow exit represents one of the world's most strategically important energy transit points, handling approximately 21 million barrels of oil daily – roughly 20% of global petroleum shipments. This concentration creates an unavoidable dependency for major energy-importing nations, particularly across the Asia-Pacific region.
Furthermore, recent geopolitical tensions have highlighted the vulnerability of this critical waterway, as demonstrated by escalating tensions over potential closures affecting global oil markets.
Table: Global Oil Chokepoint Comparison
| Chokepoint | Daily Oil Transit | Global Share | Primary Destinations |
|---|---|---|---|
| Strait of Hormuz | 21 million barrels | 20% | Asia-Pacific (84%) |
| Strait of Malacca | 16 million barrels | 15% | China, Japan, India |
| Suez Canal | 5.5 million barrels | 5% | Europe, North America |
| Bab el-Mandab | 4.8 million barrels | 4.5% | Europe, Asia |
Geographic Bottleneck Analysis
The Strait of Hormuz spans just 21 miles at its narrowest point, creating an unavoidable concentration of energy flows with limited manoeuvring space for large tanker vessels. This geographic constraint means that even temporary disruptions can create immediate bottlenecks affecting global energy markets.
Key Physical Characteristics:
- Minimum width: 21 miles (34 kilometres)
- Shipping lanes: Two 2-mile-wide channels separated by a 2-mile buffer zone
- Average depth: 200-300 feet in shipping channels
- Daily vessel traffic: 15-20 large tankers plus smaller vessels
Regional Production Dependencies
Persian Gulf nations collectively account for approximately 30% of global crude oil production, with the majority requiring Strait of Hormuz transit to reach international markets. This concentration amplifies the strategic importance of maintaining open shipping lanes through the region.
Major Persian Gulf Producers:
- Saudi Arabia: 11.5 million barrels/day production capacity
- UAE: 4.2 million barrels/day production capacity
- Kuwait: 2.8 million barrels/day production capacity
- Qatar: 1.8 million barrels/day production capacity
- Iran: 3.8 million barrels/day production capacity
How Do Supply Chain Disruptions Cascade Through Energy Markets?
Energy market disruptions follow predictable patterns as initial supply concerns amplify through interconnected trading systems. The speed and magnitude of price responses depend on factors including storage levels, alternative supply availability, and market sentiment regarding disruption duration.
Immediate Price Volatility Mechanisms
Market Response Timeline:
- Hours 1-6: Futures markets react to news flow with immediate price spikes
- Day 1-3: Physical market premiums emerge as spot buyers compete for available cargoes
- Week 1-2: Storage capacity constraints develop as facilities reach maximum levels
- Month 1+: Alternative supply routes reach capacity limitations
Historical data shows that Strait of Hormuz oil disruption events typically trigger immediate price increases of 10-25% in crude oil futures, with sustained disruptions potentially doubling these impacts as storage buffers become depleted. Moreover, comprehensive oil futures analysis reveals how these disruptions create lasting volatility patterns across global markets.
Regional Market Segmentation Effects
Different geographic markets experience varying degrees of impact based on their supply chain dependencies and available alternatives. Asia-Pacific nations face the most severe exposure due to their heavy reliance on Persian Gulf crude imports.
Asia-Pacific Vulnerability Assessment:
- China: 43% of crude imports via Strait of Hormuz (4.3 million barrels/day)
- India: 62% of crude imports via Strait of Hormuz (2.8 million barrels/day)
- Japan: 87% of crude imports via Strait of Hormuz (2.4 million barrels/day)
- South Korea: 70% of crude imports via Strait of Hormuz (1.9 million barrels/day)
What Alternative Supply Routes Exist During Disruptions?
Several land-based pipeline systems provide partial alternatives to maritime transit, though with significant capacity limitations compared to normal Strait of Hormuz throughput volumes. These alternatives can partially offset disruptions but cannot fully replace the massive volumes typically transiting the waterway.
Pipeline Bypass Capacity Analysis
Regional Pipeline Infrastructure:
- Saudi East-West Pipeline: 5 million barrels/day capacity (connects Eastern Province to Red Sea coast)
- UAE Abu Dhabi Crude Oil Pipeline: 1.5 million barrels/day capacity (bypasses Strait to Fujairah)
- Iraq-Turkey Pipeline: 1.6 million barrels/day capacity (currently operating below capacity)
- Iran-Pakistan Pipeline: Under construction, planned 1 million barrels/day capacity
"Even combined, existing pipeline alternatives can handle only approximately 40% of normal Strait of Hormuz throughput, creating inevitable supply gaps during extended closures."
Strategic Petroleum Reserve Utilisation
Government-controlled emergency stockpiles serve as temporary buffers during supply disruptions, though with finite duration capabilities based on consumption rates and reserve sizes.
Major Strategic Reserve Holdings:
- United States: 650 million barrels (approximately 35 days of total US consumption)
- China: 500 million barrels estimated (approximately 40 days of imports)
- Japan: 320 million barrels (approximately 150 days of imports)
- India: 40 million barrels (approximately 10 days of imports)
- South Korea: 97 million barrels (approximately 30 days of imports)
How Do LNG Markets Respond Differently Than Oil Markets?
Liquefied natural gas supply chains exhibit greater rigidity than oil markets due to specialised terminal requirements, dedicated shipping fleets, and long-term contract structures that limit short-term flexibility during disruptions. Consequently, LNG market insights demonstrate how these structural differences create unique vulnerabilities during transit disruptions.
Infrastructure Inflexibility Challenges
LNG requires specialised cryogenic tankers and dedicated receiving terminals, creating bottlenecks that cannot be quickly substituted with alternative infrastructure. This inflexibility amplifies market impacts during transit disruptions.
Qatar LNG Export Profile:
- Total production capacity: 77 million tonnes/year (approximately 110 billion cubic metres)
- Asia-Pacific destinations: 75% of exports
- European destinations: 18% of exports
- Other markets: 7% of exports
Global LNG Tanker Fleet Constraints:
- Total fleet size: Approximately 650 vessels worldwide
- Qatar-dedicated vessels: 140+ vessels under long-term charter
- Average cargo size: 170,000 cubic metres LNG
- Typical voyage duration: 2-4 weeks depending on destination
Freight Rate Amplification Effects
LNG tanker charter rates experience more dramatic volatility during disruptions due to the specialised vessel requirements and limited global fleet size. Spot charter rates can increase 300-500% during major supply route disruptions, compared to 50-100% increases for crude oil tankers.
What Are the Broader Economic Implications of Energy Chokepoint Closures?
Energy price spikes propagate through multiple economic sectors, creating compounding effects on consumer prices and business costs that extend far beyond direct fuel expenses. However, the impact varies significantly across different commodity markets, as shown by recent natural gas price trends which demonstrate different volatility patterns.
Inflationary Pressure Transmission
Sectoral Impact Hierarchy:
- Transportation: Direct fuel cost increases affecting logistics and passenger transport
- Manufacturing: Input cost pressures from energy-intensive production processes
- Agriculture: Fertiliser price increases and machinery operating cost impacts
- Services: Indirect cost pass-through via increased transportation and utility expenses
Historical analysis shows that a sustained 50% increase in oil prices typically translates to:
- Transportation costs: +15-25% increase within 30 days
- Manufacturing input costs: +8-12% increase within 60 days
- Consumer price index: +1-2% increase within 90 days
- GDP growth impact: -0.3 to -0.8 percentage points annually
Central Bank Policy Response Considerations
Monetary authorities face complex trade-offs when energy-driven inflation intersects with broader economic stability concerns. Supply-driven inflation presents particular challenges since traditional monetary policy tools primarily address demand-side pressures.
Policy Response Framework:
- Phase 1: Monitor for temporary vs. persistent price impacts
- Phase 2: Assess second-round effects on wage and price expectations
- Phase 3: Balance inflation control against economic growth preservation
- Phase 4: Coordinate with fiscal authorities on strategic reserve releases
The next major ASX story will hit our subscribers first
How Do Geopolitical Risk Premiums Affect Long-Term Energy Planning?
Prolonged uncertainty around critical chokepoints influences capital allocation decisions across the energy sector, potentially reshaping global production patterns and infrastructure investment priorities. In addition, the current oil price rally demonstrates how geopolitical tensions can create sustained market premiums.
Investment Decision Framework Changes
Energy companies increasingly incorporate geopolitical risk premiums of $5-15 per barrel in long-term planning models, affecting project economics and regional development priorities. This premium reflects the cost of supply chain vulnerability and influences decisions about alternative route development.
Risk Assessment Factors:
- Historical disruption frequency: Number and duration of past closures
- Regional conflict probability: Ongoing tensions and military capabilities
- Alternative route availability: Capacity and cost of bypass options
- Insurance cost variations: Premium differences across shipping routes
Supply Chain Diversification Strategies
Emerging Alternative Routes:
- Arctic shipping lanes: Seasonal availability, 40% shorter distance to European markets
- Trans-Caspian corridor: Pipeline capacity expansion targeting 2 million barrels/day
- African Atlantic coast: Deep-water production reducing Middle East dependency
- North American pipeline networks: Enhanced capacity linking domestic production to export terminals
What Historical Precedents Inform Current Market Responses?
Previous disruptions provide insights into market adaptation mechanisms, price volatility patterns, and the duration of economic impacts during energy chokepoint closures. Furthermore, detailed analysis from the Energy Information Administration shows how historical disruptions have shaped current contingency planning.
Tanker War Lessons (1980-1988)
During the Iran-Iraq War, 546 merchant vessels were attacked, including 257 tankers, demonstrating the vulnerability of energy transit routes during regional conflicts. Oil prices increased 150% during peak conflict periods, while alternative routing through the Red Sea partially compensated for reduced Gulf transit.
Key Market Adaptations:
- Insurance premiums: Increased 500-1000% for Gulf transit
- Alternative routing: Red Sea traffic increased 300%
- Strategic reserves: Major importers accelerated stockpiling programmes
- Pipeline development: Accelerated construction of bypass infrastructure
Modern Technology Impact Assessment
Recent incidents demonstrate how modern technology creates new vulnerability patterns compared to traditional military threats, with cyber warfare capabilities and precision drone technology enabling targeted infrastructure attacks with minimal resources.
The September 2019 drone attacks on Saudi Aramco facilities temporarily removed 5.7 million barrels/day of production capacity, causing the largest single-day oil price increase (19%) since the 1991 Gulf War, illustrating how precision strikes can create disproportionate market impacts.
How Might Insurance and Shipping Markets Adapt?
Maritime insurance markets rapidly adjust pricing to reflect heightened risk levels, creating additional cost pressures on energy transportation that compound supply chain disruptions.
War Risk Premium Calculations
Insurance Premium Structure:
- Normal operations: 0.05-0.1% of vessel value annually
- Elevated risk periods: 0.5-1.5% of vessel value annually
- Active conflict zones: 2.5-7.5% of vessel value annually
- Vessel replacement cost: $200-300 million for large tankers
These premium increases translate to $1-3 per barrel additional transportation costs during high-risk periods, directly impacting delivered energy prices in importing markets.
Vessel Routing Optimisation
Shipping companies implement dynamic route planning to balance risk exposure against operational efficiency requirements, often accepting 10-15% longer transit times to avoid high-risk zones.
Alternative Routing Impacts:
- Distance penalty: 15-25% longer voyage times via Cape of Good Hope
- Capacity reduction: 20-30% fewer deliveries annually per vessel
- Cost increases: $2-4 per barrel additional transportation expenses
- Market timing: 2-3 week delays affecting supply scheduling
What Long-Term Structural Changes Could Emerge?
Sustained disruption risks may justify previously uneconomical alternative transportation projects and accelerate technological solutions for energy security vulnerabilities. Simultaneously, renewable energy transformations offer potential pathways to reduce dependency on vulnerable transit routes.
Infrastructure Investment Acceleration
Major Pipeline Projects Under Development:
- Trans-Arabian Pipeline expansion: Target capacity 8 million barrels/day
- Iran-Pakistan-India Pipeline: Planned 1.1 million barrels/day
- Eastern Mediterranean Pipeline: Natural gas capacity 10 billion cubic metres/year
- Arctic pipeline networks: Connecting Russian production to European markets
Investment Requirements:
- Total regional pipeline investment: Estimated $180-250 billion over 10 years
- Alternative port facilities: $50-75 billion for expanded Red Sea and Indian Ocean capacity
- Strategic storage expansion: $25-40 billion for increased reserve capacity
Regional Energy Security Policies
National governments reassess strategic reserve policies and domestic production priorities in response to supply vulnerability exposure, potentially accelerating renewable energy adoption and domestic resource development.
Policy Response Trends:
- Strategic reserve targets: Increasing from 90 to 120+ days of import coverage
- Domestic production incentives: Tax benefits and regulatory support for local energy development
- Renewable acceleration: Enhanced targets for energy independence through clean technology
- Regional cooperation: Bilateral agreements for emergency supply sharing
Economic Modelling and Future Scenarios
Advanced economic modelling suggests that extended Strait of Hormuz oil disruption scenarios lasting 6 months or longer could trigger global recession scenarios, with GDP impacts of 2-4% in major importing economies and oil price increases of 100-200% until alternative supply arrangements stabilise.
Scenario Analysis Framework:
- Short-term disruption (1-4 weeks): Manageable through strategic reserves and alternative routing
- Medium-term disruption (1-6 months): Significant economic impacts requiring policy intervention
- Long-term disruption (6+ months): Structural changes in global energy trade patterns
- Permanent closure: Fundamental reshaping of international energy infrastructure
The interconnected nature of modern energy markets means that localised conflicts can instantly become worldwide economic challenges, affecting everything from petrol prices to manufacturing costs across multiple economic sectors.
Understanding these complex dynamics helps stakeholders develop more resilient supply chain strategies and policy frameworks capable of managing energy security challenges in an increasingly interconnected global economy. The concentration of energy flows through strategic chokepoints will likely remain a defining characteristic of international trade, requiring continuous adaptation and risk management across both public and private sectors.
Investment and Policy Implications
For investors and policymakers, the strategic importance of energy chokepoints presents both risks and opportunities across multiple timeframes, from immediate crisis management to long-term infrastructure development and technological innovation in energy security solutions.
In conclusion, Strait of Hormuz oil disruption scenarios represent one of the most significant risks to global energy security, requiring coordinated international responses and substantial investment in alternative infrastructure to mitigate potential impacts on worldwide economic stability.
This analysis is based on publicly available data and industry reports. Energy markets involve significant risks and uncertainties that can affect actual outcomes. Readers should conduct their own research and consult with qualified professionals before making investment or policy decisions.
Looking to Capitalise on Energy Market Volatility?
Discovery Alert's proprietary Discovery IQ model delivers real-time alerts on significant ASX mineral discoveries, including energy commodities that can experience dramatic price movements during geopolitical disruptions like Strait of Hormuz tensions. Subscribers gain immediate access to actionable opportunities in the Australian energy and resources sector, positioning themselves ahead of broader market reactions to global supply chain disruptions. Begin your 14-day free trial today and secure your competitive advantage in volatile energy markets.