
May 12, 2026
Maritime Recovery Patterns Signal Broader Energy Market Transformation
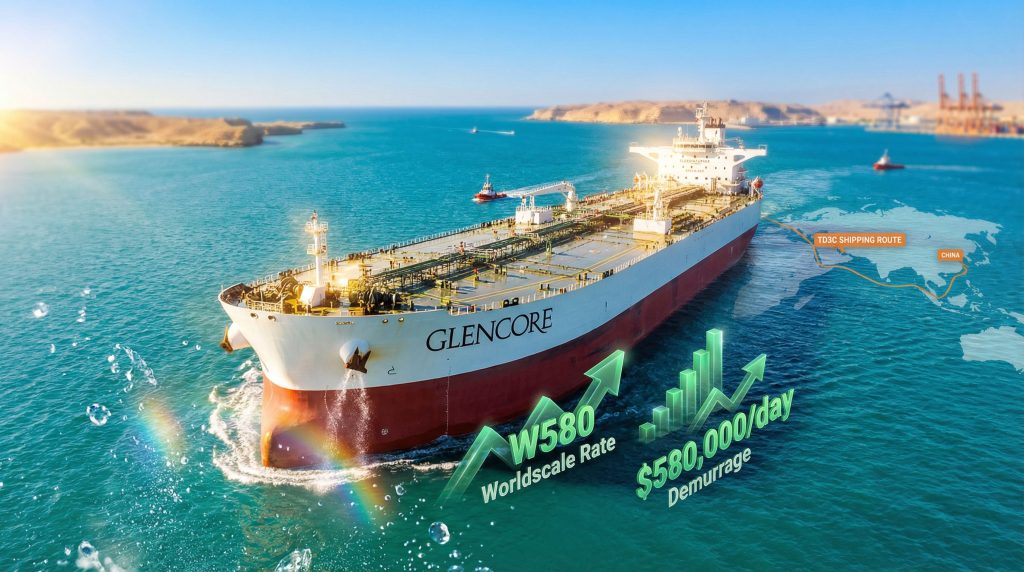
Global energy logistics operates through intricate networks of maritime corridors, tanker fleets, and trading relationships that can rapidly shift during periods of geopolitical instability. When major shipping routes face disruption, the recovery phase often reveals strategic positioning by dominant market players seeking to capitalise on normalised trade flows. The recent Glencore charters supertanker to load oil from Middle East demonstrates how sophisticated commodity traders evaluate risk-adjusted opportunities in volatile environments.
Understanding these maritime dynamics requires examining multiple layers of market behaviour, from vessel specifications and freight rate calculations to regional permit requirements and insurance implications. The complexity extends beyond simple supply-demand mechanics to encompass geopolitical risk assessment, operational flexibility requirements, and competitive positioning strategies that define success in global energy markets.
When big ASX news breaks, our subscribers know first
Charter Specifications Reveal Strategic Market Positioning
VLCC Capacity and Route Economics
The Asian Lion represents a standard Very Large Crude Carrier (VLCC) configuration capable of transporting 2 million barrels of crude oil, aligning with industry-standard vessel specifications for major Asia-Middle East trade routes. These supertankers form the backbone of global oil transportation, with approximately 750-800 vessels operating in active service worldwide as of 2024-2025.
VLCC operations on the TD3C route (DFRT-ME-CN designation covering floating/VLCC movements from Middle East to China) typically require 15-25 days depending on routing decisions and sea conditions. This timeframe makes vessel scheduling and charter rate negotiations critical components of profitability calculations for major trading houses.
The Worldscale freight rate system provides standardised benchmarking for tanker charter costs. A rate of W580 represents 580% of the baseline Worldscale parity rate for the specific route, indicating significant premium pricing above normal market conditions. Historical data shows TD3C routes typically fluctuate between W200-W400 during standard market conditions, making the current rate structure particularly notable for market analysts.
Demurrage Fee Structure and Operational Implications
Demurrage fees of $580,000 per day reflect the substantial financial exposure associated with extended loading or unloading operations. These charges, paid to vessel owners when agreed timeframes are exceeded, typically range from $350,000-$750,000 daily for VLCC operations depending on vessel age, market conditions, and operational complexity.
The demurrage structure indicates several operational considerations:
- Port congestion expectations during recovery periods
- Documentation and permit processing delays in post-conflict environments
- Insurance verification requirements for war risk coverage
- Cargo inspection protocols ensuring compliance with international standards
These factors combine to create extended turnaround times that justify premium demurrage rates during market recovery phases.
Strategic Advantages in Post-Disruption Energy Markets
First-Mover Positioning in Critical Shipping Lanes
Major commodity traders like Glencore International PLC (LON: GLEN) leverage their operational scale and financial resources to secure preferential positioning during market recovery periods. The Swiss-based trading house operates across multiple commodity segments, with energy trading representing a core business component alongside mining operations.
Early market re-entry strategies provide several competitive advantages:
- Supplier relationship preservation during uncertain periods
- Inventory accumulation at favourable pricing before normalisation
- Market share expansion while competitors assess risk parameters
- Infrastructure access to key loading and discharge facilities
Historical precedent supports this approach. During the 2011 Libya disruption, traders who resumed North African operations within 3-4 weeks captured significant margin improvements before broader market normalisation occurred.
Risk Assessment Framework for Energy Logistics
Professional commodity trading operations employ sophisticated risk management protocols when evaluating market re-entry opportunities. These frameworks typically assess:
Political Stability Indicators:
- Ceasefire durability and monitoring mechanisms
- Regional government capacity for maritime security
- International diplomatic engagement levels
Operational Security Factors:
- Naval mine clearance completion status
- Shipping lane safety certifications
- Emergency response infrastructure availability
Regulatory Compliance Requirements:
- Sanctions compliance verification systems
- Permit and authorisation procedures
- Documentation standards for international transits
Financial Risk Management:
- War risk insurance availability and pricing
- Political risk coverage terms
- Counterparty credit assessment protocols
Strait of Hormuz Transit Complexities
Geographic and Strategic Importance
The Strait of Hormuz maintains its position as one of the world's most critical energy chokepoints, facilitating approximately 20% of global oil shipments and handling roughly 21-22 million barrels per day in normal operating conditions. The waterway's strategic significance extends beyond volume considerations to encompass regional security dynamics and international energy market stability.
The strait's narrowest point spans approximately 33-45 nautical miles, requiring sophisticated traffic management systems to coordinate vessel movements safely. The International Maritime Organisation (IMO) maintains established traffic separation schemes to optimise flow efficiency while minimising collision risks in this congested waterway.
Furthermore, the oil price movements in global markets often correlate directly with Strait of Hormuz transit conditions. Any disruption to this critical waterway can trigger significant market volatility, demonstrating the interconnected nature of geopolitical events and energy pricing.
Navigation and Permit Requirements
Post-conflict navigation through the Strait of Hormuz involves complex coordination mechanisms between regional authorities, shipping companies, and international maritime organisations. Iran's assertion of permit requirements for transiting vessels represents an evolution from standard pre-conflict operating procedures.
Key operational considerations include:
Mine Clearance Operations:
- Mine-countermeasure vessel deployments typically require 2-6 weeks per geographic area
- International coordination through NATO Mine Countermeasures Centre protocols
- Alternative routing guidance to avoid contaminated zones
Alternative Route Economics:
- Suez Canal routing adds approximately 6,000+ nautical miles versus direct Strait transit
- Cape of Good Hope routing increases distance by 10,000+ nautical miles
- Additional transit costs range $1-3 million per voyage in fuel and operational expenses
Insurance and Documentation:
- War risk insurance premiums can increase 100-500% above baseline rates
- Enhanced documentation requirements for permit compliance
- Political risk coverage evaluation for extended operations
VLCC Market Dynamics and Recovery Indicators
Fleet Utilisation and Charter Rate Trends
The global VLCC fleet represents a critical component of international energy infrastructure, with vessel availability and utilisation rates serving as key indicators of market health. Current charter rate premiums reflect supply-demand imbalances created by temporary shipping lane disruptions and subsequent recovery demand.
Market Recovery Patterns:
| Recovery Phase | Typical Timeline | Rate Premium | Key Indicators |
|---|---|---|---|
| Initial Assessment | 1-2 weeks | 50-100% above baseline | Risk evaluation protocols |
| Early Re-entry | 2-4 weeks | 150-300% premium | Pioneer charter activity |
| Gradual Normalisation | 4-8 weeks | 100-200% premium | Increased vessel fixture |
| Market Stabilisation | 8-12 weeks | 25-75% premium | Regular trading patterns |
Regional Demand Patterns and Strategic Stockpiling
Asian energy import requirements drive substantial VLCC demand on Middle East-China shipping lanes, with major economies implementing strategic stockpiling programmes during market recovery periods. China, Japan, and South Korea collectively represent the largest regional demand concentration for Middle Eastern crude imports.
Strategic considerations influencing charter decisions include:
- Floating storage economics during price volatility periods
- Inventory management strategies balancing cost versus security
- Supply chain diversification reducing dependence on single-source regions
- Seasonal demand patterns affecting optimal cargo timing
However, the impact extends beyond immediate trading considerations. The oil production impact on global markets means that supply disruptions in key regions can amplify demand for alternative sources, creating additional pressure on shipping capacity and charter rates.
Broader Implications for Global Energy Trading
Price Discovery and Market Normalisation
Post-disruption market conditions create complex price discovery mechanisms as traders evaluate risk-adjusted valuations for energy commodities. Spot pricing typically exhibits significant volatility during recovery phases, with forward curve implications extending across multiple months or quarters.
Price Formation Factors:
- Risk premium incorporation reflecting operational uncertainties
- Insurance cost pass-through to end consumers
- Transportation cost escalation from premium freight rates
- Inventory rebuild demand creating temporary supply tightness
Regional price differentials often widen during recovery periods as transportation constraints limit arbitrage opportunities between major trading hubs. Brent-Dubai spreads, West Texas Intermediate differentials, and Asian premium structures all demonstrate increased volatility during shipping disruptions.
Competitive Landscape Evolution
Major energy trading houses including Vitol, Trafigura, Mercuria, and Gunvor compete for market position during recovery periods, with success often determined by operational flexibility and risk management capabilities. The ability to secure vessel capacity, navigate regulatory requirements, and maintain supplier relationships becomes crucial for market share preservation.
Strategic Differentiation Factors:
- Financial resource capacity for premium charter rates and extended working capital requirements
- Operational expertise in complex regulatory and documentation environments
- Relationship management with suppliers, vessel owners, and regional authorities
- Geographic diversification reducing concentration risk in single trade routes
Moreover, understanding tariffs and investments becomes increasingly important as geopolitical tensions can rapidly reshape global trading patterns, affecting both market access and operational costs.
Long-term Supply Chain Resilience
The charter activity demonstrates broader themes in energy supply chain management, emphasising the importance of operational flexibility and diversified routing capabilities. Companies increasingly invest in multi-modal transportation options, strategic storage facilities, and alternative supplier relationships to mitigate future disruption risks.
Infrastructure readiness assessments become critical components of business continuity planning, with companies evaluating:
- Port facility capabilities for handling increased throughput during recovery
- Storage terminal capacity for inventory management during volatile periods
- Documentation and compliance systems for evolving regulatory requirements
- Financial hedging instruments for managing price and operational risk exposure
The next major ASX story will hit our subscribers first
OPEC Influence and Production Coordination
Production Decisions and Market Stability
The Organisation of the Petroleum Exporting Countries (OPEC) plays a crucial role in market stabilisation during periods of shipping disruption. Furthermore, OPEC production impact decisions can significantly influence both pricing and shipping demand patterns across global markets.
When shipping routes face disruption, OPEC member countries often adjust production levels to maintain market stability. These decisions create ripple effects throughout the global energy supply chain:
Immediate Response Mechanisms:
- Emergency production increases to offset supply concerns
- Strategic reserve releases to buffer market volatility
- Coordination with non-OPEC producers for unified response
Medium-term Adjustments:
- Production reallocation between member countries
- Alternative export route development
- Infrastructure investment for supply diversification
Market Influence During Recovery Phases
In addition, OPEC market influence extends beyond production decisions to encompass coordination of recovery efforts. The organisation's ability to signal market confidence through production commitments often determines the pace of normalisation in shipping markets.
During the current recovery phase, OPEC's role becomes particularly significant:
- Price stability messaging through production guidance
- Supply assurance to major importing nations
- Coordination with shipping industry to optimise logistics
- Investment signals for long-term infrastructure development
Market Recovery Timeline and Investment Implications
Recovery Milestones and Performance Indicators
Systematic market recovery typically follows predictable patterns, with specific milestones indicating progression toward normalised operations. These indicators provide valuable guidance for investors and operators planning strategic decisions.
Key Recovery Milestones:
Weeks 1-2: Assessment Phase
- Risk evaluation by major operators
- Insurance market capacity assessment
- Regulatory framework clarification
Weeks 3-6: Pioneer Activity
- First charter fixtures at premium rates
- Limited vessel availability testing
- Initial cargo movement success
Weeks 7-12: Gradual Expansion
- Increased charter activity
- Rate premium compression
- Broader market participation
Weeks 13-24: Market Normalisation
- Regular trading pattern restoration
- Competitive rate environment
- Full operational capacity utilisation
Investment Strategy Considerations
The charter activity provides insights for various investment strategies across energy and maritime sectors. Equity investors in shipping companies often benefit from charter rate premiums during recovery periods, while commodity investors must balance supply security against cost implications.
Risk-Adjusted Return Analysis:
- Shipping sector investments benefit from elevated day rates and utilisation
- Energy trading positions require careful timing around price normalisation
- Infrastructure investments gain from increased throughput demand
- Insurance sector exposure reflects both increased premiums and elevated claim risks
The Asia-bound crude trade restart demonstrates the rapid response capability of major trading houses when market conditions improve. This swift action underscores the importance of maintaining operational readiness during uncertain periods.
Disclaimer: This analysis is provided for educational and informational purposes only and should not be considered as investment advice. Energy markets involve significant risks including price volatility, geopolitical factors, and operational complexities that can result in substantial financial losses. Investors should conduct thorough due diligence and consult qualified financial advisors before making investment decisions. Past performance and historical patterns do not guarantee future results.
The strategic positioning demonstrated through major charter activity reflects sophisticated risk management and market timing capabilities that define success in global energy trading. As maritime corridors gradually return to normal operations, the lessons learned from recovery patterns will influence future supply chain design and operational flexibility requirements across the international energy sector.
Looking to Capitalise on Energy Market Shifts?
Discovery Alert's proprietary Discovery IQ model delivers real-time alerts on significant ASX mineral discoveries, including energy and critical minerals opportunities that often correlate with global market dynamics. Subscribers gain actionable insights into emerging discoveries that could benefit from shifting energy supply chains and commodity demand patterns. Begin your 14-day free trial today to position yourself ahead of market movements.