May 22, 2026
Market Dynamics During Crisis Resolution Phases
Professional investors understand that market behavior during geopolitical crisis periods follows predictable psychological patterns. The Hormuz Hope rally demonstrates how markets experience what behavioral finance experts term "relief rallying," characterised by rapid asset repricing based on improving sentiment rather than confirmed outcomes.
These dynamics become particularly pronounced during energy-related geopolitical events. Historical analysis reveals that markets frequently rally 5-15% in the weeks preceding formal conflict resolution, as institutional investors position portfolios for normalised operating conditions.
The phenomenon reflects fundamental market mechanics: equity prices incorporate forward-looking expectations rather than current realities. This creates opportunities for sophisticated investors who can accurately assess probability-weighted scenarios while managing downside risks through structured market volatility hedging strategies.
When big ASX news breaks, our subscribers know first
Strategic Maritime Chokepoints and Global Trade Vulnerabilities
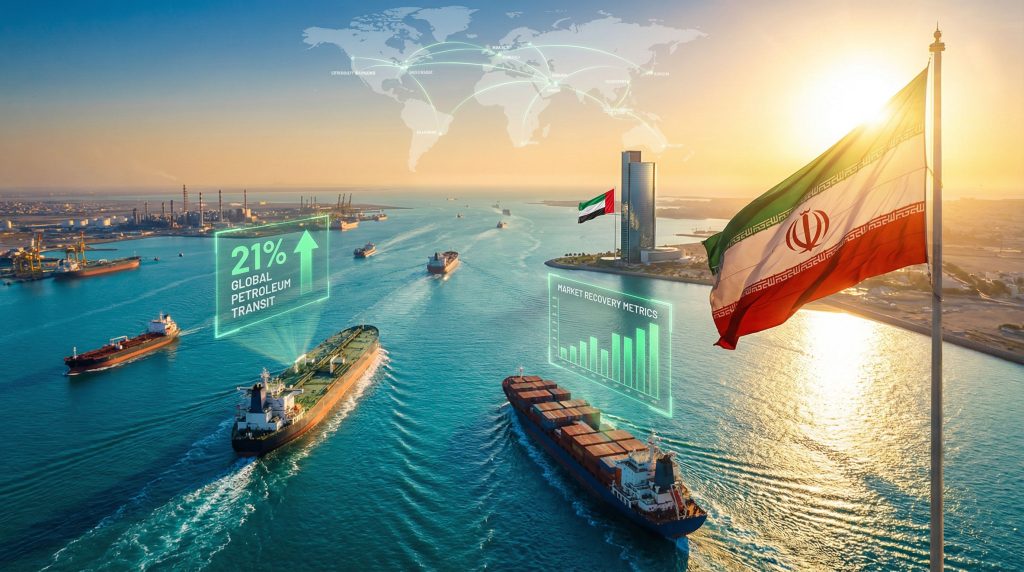
The Strait of Hormuz represents one of the world's most critical energy transit routes, facilitating approximately 21% of global petroleum liquids movement according to U.S. Energy Information Administration data. This strategic waterway's operational status directly influences crude oil pricing, currency valuations, and cross-asset correlations across international markets.
Supply Chain Risk Assessment Framework
When analysing geopolitical events affecting maritime chokepoints, investors must evaluate multiple transmission mechanisms that contribute to oil price rally dynamics across global markets.
Energy Price Volatility Channels:
- Immediate spot price reactions typically range 4-8% for crude oil futures
- Refined product pricing follows with 1-2 week lag periods
- Natural gas markets experience sympathy moves despite different supply chains
Cross-Asset Correlation Shifts:
- Currency markets see resource-dependent economies (Australia, Canada, Norway) experience 1-2% movements per $10/barrel crude change
- Equity sector rotations favour defensive positioning during uncertainty phases
- Fixed income markets price inflation expectations through breakeven rate adjustments
During the 2020 Soleimani assassination crisis, crude oil prices spiked approximately 4-5% within hours, demonstrating how quickly geopolitical events transmit through energy markets to broader asset classes. Similarly, the 2019 tanker attacks in the Gulf region triggered immediate 5-8% oil price increases and corresponding equity market volatility.
Transportation Infrastructure Recovery Patterns
Maritime shipping, aviation, and logistics sectors typically experience amplified gains during conflict de-escalation periods. War risk insurance premiums, which can add 1-4% to freight costs during heightened tensions, normalise rapidly once geopolitical stability returns.
The Baltic Dry Index and related shipping cost measures historically show 15-20% improvements within 4-6 weeks of major conflict resolution announcements, as alternative routing premiums disappear and fuel hedging costs decline to baseline levels.
Energy Sector Dynamics During Political Normalisation
Oil and gas companies face complex valuation dynamics during geopolitical transition periods, with different subsectors experiencing varying impact patterns. Furthermore, understanding the OPEC oil production impact becomes crucial during these market transitions.
| Company Type | Primary Benefits | Timeline | Typical Performance |
|---|---|---|---|
| Upstream Producers | Production planning clarity | 4-8 weeks | 18-22% capex increases |
| Downstream Refiners | Margin expansion potential | 2-4 weeks | 15-25% crack spread widening |
| Integrated Majors | Strategic flexibility | 6-12 months | 20-35% equity appreciation |
| Pipeline Operators | Normalised throughput | 1-3 weeks | Stable distribution yields |
Upstream Producer Strategic Positioning
Exploration and production companies benefit primarily from reduced operational uncertainty and improved capital allocation visibility. Following the 2015 Iranian nuclear deal (JCPOA), major oil companies initiated significant expansion projects within six months, demonstrating how quickly geopolitical stability translates to investment decisions.
Production planning becomes more predictable when geopolitical risks diminish, allowing companies to optimise extraction schedules and infrastructure development. This operational clarity typically translates to improved earnings guidance and enhanced investor confidence.
Refining Margin Expansion Mechanics
Downstream refiners often experience the most immediate benefits from geopolitical normalisation through crack spread expansion. When crude oil supply uncertainty diminishes, refinery margins typically widen as feedstock cost volatility decreases while product demand remains stable.
Historical data shows crack spreads expanding 15-25% following major de-escalation events, as refiners can more accurately predict input costs and optimise product mix strategies. This margin expansion directly translates to earnings improvements and enhanced cash flow generation.
Financial Services Sector Recovery Dynamics
Banking and insurance companies demonstrate strong performance during geopolitical normalisation periods through several operational mechanisms. However, investors must also consider broader tariffs impact on markets when evaluating financial sector opportunities.
Credit Risk Provisioning Adjustments:
- Banks typically reduce loan loss reserves by 2-5% for emerging market and energy sector exposures
- Reserve releases provide immediate earnings accretion
- Regional lending confidence improves in previously affected areas
Trading Portfolio Volatility Normalisation:
- Geopolitical events often increase option volatility 20-40% above baseline levels
- Normalisation reduces hedging costs for financial institutions
- Treasury and equity trading results improve as volatility premiums decline
During the 2003 Iraq conflict resolution, major banks released significant reserves allocated for Middle East exposure, contributing to sector outperformance of 12-18% over subsequent quarters.
Market Timing and Information Asymmetry Advantages
Professional market participants often initiate position changes 3-7 days before public confirmation of geopolitical developments, creating momentum effects that drive broader market participation.
Information Flow Hierarchy Analysis
Market positioning typically follows a predictable sequence:
- Government and Diplomatic Channels (72-96 hours lead time)
- Institutional Research Departments (48-72 hours lead time)
- Hedge Fund Analytics Systems (24-48 hours lead time)
- Retail Market Participants (Real-time public information)
This information asymmetry creates trading opportunities for investors with superior analytical capabilities or data access. Options markets frequently show positioning changes before formal announcements, with put/call ratios shifting toward optimistic scenarios.
Pre-Event Rally Characteristics
Historical analysis reveals that markets often peak 24-72 hours before formal conflict resolution announcements. The 2003 Iraq ceasefire saw market peaks approximately three days before official declarations, while the 2015 Iran nuclear deal generated 5-8% rallies on announcement day, two weeks before sanctions were formally lifted.
Recent market commentary from April 2, 2026 demonstrated this dynamic in real-time, as Australian shares advanced 0.5% on expectations of a Trump administration announcement regarding Middle East de-escalation, building on the previous day's 2.2% gain on mere speculation of Hormuz Hope developments.
Risk Management Strategies During Rally Periods
Investors navigating geopolitical recovery phases must balance opportunity capture with downside protection through structured risk management approaches. In addition, incorporating gold as inflation hedge strategies can provide portfolio stability during uncertain periods.
Diversification Framework Implementation
Geographic Risk Distribution:
- Maintain exposure across multiple regions to reduce concentration risk
- Historical data shows geographic diversification reduces geopolitical exposure by 30-40%
- Consider developed market stability versus emerging market recovery potential
Sector Allocation Strategies:
- Balance cyclical recovery plays with defensive positioning
- Energy sector exposure should reflect both normalisation benefits and volatility risks
- Financial services positions can capitalise on multiple recovery transmission channels
Volatility Management Techniques
Put option hedging costs typically decline from 6-10% annually during tension periods to 2-4% baseline levels during normalisation. This cost reduction allows for more efficient portfolio protection strategies.
Structured Hedging Approaches:
- Implement collar strategies to participate in upside while limiting downside
- Consider volatility selling strategies as implied volatility normalises
- Maintain liquidity buffers for rapid portfolio reallocation opportunities
The next major ASX story will hit our subscribers first
Long-term Investment Theme Evolution
Geopolitical crisis resolution periods often catalyse permanent structural changes in investment landscapes, creating new thematic opportunities beyond immediate recovery trades.
Supply Chain Infrastructure Development
Companies frequently accelerate supply chain diversification following geopolitical events, creating investment opportunities in:
- Alternative Transportation Routes: Pipeline development, rail infrastructure, port facilities
- Regional Processing Capabilities: Distributed manufacturing to reduce single-point failures
- Technology Infrastructure: Communication systems, monitoring technologies, logistics optimisation
Energy Security Investment Acceleration
Geopolitical instability consistently drives increased investment in energy independence initiatives:
- Renewable Energy Projects: Solar, wind, and storage technologies gain strategic importance
- Domestic Resource Development: Previously uneconomic projects become viable
- Grid Infrastructure Modernisation: Smart grid technologies and distributed generation systems
Critical Investment Consideration: Successful geopolitical rally navigation requires focusing on companies with genuine operational improvements rather than sentiment-driven gains. Sustainable outperformance typically comes from businesses that can demonstrate concrete benefits from normalised operating conditions.
Sector Performance Ranking During Recovery Phases
Historical analysis reveals consistent patterns in sector performance during geopolitical normalisation periods:
Top Performing Sectors (Typical 4-8 week returns):
- Transportation & Logistics: 15-25% gains from normalised operating costs
- Regional Banking: 12-20% improvement from reduced provisioning requirements
- Energy Infrastructure: 10-18% appreciation from increased utilisation rates
- Industrial Manufacturing: 8-15% gains from supply chain normalisation
Underperforming Asset Classes:
- Government bonds typically decline as safe-haven demand diminishes
- Precious metals often experience 5-10% corrections during risk-on periods
- Defensive consumer staples lag as growth sectors attract capital flows
Market Psychology and Behavioral Considerations
Understanding investor psychology during crisis resolution phases provides insights into market timing and position sizing decisions. Consequently, the Hormuz Hope rally exemplifies how relief-driven sentiment can create both opportunities and risks for portfolio managers.
Optimism Cycle Management
Relief rallies often exhibit euphoric characteristics that can lead to overextended valuations. Key warning signs include:
- Declining Trading Volumes: Indicates weakening conviction despite price appreciation
- Sector Rotation Stagnation: Suggests limited new capital entering markets
- Fundamental Data Disconnect: Price movements decoupled from underlying economic improvements
Sustainable Recovery Indicators
Durable geopolitical rallies typically demonstrate:
- Broadening Market Participation: Multiple sectors and geographic regions showing strength
- Volume Confirmation: Increasing participation supporting price movements
- Earnings Revision Cycles: Analyst upgrades reflecting improved operational outlooks
Implementation Timing and Exit Strategies
Optimal entry and exit timing for geopolitical recovery trades requires monitoring multiple confirmation signals and maintaining flexible position management approaches.
What Are the Optimal Entry Points?
Phase 1: Initial De-escalation Signals (Highest risk/reward)
- Maximum volatility and opportunity
- Requires strong conviction and risk tolerance
- Typical holding periods: 2-4 weeks
Phase 2: Formal Negotiation Announcements (Moderate risk/reward)
- More sustainable trend development
- Broader market participation
- Typical holding periods: 4-8 weeks
Phase 3: Preliminary Agreement Implementation (Lower risk/reward)
- Momentum continuation with reduced volatility
- Limited remaining upside potential
- Typical holding periods: 1-2 weeks
Exit Strategy Framework
Successful position management during recovery phases requires predetermined exit criteria:
- Profit Taking Levels: Scale out of positions as volatility normalises
- Time-Based Exits: Historical rally durations average 3-8 weeks
- Fundamental Reassessment: Transition focus from sentiment to operational metrics
The Hormuz Hope rally phenomenon demonstrates how markets can rapidly transition from crisis-driven volatility to opportunity-rich environments. However, as global markets continue to evolve, investors must remain vigilant about timing and risk management strategies.
Disclaimer: This article contains speculative analysis and forward-looking statements regarding geopolitical events and market dynamics. Past performance does not guarantee future results. Investors should conduct independent research and consult qualified financial advisors before making investment decisions. Geopolitical situations can change rapidly, and market predictions may not materialise as expected.
Ready to Capitalise on Geopolitical Market Opportunities?
Discovery Alert's proprietary Discovery IQ model delivers real-time alerts on significant ASX mineral discoveries, instantly empowering subscribers to identify actionable opportunities ahead of the broader market during volatile periods like geopolitical crises. Begin your 14-day free trial today and secure your market-leading advantage while understanding how major mineral discoveries can generate substantial returns during market recovery phases.