June 15, 2026
Understanding Market Dynamics in Energy Sector Valuations
Global energy markets operate through complex interconnections where commodity price volatility creates ripple effects across asset classes, with Australian energy producers experiencing distinct performance patterns during periods of geopolitical uncertainty. The mathematical relationship between operational leverage and market capitalisation determines how individual companies respond to external price shocks, creating predictable yet nuanced investment opportunities for sector participants.
Market participants who understand these underlying mechanics can position portfolios to capitalise on volatility-driven price dislocations while managing downside risk through diversified exposure across different market capitalisation tiers. The energy sector's relationship with broader market indices reflects both systematic risk factors and company-specific operational characteristics that amplify or dampen commodity price movements.
Beach Energy Oil Price Rise Amplification Effects
Recent trading data demonstrates how smaller energy producers capture disproportionate upside during commodity price appreciation events. Beach Energy's significant outperformance during March 2026 geopolitical tensions illustrates the operational leverage principles that drive small-cap energy stock valuations during volatile periods, particularly when considering broader tariffs impact markets.
Market Capitalisation Performance Comparison
| Company | Market Cap (AUD) | Daily Gain | Share Price | Trading Volume |
|---|---|---|---|---|
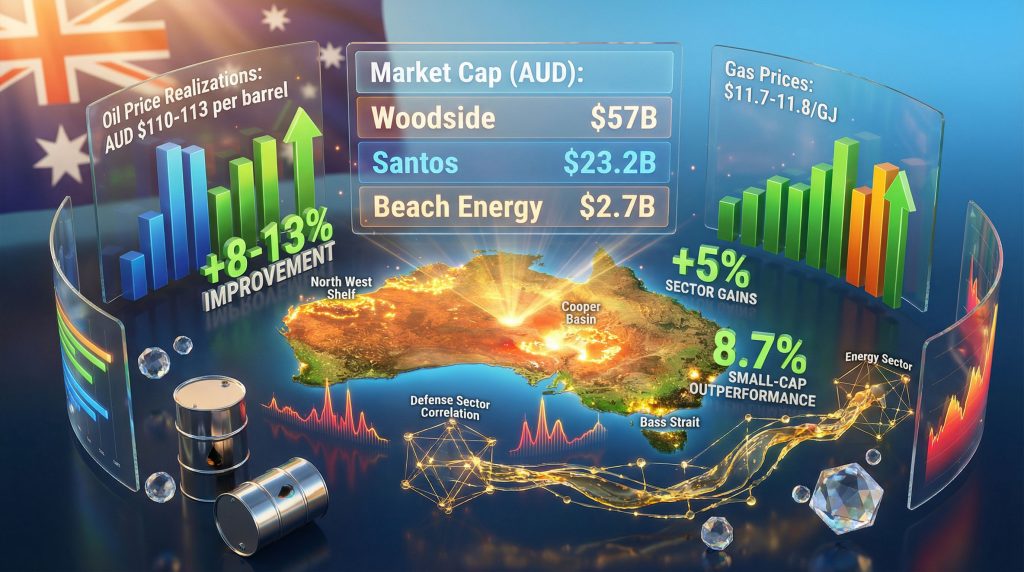
| Beach Energy | $2.7 billion | +8.7% | $1.19 | $10.65 million |
| Woodside Petroleum | $57 billion | +2.7% | $30.00 | Market tracking |
| Santos Limited | $23.2 billion | +5.0% | Not specified | Sector aligned |
The data reveals clear correlation patterns between company size and price sensitivity, with Beach Energy's 8.7% gain significantly exceeding the broader energy sector's 5% collective appreciation. This performance differential reflects fundamental differences in operational structure, hedging capacity, and production portfolio concentration across Australian energy producers.
When big ASX news breaks, our subscribers know first
What Drives Differential Performance Among Australian Energy Producers?
Operational leverage mechanics create the foundation for understanding why smaller energy companies experience amplified price movements during commodity volatility events. Companies with concentrated production profiles and limited hedging programmes capture more direct exposure to underlying commodity price movements, translating into magnified stock price responses.
Operational Leverage and Financial Structure Analysis
Small-cap energy producers typically operate with higher fixed cost ratios relative to total revenue, meaning percentage changes in commodity prices create disproportionate impacts on operating margins and cash flow generation. This mathematical relationship explains why Beach Energy's 8.7% gain exceeded both Woodside's more modest appreciation and the sector average during March 2026 trading.
Key Operational Differences:
- Production scale limitations create higher per-unit operational costs
- Hedging programme constraints due to credit facility and institutional relationship limitations
- Geographic concentration in specific production basins or fields
- Commodity mix exposure with less diversification between oil and gas production
- Capital structure leverage amplifying both upside and downside commodity price movements
Institutional Capacity and Risk Management Variations
Larger energy producers maintain sophisticated risk management infrastructure including forward contract capabilities, collar option strategies, and derivative instrument access through established institutional banking relationships. These capabilities allow major producers to smooth commodity price volatility impacts whilst smaller companies experience more direct correlation to underlying price movements.
The $10.65 million share turnover in Beach Energy during the first trading hours of March 2, 2026, represents concentrated investor activity typical of smaller-cap equities during significant market-moving events. This trading pattern reflects both opportunity recognition and liquidity constraints that characterise small-cap energy investing during volatile periods.
How Do Commodity Price Realisations Affect Energy Company Valuations?
Revenue realisation mechanics in energy companies reflect complex interactions between production volumes, commodity pricing, hedging outcomes, and contract structures that determine actual cash flow generation independent of headline commodity prices. Understanding these technical factors provides crucial insight into how energy companies translate commodity price movements into financial performance, particularly in the context of an oil price rally.
Production Volume Versus Price Realisation Trade-offs
Recent industry data demonstrates the dominant impact of commodity price movements over production volume changes in determining revenue outcomes. Analysis of H1 FY26 performance across Australian energy producers reveals how price deterioration can offset significant production increases, resulting in flat revenue performance despite operational expansion.
H1 FY26 Price Realisation Analysis:
- Oil price realisations: AUD $110-113 per barrel (declined 12% year-over-year)
- Natural gas improvements: $11.7-11.8 per GJ (increased 8-13% period-over-period)
- Production volume growth: 3-15% across major producers
- Net revenue impact: Approximately flat despite volume expansion
Contract Structure and Hedging Impact Assessment
Energy companies operate through diverse revenue streams including spot market sales, forward contracts, and long-term supply agreements that create different price realisation profiles. LNG contracts typically incorporate oil-price indexation formulas, creating lagged relationships between crude oil price movements and realised LNG revenues that affect cash flow timing and predictability.
Furthermore, understanding natural gas forecasts becomes essential for evaluating future revenue potential across different commodity exposures.
Revenue Realisation Components:
- Spot market exposure capturing immediate price movements
- Forward contract hedging providing price certainty but limiting upside participation
- Long-term LNG agreements with oil-price indexation creating delayed correlation patterns
- Regional price differentials reflecting crude oil quality and transportation costs
- Currency impact on AUD-denominated companies selling into USD commodity markets
The mathematical relationship demonstrates why a 10% production increase combined with a 12% commodity price decline results in approximately 3-4% negative revenue impact, explaining the flat performance described in recent industry analysis despite operational expansion efforts.
What Investment Strategies Work During Energy Market Volatility?
Volatility-driven sector rotation creates systematic opportunities for investors who understand the relationship between geopolitical events, commodity price expectations, and differential company performance across market capitalisation tiers. Successful energy sector investing during uncertain periods requires strategic positioning across multiple variables including operational leverage, hedging exposure, and liquidity considerations.
Sector Rotation and Cross-Asset Correlation Recognition
The March 2026 geopolitical event response demonstrates market efficiency in recognising interconnected investment opportunities across energy and defence sectors. Energy stocks gained 5% collectively whilst defence contractors experienced even stronger performance, with Electro Optics Systems advancing 18% as market participants anticipated increased government spending on both energy security and defence capabilities.
Geopolitical Event Investment Response Pattern:
- Energy sector collective gain: +5% within hours of weekend tensions
- Small-cap energy outperformance: Beach Energy +8.7% versus sector +5%
- Defence sector correlation: EOS +18%, DRO following higher
- Currency-hedged ETF tracking: Betashares FUEL ETF capturing sector movements
Operational Leverage Positioning Strategies
Investors seeking amplified exposure to commodity price movements can achieve this through strategic allocation toward smaller energy producers with minimal hedging programmes and concentrated production profiles. However, this approach requires understanding liquidity constraints and volatility tolerance appropriate to investment timeline and risk capacity.
Risk-Adjusted Positioning Framework:
- Market cap diversification across large, mid, and small-cap energy producers
- Hedging exposure assessment to determine commodity price sensitivity
- Production portfolio analysis for oil versus gas exposure optimisation
- Liquidity evaluation for position sizing during volatile periods
- Correlation analysis with broader market indices and defensive sectors
The simultaneous gains across energy and defence sectors illustrate market recognition of geopolitical event interconnections, creating cross-sector investment opportunities for participants who understand these correlation patterns.
How Do Geopolitical Events Influence Energy Stock Valuations?
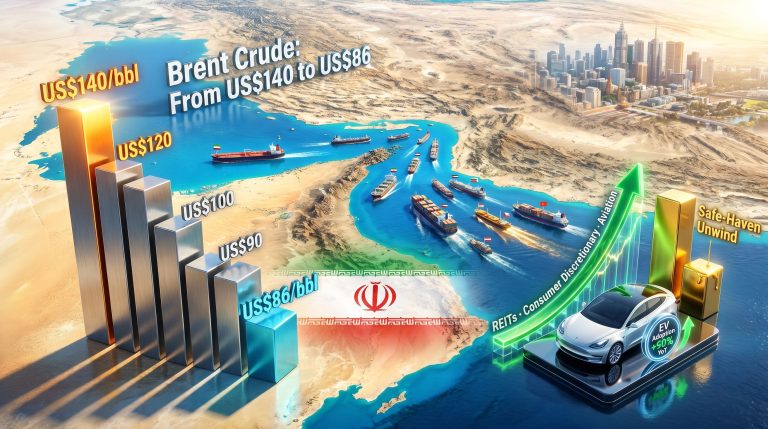
Supply chain disruption expectations drive immediate market repricing when geopolitical tensions threaten major energy-producing regions, with Australian energy companies positioned as alternative supply sources during international conflicts. The March 2026 US-Iranian tensions created textbook examples of how market participants rapidly reallocate capital toward energy producers located in stable jurisdictions.
Energy Security Premium and Supply Constraint Anticipation
Market participants immediately recognised potential Iranian oil supply disruption risks following weekend military actions, creating premium valuations for Australian energy producers as alternative supply sources. The collective 5% energy sector gain within hours of geopolitical events demonstrates institutional investment flow toward stable jurisdiction energy assets during international uncertainty.
In addition, these events often coincide with challenges facing Australia resource energy exports, which can further influence market dynamics.
Geopolitical Risk Premium Mechanics:
- Supply constraint expectations drive immediate commodity futures repricing
- Alternative producer premiums benefit companies in stable political jurisdictions
- Energy security considerations create government policy support for domestic production
- Currency hedge benefits through AUD-denominated companies selling into global markets
Defence-Energy Sector Correlation Recognition
The simultaneous outperformance of both energy stocks (+5%) and defence contractors (+18% for EOS) reflects market understanding of dual investment thesis during geopolitical conflicts. Energy price support emerges through supply constraints whilst defence spending acceleration occurs through government response patterns, creating correlated but distinct investment opportunities.
Cross-Sector Investment Correlation Analysis:
- Traditional energy producers benefiting from supply constraint premiums
- Defence contractors experiencing increased government spending expectations
- Technology companies with dual-use defence applications gaining attention
- Infrastructure providers supporting energy independence initiatives
Even tangentially related companies like 4D Medical experienced gains (+7.3% to $4.10/share) based on existing US Department of Defence contracts and expectations of increased government spending on medical technologies with defence applications.
What Financial Metrics Matter Most for Energy Stock Analysis?
Cash flow generation capacity across different commodity price scenarios provides the fundamental analytical framework for evaluating energy company investment merit independent of short-term price movements. Understanding production cost structures, reserve replacement ratios, and capital allocation efficiency creates sustainable investment selection criteria beyond momentum-based trading approaches.
Production Efficiency and Cost Structure Analysis
Energy companies operating with lower per-barrel production costs maintain competitive advantages during commodity price downturns whilst capturing greater profit margins during price appreciation periods. This cost structure analysis becomes crucial for long-term investment positioning as commodity cycles create periodic stress testing of operational efficiency, particularly when considering potential oil production decline scenarios.
Critical Financial Performance Indicators:
- Production cost per barrel analysis across different field types and locations
- Reserve replacement ratios indicating sustainable production capacity
- Decline curve management effectiveness in maintaining production levels
- Capital efficiency metrics for new development project returns
- Free cash flow generation at various commodity price assumptions
Debt Service Coverage and Capital Allocation Assessment
Financial resilience during commodity price volatility depends on debt service coverage ratios and management's capital allocation discipline across different market environments. Companies maintaining strong balance sheets can pursue growth opportunities during downturns whilst weaker operators face operational constraints and potential distress situations.
Balance Sheet Strength Evaluation:
- Debt-to-equity ratios and interest coverage capacity
- Credit facility headroom for operational flexibility during stress periods
- Dividend sustainability through commodity price cycles
- Capital allocation priorities between growth investment and shareholder returns
- Hedging programme effectiveness in managing cash flow volatility
The next major ASX story will hit our subscribers first
How Should Investors Approach Energy Sector Positioning?
Strategic energy sector allocation requires understanding multiple risk factors including commodity price volatility, operational leverage differences, and regulatory environment evolution that affect long-term investment returns. Successful positioning balances growth potential with downside protection through diversified exposure across operational characteristics and market capitalisation tiers.
Portfolio Construction and Risk Management Framework
Effective energy sector investing combines fundamental analysis with volatility management through strategic diversification across company characteristics that respond differently to market conditions. This approach captures sector upside whilst managing downside risk through balanced exposure to different operational profiles and risk factors.
Diversification Strategy Components:
- Market capitalisation weighting across large, mid, and small-cap producers
- Geographic diversification between domestic Australian and international operations
- Commodity mix balancing between oil-focused and gas-focused producers
- Operational stage exposure from exploration companies to established producers
- ESG consideration integration for regulatory risk and transition preparation
Long-term Strategic Positioning Considerations
Energy sector transformation creates evolving investment opportunities as traditional producers adapt business models whilst new technologies change operational cost structures and regulatory frameworks. Forward-looking investors must balance current cash flow generation with transition capability assessment for sustainable long-term returns.
Moreover, companies like Beach Energy face energy export challenges that could influence their operational strategies and market positioning going forward.
Future-Oriented Investment Analysis:
- Regulatory environment evolution impacting operational permits and tax structures
- Technology adoption rates changing production cost profiles and efficiency metrics
- Consumer demand evolution affecting long-term commodity pricing assumptions
- Capital market access for growth financing during transition periods
- Management quality assessment for navigating industry transformation challenges
The Beach Energy oil price rise example from March 2026 illustrates these principles in practice, where smaller companies with focused operational profiles capture amplified upside during favourable commodity price movements whilst larger diversified producers provide stability and dividend income during volatile periods.
However, investors should also consider Beach Energy's recent performance which demonstrates the complex relationship between production levels and market valuations in the energy sector.
Disclaimer: This analysis contains forward-looking statements and investment considerations based on market data and industry trends. Past performance does not guarantee future results. Investors should conduct thorough due diligence and consider their individual financial circumstances before making investment decisions. Energy sector investments carry inherent volatility risks related to commodity price movements, geopolitical events, and regulatory changes.
Ready to Capitalise on the Next Energy Sector Opportunity?
Discovery Alert's proprietary Discovery IQ model delivers real-time alerts on significant ASX mineral and energy discoveries, instantly empowering subscribers to identify actionable opportunities ahead of the broader market. Begin your 14-day free trial today at Discovery Alert and secure your market-leading advantage in volatile energy markets.