
June 10, 2026
Understanding Market Psychology Behind Precious Metals Volatility
The recent gold and silver market correction exemplifies how speculative euphoria can create unsustainable price trajectories. When momentum-driven positioning reaches extreme levels, markets become vulnerable to rapid reversals that often catch participants off-guard. Furthermore, examining gold prices as inflation hedge dynamics reveals how psychological factors intertwine with fundamental analysis during volatile periods.
The anatomy of this process reveals several interconnected behavioural finance principles operating simultaneously across precious metals trading venues.
The Anatomy of Speculative Euphoria in Commodity Markets
Fear of missing out drives successive waves of new market entrants during explosive rallies. This psychological phenomenon creates self-reinforcing feedback loops where rising prices attract additional capital, which in turn pushes prices higher still. Academic research in behavioural finance demonstrates that investors exhibit systematic biases during periods of rapid price appreciation, often extrapolating recent trends indefinitely into the future.
Prospect theory explains why market participants display asymmetric responses to gains versus losses. During rallies, investors become increasingly risk-tolerant, while corrections trigger disproportionately strong risk-aversion responses. This asymmetry helps explain why the gold and silver market correction occurred with such intensity following January's spectacular gains.
The mathematics of momentum trading reveal additional complexity. When large numbers of participants employ similar trend-following strategies, their collective positioning can overwhelm normal price discovery mechanisms. Technical indicators like Relative Strength Index readings reached extreme overbought conditions during the January rally, signalling potential reversal vulnerability to experienced traders.
Leverage and Positioning: When Markets Turn Against Themselves
Margin requirements in futures markets enable traders to control large positions with relatively small capital outlays. During euphoric phases, leverage deployment typically increases as traders seek to maximise exposure to perceived opportunities. However, this same leverage becomes destructive during corrections when margin calls force position liquidations regardless of fundamental outlook.
Options market positioning creates additional feedback mechanisms during high volatility periods. Market makers managing short gamma exposure must dynamically hedge their positions, buying as markets rise and selling as they fall. This mechanical hedging amplifies directional movements, particularly during rapid price changes when options dealers face significant exposure adjustments.
The cascade effect of forced liquidations demonstrates how leverage transforms temporary price weakness into sustained selling pressure. As overleveraged positions get stopped out, their liquidation adds to downward momentum, triggering additional stop-losses and creating self-perpetuating decline cycles.
When big ASX news breaks, our subscribers know first
Why Did Gold and Silver Experience Such Dramatic Reversals?
Market structure vulnerabilities amplified what might otherwise have been modest profit-taking into dramatic reversals. The combination of technical overextension, positioning extremes, and liquidity degradation created conditions ripe for sharp corrections in both metals. Moreover, comprehensive gold market surge analysis reveals underlying structural factors that contributed to these volatile movements.
Technical Overextension Signals That Preceded the Correction
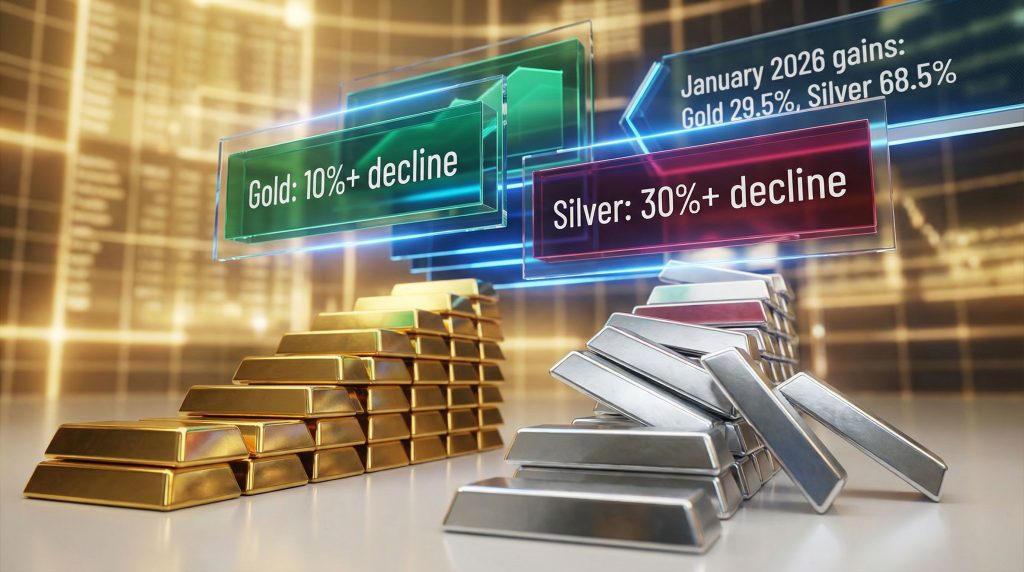
Gold's 29.5% January gains pushing prices to $5,602 per ounce represented an unprecedented rate of appreciation that strained technical indicators. RSI divergence patterns showed momentum weakening even as prices continued rising, a classic warning signal that experienced technical analysts monitor closely.
Volume profile analysis revealed institutional distribution activity during the rally's final phases. This pattern suggests professional traders were reducing long positions while retail enthusiasm remained elevated. Such divergence between institutional and retail behaviour often precedes significant reversals.
Silver's 68.5% January surge to intraday highs above $121 per ounce created even more extreme technical conditions. The velocity of silver's ascent left virtually no support levels beneath current prices, meaning any selling pressure would encounter minimal buying interest until much lower levels.
Critical support zones identified by technical analysts include:
- $4,700 per ounce for gold as an initial stabilisation target
- $4,600 per ounce representing a broader support band for potential price discovery
Liquidity Dynamics in Precious Metals Markets
Market maker risk management protocols tightened significantly as volatility increased during January's rally. Reduced willingness among liquidity providers to maintain deep order books resulted in thinner markets and wider bid-ask spreads. This microstructural deterioration meant smaller order sizes could move prices more dramatically than under normal conditions.
Algorithmic trading systems programmed to reduce exposure during high volatility periods withdrew liquidity precisely when markets needed it most. Cross-market stress indicators suggested broader financial system nervousness, further encouraging systematic trading strategies to reduce risk exposure.
The feedback loop between declining liquidity and increasing volatility created a "liquidity spiral" where each increment of market stress made subsequent price movements larger and more unpredictable. Additionally, silver market squeeze impact analysis demonstrates how these dynamics affected global financial markets more broadly.
Federal Reserve Policy Expectations and Precious Metals Pricing
Monetary policy expectations form a crucial backdrop for precious metals valuations. The gold and silver market correction coincided with shifting perceptions about Federal Reserve policy direction, particularly following personnel changes and evolving inflation data.
Kevin Warsh Nomination Impact on Monetary Policy Outlook
Donald Trump's announcement of Kevin Warsh as Federal Reserve Chair nominee introduced new uncertainty into monetary policy expectations. Warsh's previous tenure as Federal Reserve Governor from 2006-2011 established him as an inflation hawk who favoured tighter monetary conditions during the post-crisis period.
Market participants interpreted the nomination through multiple lenses. While Warsh's hawkish reputation initially pressured precious metals, some analysts argued political pressure for lower interest rates might ultimately constrain the Federal Reserve's independence regardless of leadership changes. According to recent CNBC reporting, this policy uncertainty contributed significantly to the dramatic sell-off in both metals.
Historical analysis of Fed Chair appointments shows markets often overreact to initial personnel announcements before settling into patterns based on actual policy implementation. This suggests the immediate impact on precious metals pricing may prove temporary.
Interest Rate Sensitivity in Gold and Silver Markets
Current federal funds rate levels of 3.50%-3.75% established following the FOMC's late January decision provide a baseline for policy expectations. CME FedWatch Tool pricing indicates markets expect the first rate hike in June 2026 alongside two total rate cuts for calendar year 2026.
Alternative forecasts from institutions like BNP Paribas suggest no rate changes throughout 2026, maintaining the current corridor for the full calendar year. This divergence in expectations creates uncertainty that typically weighs on precious metals valuations.
Real yield calculations become crucial for understanding opportunity cost dynamics. Rising nominal interest rates combined with stable inflation expectations increase real yields, making non-yielding assets like gold and silver less attractive relative to interest-bearing alternatives.
Recent inflation data adds complexity to rate expectations:
| Inflation Metric | December 2025 (YoY) |
|---|---|
| Producer Price Index | +3.0% |
| Core PPI (ex-food, energy) | +3.3% |
These figures suggest persistent producer-level price pressures that could constrain Federal Reserve willingness to cut rates aggressively.
Comparing Gold vs Silver: Why Silver Fell Harder
The disparity in correction magnitudes between gold and silver reveals fundamental differences in market structure and investor behaviour. Silver's 30%+ decline compared to gold's 10%+ drop illustrates how leverage, liquidity, and market participation patterns create asymmetric volatility responses.
Industrial Demand Factors Affecting Silver's Risk Profile
Silver's dual role as both precious metal and industrial commodity creates additional volatility channels not present in gold markets. Solar panel manufacturing represents a significant source of silver demand, with photovoltaic applications consuming substantial quantities annually. Economic sensitivity in technology sectors can therefore impact silver prices through demand fluctuations rather than purely speculative factors.
Substitution risks in industrial applications add another layer of complexity. Unlike gold's relatively inelastic demand profile, silver faces potential replacement by alternative materials in various technological uses if prices reach prohibitive levels. This demand elasticity makes silver more vulnerable to price corrections than gold.
Supply chain disruption vulnerabilities also affect silver disproportionately. Manufacturing delays in key consuming industries can create temporary demand imbalances that amplify price volatility beyond levels seen in gold markets.
Market Structure Differences Between Gold and Silver Trading
Comparative analysis reveals stark differences in market characteristics:
| Metric | Gold | Silver | Impact |
|---|---|---|---|
| Market Capitalisation | Significantly larger | Smaller | Higher volatility in silver |
| Liquidity Depth | Deeper order books | Thinner markets | Larger price gaps in silver |
| Institutional Participation | High (central banks, sovereigns) | Lower | More retail-driven silver volatility |
| Leverage Usage | Moderate | Higher | Amplified corrections in silver |
Central bank participation provides natural buying interest for gold during corrections, creating price floors that silver lacks. Sovereign wealth funds and institutional asset managers typically maintain strategic gold allocations but rarely hold comparable silver positions.
The 2.3:1 ratio of silver's January gains versus gold's appreciation suggests traders deployed disproportionate leverage in silver positions. Higher leverage amplifies both upside participation and downside risk, explaining silver's more dramatic correction.
What Technical Levels Matter for Recovery or Further Decline?
Technical analysis provides roadmaps for potential price discovery zones during volatile periods. The gold and silver market correction has established new reference points that traders will monitor for signs of stabilisation or continued weakness. In addition, gold safe‐haven insights offer valuable perspective on longer-term positioning strategies during market turbulence.
Critical Support and Resistance Zones for Gold
Fibonacci retracement analysis from the January rally's starting point to the $5,602 peak identifies several potential support levels:
- 38.2% retracement: Approximately $4,850 per ounce
- 50% retracement: Around $4,650 per ounce
- 61.8% retracement: Near $4,450 per ounce
Moving average convergence points provide additional reference levels. The 50-day moving average often acts as dynamic support during corrections, while the 200-day average represents longer-term trend significance.
Volume-weighted average price calculations anchored to key rally phases can identify zones where institutional accumulation previously occurred. These levels often attract renewed buying interest during corrections.
Silver's Path Forward: Industrial vs Investment Demand Balance
Silver's recovery trajectory depends partly on industrial buying patterns during price weakness. Historical analysis shows manufacturing consumers often increase purchases when prices decline significantly, providing natural demand floors.
The gold-silver ratio provides relative value insights for tactical allocation decisions. Current ratios above historical averages suggest silver may offer superior risk-adjusted returns if both metals recover proportionally.
Options market positioning analysis reveals gamma exposure concentrations that could amplify recovery moves if sentiment shifts. Large options positions create mechanical buying pressure when markets move in their favour.
Investment Strategy Implications During Precious Metals Corrections
Portfolio management during high volatility periods requires careful consideration of position sizing, correlation patterns, and hedging techniques. The gold and silver market correction offers lessons for strategic asset allocation approaches, whilst detailed gold price forecast overview provides additional context for long-term planning.
Portfolio Risk Management During High Volatility Periods
Position sizing becomes critical when volatility increases dramatically. Mathematical Kelly Criterion calculations suggest reducing position sizes as volatility rises to maintain consistent risk-adjusted exposure levels.
Correlation analysis during stress periods often reveals that diversification benefits disappear precisely when they are needed most. Both gold and silver demonstrated positive correlations with broader market stress, reducing their safe-haven effectiveness during the correction.
Hedging strategies using precious metals ETFs or derivatives require careful consideration of tracking error and counterparty risk. Physical holdings avoid these complications but sacrifice liquidity and introduce storage costs.
Long-term vs Short-term Investment Perspectives
Dollar-cost averaging approaches can benefit from increased volatility by allowing accumulation at varied price levels. Systematic purchasing programmes reduce timing risk whilst capturing average prices over extended periods.
Macroeconomic scenario analysis suggests several factors continue supporting long-term precious metals demand:
- Central bank reserve diversification trends
- Geopolitical tension effects on safe-haven demand
- Currency debasement concerns across major economies
- Energy transition metal competition dynamics
Value investing principles suggest significant corrections often create entry opportunities for patient capital. However, distinguishing temporary corrections from fundamental trend changes requires careful analysis of underlying demand drivers.
The next major ASX story will hit our subscribers first
Global Economic Context: Beyond US Monetary Policy
International developments provide additional context for precious metals market dynamics extending beyond domestic US policy considerations. Furthermore, analysis from The Conversation highlights how global investors must understand these broader economic forces before making investment decisions.
Central Bank Gold Purchases and Reserve Diversification Trends
Emerging market central banks continue accumulating gold reserves as part of broader reserve diversification strategies. This institutional demand provides fundamental support that typically persists through short-term volatility periods.
Geopolitical tensions create ongoing safe-haven demand that operates independently of monetary policy cycles. Recent international developments suggest this demand source remains robust despite temporary price corrections.
Currency debasement concerns across major economies support precious metals demand through multiple channels. European Central Bank policies, Japanese yen weakness, and Chinese yuan dynamics all contribute to global monetary uncertainty.
Inflation Expectations and Real Asset Allocation
Producer price trends provide leading indicators for consumer inflation developments. Current data showing 3.0% overall and 3.3% core producer price growth suggests ongoing inflationary pressures that historically support precious metals demand.
Supply chain disruption effects continue influencing commodity pricing across multiple sectors. Energy transition metal demand creates competition for mining investment and production capacity, potentially affecting traditional precious metals supply dynamics.
Real asset allocation trends among institutional investors reflect growing concerns about financial asset valuations and inflation protection needs. These structural shifts typically support precious metals demand over extended periods.
Market Structure Evolution and Future Volatility Patterns
Technological and structural changes in precious metals markets create new dynamics that influence volatility patterns and price discovery mechanisms.
ETF Flows and Their Amplification Effects
Precious metals ETF redemptions during corrections directly impact underlying markets through authorised participant mechanisms. Large outflows require physical metal sales that can amplify downward price pressure beyond levels justified by fundamental demand changes.
Institutional versus retail flow patterns during corrections reveal different behavioural responses. Professional managers often reduce exposure systematically, whilst retail investors tend to exhibit more emotional buying and selling patterns.
The role of authorised participants in price discovery has grown significantly as ETF assets under management increased. These market makers now represent crucial liquidity sources whose risk management decisions directly affect precious metals pricing.
Cryptocurrency Competition and Digital Gold Narratives
Bitcoin correlation patterns with precious metals during stress periods provide insights into generational differences in safe-haven asset preferences. Younger investors increasingly view cryptocurrency as digital alternatives to traditional precious metals.
Technology disruption of store-of-value concepts challenges traditional precious metals investment narratives. However, physical metals retain advantages during extreme stress periods when digital assets may become inaccessible.
The evolution of central bank digital currencies introduces additional complexity to monetary system dynamics that could influence precious metals demand patterns over time.
Market Structure Evolution and Recovery Outlook
Professional market observers emphasise that macroeconomic forces supporting precious metals remain intact despite recent volatility. The correction represents positioning adjustments within ongoing trends rather than fundamental demand destruction.
Recovery timeframes from previous corrections suggest markets often stabilise within weeks when fundamental drivers remain supportive. However, broader trading ranges appear likely as leverage gets reduced and positioning normalises.
Key takeaway: The gold and silver market correction of 10%+ and 30%+ respectively represents normal volatility following speculative euphoria phases. Technical overextension, leverage unwinding, and Federal Reserve policy recalibration drove the selloff rather than fundamental demand destruction.
Disclaimer: This analysis is for educational purposes only and does not constitute investment advice. Precious metals investing involves significant risks including potential total loss of capital. Past performance does not guarantee future results. Consult qualified financial professionals before making investment decisions.
Ready to Stay Ahead of Market-Moving Discoveries?
Discovery Alert's proprietary Discovery IQ model provides real-time alerts on significant ASX mineral discoveries, helping investors identify actionable opportunities before the broader market reacts to major announcements. Start your 14-day free trial today and gain the market intelligence needed to navigate volatile precious metals markets with confidence.