May 11, 2026
Not All Commodities Bleed the Same Way in a War
Geopolitical conflict has a well-established history of compressing commodity demand. When shipping lanes become contested, insurance costs spike, freight rates surge, and buyers pull back. The assumption embedded in most commodity risk models is that war disrupts supply chains uniformly, pushing prices up while demand retreats in response to uncertainty. That framework has held reasonably well across oil, metals, and even most fertilizer categories throughout modern history.
But the Middle East conflict potash market anomaly is dismantling that assumption in real time. As regional hostilities have intensified through 2026, a counterintuitive pattern has emerged: potash demand has not only held firm, it has accelerated. Import volumes climbed in key consuming markets during Q1 2026, procurement teams front-loaded purchases rather than deferring them, and prices trended upward not because of supply chain disruption but because buyers were rushing to secure product ahead of anticipated cost increases. For an industry accustomed to tracking war-driven demand destruction, this reversal demands a structural explanation.
When big ASX news breaks, our subscribers know first
How the Conflict Is Reshaping Fertilizer Markets Unequally
Mapping the Disruption Hierarchy Across Fertilizer Categories
The key to understanding potash's anomalous behaviour lies in recognising that the conflict has not created a single uniform shock across global fertilizer markets. Instead, it has produced a tiered disruption hierarchy, with each fertilizer category experiencing a different degree of exposure depending on where it is produced, how it is transported, and which shipping corridors its supply chain depends on.
At the most exposed end of the spectrum sit ammonia and urea, both heavily concentrated in Gulf-region production and deeply reliant on the Strait of Hormuz as the primary export corridor. With approximately 33% of seaborne fertilizer trade transiting the Hormuz chokepoint, any active conflict in the surrounding region creates an immediate stranding risk for these products. Reports of ammonia and urea prices surging by more than $160 per metric ton in a single week during April 2026 reflect the severity of that exposure. Buyers facing supply stranding in a nitrogen-dependent planting season have few short-term alternatives.
Phosphate markets face a different but related problem. The Gulf region supplies approximately 50% of global sulfur exports, and sulfur is an essential feedstock in phosphoric acid production, which underpins the entire phosphate fertilizer manufacturing chain. Constraining sulfur exports consequently constrains phosphate output downstream. This cascading mechanism has created sharp upward price pressure across DAP and MAP markets that is not simply a freight cost story but a genuine input availability crisis.
Sulfur itself, given its overwhelming dependency on Gulf export infrastructure, sits at the top of the disruption hierarchy alongside ammonia.
The following table illustrates the differentiated impact across fertilizer categories:
| Fertilizer Type | Conflict Exposure Level | Price Direction (April 2026) | Primary Vulnerability |
|---|---|---|---|
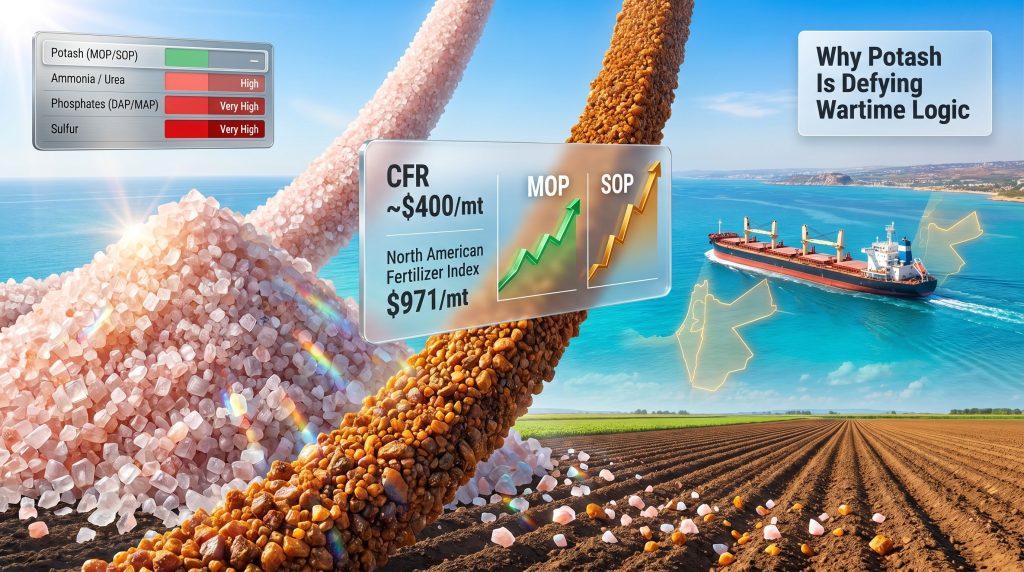
| Potash (MOP/SOP) | Low to Minimal | Gradually rising; CFR approaching $400/mt | Indirect freight and insurance cost inflation |
| Ammonia / Urea | Very High | Weekly surge exceeding $160/mt | Gulf supply stranded by Hormuz disruption |
| Phosphates (DAP/MAP) | Medium to High | Sharp upward pressure | Sulfur supply collapse from Gulf region |
| Sulfur | Very High | Significantly elevated | Approximately 50% of global exports transit Hormuz |
The broader North American Fertilizer Index reached $971 per metric ton in early April 2026, reflecting a 5.2% weekly surge. Critically, however, potash's contribution to that index movement reflects freight cost pressures rather than any physical shortfall in supply, which is a distinction that carries significant implications for how buyers and producers should interpret the price signal.
What Makes Potash Structurally Immune to the Conflict
Production Geography as the Decisive Insulating Factor
The single most important variable separating potash from the disruption cascade affecting nitrogen, phosphate, and sulfur is the geographic location of its primary production assets relative to the conflict zone and its critical shipping corridors.
Israel's ICL, operating the Dead Sea Works facility, and Jordan's Arab Potash Company together represent the region's most significant potash producers. Both operations have maintained continuity through the active hostilities of 2026, with export infrastructure at Mediterranean ports, including Ashdod and Jordan's port of Aqaba, continuing to function without material disruption. Crucially, neither facility's export routing depends on the Strait of Hormuz. Product moves through Mediterranean shipping lanes that are geographically isolated from the conflict's primary chokepoint.
The broader production picture reinforces this insulation. The Middle East's combined potash output represents approximately 4.63 million metric tons against an estimated global total of 68.97 million metric tons in 2025. Even in a scenario where regional output experienced some curtailment, the global supply base, centred on massive Canadian operations and substantial Belarusian capacity, would provide meaningful coverage. IDF reservist mobilisations in Israel have not translated into significant workforce shortfalls at ICL's operations, given the company's scale and the specialised nature of mining and processing roles.
Logistics Architecture That Bypasses the Crisis Zone
The routing distinction between potash and other fertilizers cannot be overstated. While Gulf-dependent commodities face insurance exclusion zones, vessel diversions, and extended transit times through alternative routes, potash from Mediterranean ports loads directly onto bulk carriers that sail west into Atlantic trade lanes or east through the Suez Canal without entering conflict-adjacent waters.
This means that the freight cost inflation affecting potash in 2026 is indirect — a general market-wide effect of elevated insurance premiums and fuel costs across bulk shipping — rather than the route-specific surcharges crippling Gulf-origin fertilizer supply chains. The difference between a 5 to 10% freight cost increase and a logistically stranded cargo is enormous for procurement planning purposes.
Agricultural Calendar as a Non-Deferrable Demand Driver
Beyond the supply-side insulation, potash also benefits from an inelastic demand characteristic that other commodities in wartime environments often lack. Spring planting windows are biologically fixed. A grower in Brazil, the United States, or India cannot decide to postpone applying potassium to their soil until geopolitical uncertainty resolves.
This inelasticity creates a procurement dynamic where buyers respond to uncertainty by accelerating purchases rather than deferring them. Furthermore, if freight costs are expected to rise further, or if there is any risk of supply availability narrowing, the rational response for a large agricultural operation is to bring forward procurement and secure contracted volumes. That behaviour is precisely what the record Q1 2026 import volumes reflect. The broader critical minerals demand narrative playing out across global commodity markets reinforces this dynamic.
Who Controls Global Potash Supply and Why That Concentration Matters
The Oligopolistic Structure Under Geopolitical Scrutiny
The global potash industry is one of the most concentrated commodity markets in the world. Three dominant production blocs effectively set the tone for global supply availability and price direction: Nutrien in Canada, the world's largest potash producer by capacity; Mosaic, another major North American producer; and Belaruskali, the Belarusian state enterprise whose exports have been subject to significant Western sanctions following the 2022 onset of conflict in Ukraine.
Nutrien and Mosaic coordinate their export marketing through Canpotex, the Canadian Potash Exporters consortium, which serves as the commercial vehicle for offshore sales from Canadian mines. This export coordination mechanism gives the North American bloc considerable influence over global pricing and volume allocation, particularly to major markets in Brazil, India, and Southeast Asia.
The Belarus sanctions regime, now well into its third year of market impact entering 2026, has already fundamentally restructured trade flow patterns. European buyers have progressively reduced their exposure to Belarusian product, rerouting procurement toward Canadian and Jordanian sources. This pre-existing fragmentation of traditional supply relationships has made the global potash market simultaneously more resilient in some corridors and more concentrated in others — an irony that the geopolitical risk landscape analysts frequently overlook.
Import Dependency Profiles of Key Consuming Nations
The vulnerabilities of import-dependent potash consumers vary significantly by country, reflecting different procurement strategies, source diversification, and strategic stockpiling practices:
| Country | Primary Potash Import Sources | Import Dependency Profile |
|---|---|---|
| United States | Canada ( |
High dependency, largely from stable allied sources |
| Brazil | Multiple international sources via Canpotex and bilateral agreements | Near-total import dependency (~98%) |
| India | Canada, Belarus, Russia, Jordan | Near-complete import dependency, price-sensitive procurement |
Brazil's extreme import dependency has long been a strategic vulnerability for South America's dominant agricultural economy. Domestic potash exploration and development projects, including operations in the Sergipe evaporite basin, represent a long-term structural response to this exposure, though meaningful domestic production at commercial scale remains a multi-year prospect for most undeveloped deposits.
The lesson from Brazil's situation applies more broadly: nations that depend on a small number of source countries for a nutrient as essential as potassium are exposed not just to supply disruption but to negotiating disadvantage in periods of market tightness.
MOP and SOP: Two Products, Two Very Different Stress Profiles
Muriate of Potash: Freight-Led Inflation Without Physical Supply Shock
Muriate of Potash (MOP), the most commonly traded potash product globally, contains approximately 60% potassium oxide (K₂O) and is mined primarily from underground evaporite deposits in Saskatchewan, Canada, as well as from solution mining operations in Belarus, Russia, and Germany. The vast majority of global potash consumption, estimated at roughly 85 to 90% of total volume, uses MOP as its base form.
In the context of the current conflict, MOP pricing has trended upward toward the $400 per metric ton CFR threshold, but the driver is not supply scarcity. Canadian and non-Middle Eastern producers are operating normally, and global MOP supply availability has not been materially reduced. The price pressure reflects:
- Insurance premium surcharges on bulk vessels operating in proximity to conflict zones
- Elevated bunker fuel costs flowing through bulk freight rate indices
- Precautionary buying behaviour by large agricultural importers front-loading Q2 and Q3 requirements
- General market sentiment responding to elevated fertilizer index readings driven by nitrogen and phosphate disruption
The Canadian and Belarusian supply base effectively serves as a price ceiling anchor for MOP, because both production regions have substantial unutilised capacity that can be brought online relatively quickly if spot prices rise enough to justify incremental output. This capacity overhang moderates the upside for MOP pricing even in an elevated conflict environment.
Sulphate of Potash: A Fundamentally Different Risk Architecture
Sulphate of Potash (SOP) is a premium product containing approximately 50% potassium oxide (K₂O) alongside sulfate rather than chloride as its anion. Because it is chloride-free, SOP is the preferred potash form for chloride-sensitive crops including fruits, vegetables, tobacco, tea, and certain specialty grains. It typically commands a price premium of $150 to $250 per metric ton above equivalent MOP grades, reflecting both its agronomic advantages and its more complex production process.
The dominant production method for synthetic SOP is the Mannheim process, which reacts muriate of potash with sulfuric acid derived from elemental sulfur at high temperatures to produce SOP and hydrochloric acid as a co-product. The critical insight here is that the Mannheim process creates a direct cost linkage between global sulfur prices and SOP production economics.
With approximately 50% of global sulfur exports originating from Gulf-region producers, the current conflict has created a cost-push inflation dynamic within the SOP segment that MOP simply does not experience. The transmission mechanism operates as follows:
- Gulf region conflict disrupts sulfur export terminals and shipping insurance
- Global sulfur spot prices rise as available supply narrows
- Mannheim process SOP producers face higher sulfuric acid input costs
- SOP production economics deteriorate, particularly for smaller and marginal producers
- SOP prices rise as producers pass through input cost increases and as weaker producers reduce output
- The MOP-SOP price spread widens, creating differentiated procurement pressures for buyers of each product
The widening spread between MOP and SOP prices in 2026 is one of the most technically significant market signals emerging from the conflict. It reveals that the fertilizer market is not experiencing a uniform price shock but rather a differentiated cost structure reorganisation with lasting implications for specialty crop nutrition economics.
This matters enormously for growers of high-value specialty crops who have limited ability to substitute MOP for SOP without risking chloride toxicity damage to their produce. Unlike commodity grain producers who can theoretically adjust between fertilizer types under some conditions, specialty crop operators are effectively locked into SOP procurement regardless of price direction.
The CBAM Dimension: Regulatory Risk Layered onto Geopolitical Risk
How the EU Carbon Border Adjustment Mechanism Complicates European Potash Procurement
European potash buyers are navigating a dual-pressure environment in 2026 that combines the geopolitical freight risk of the current conflict with an emerging regulatory cost layer from the EU's Carbon Border Adjustment Mechanism (CBAM). In addition, the critical raw materials supply agenda in Brussels is simultaneously pushing European policymakers toward accelerated procurement diversification across fertilizer and mineral categories.
CBAM applies a carbon cost to imports of certain goods, including fertilizers, based on the embedded carbon intensity of their production. The practical effect for potash is that product sourced from high-emission producers — principally Belarusian and Russian operations that rely heavily on carbon-intensive energy inputs — faces an additional cost impost when entering EU markets from 2026 onward.
This regulatory mechanism is gradually accelerating European buyer diversification toward lower-carbon supply origins, primarily Canadian potash, which benefits from relatively cleaner energy inputs in Saskatchewan's mining and processing operations, and Jordanian production from Arab Potash Company. The confluence of CBAM cost pressure and geopolitical freight risk from the current conflict is creating a procurement environment in which European buyers have both economic and risk-management incentives to restructure their supply chains away from traditional Eastern European sources.
For producers positioned in low-carbon, conflict-insulated supply regions, this dual-pressure environment represents a structural market share opportunity that extends beyond the duration of any single geopolitical episode.
The next major ASX story will hit our subscribers first
Forward Risk Scenarios: Three Pathways for the Potash Market
Not all outcomes from the current conflict carry equal probability, and the potash market's anomalous resilience is conditional rather than unconditional. A scenario-based framework helps procurement teams, producers, and investors calibrate their positioning against the range of plausible trajectories.
Scenario 1: Contained Conflict (Base Case)
The Hormuz blockade remains partial or intermittent. Potash supply chains from the Mediterranean region and Canada continue uninterrupted. MOP CFR prices consolidate below $420 per metric ton. Freight cost inflation moderates as conflict intensity stabilises. Demand through H2 2026 planting cycles remains robust.
Scenario 2: Conflict Escalation (Adverse Case)
Secondary effects materialise: rail network disruptions in the Levant region, broader civilian mobilisation impacts on ICL and Arab Potash Company workforce availability, and Mediterranean shipping insurance costs rise materially as conflict geography expands. SOP prices spike further as sulfur supply remains constrained. Canpotex and non-Middle Eastern producers partially absorb demand reallocation but face lead time constraints.
Scenario 3: Prolonged Stalemate with Structural Market Repricing (Tail Risk)
Multi-year conflict embeds elevated freight and insurance costs as permanent features of potash trade economics. Import-dependent nations accelerate domestic production investment and diversified bilateral supply agreements. The World Bank's projected 2026 fertilizer price average of approximately 30% above prior year levels becomes a baseline rather than a peak reading, with urea's approximately 60% price trajectory creating nitrogen-potash substitution pressure in price-sensitive markets. The global potash price floor is consequently repriced upward as the industry internalises a new risk premium.
Key Indicators Worth Monitoring
For market participants tracking the evolution of the Middle East conflict potash market anomaly, the following indicators provide the clearest early warning signals of trajectory change:
- ICL Dead Sea Works and Arab Potash Company operational reporting: the most direct leading indicator for regional supply continuity
- Strait of Hormuz transit volumes for bulk vessels: a proxy for broader fertilizer market stress and sulfur cost trajectory
- MOP-SOP price spread movement: signals the degree to which sulfur cost shocks are transmitting into finished potash pricing and widening between product categories
- Q2 to Q3 2026 import data from Brazil, India, and Southeast Asian markets: will confirm whether demand resilience extends beyond the spring planting window or is concentrated in a single procurement cycle
- Bulk carrier freight rate indices on Atlantic and Pacific potash trade routes: the earliest measurable signal of cost-push price inflation before it reaches CFR benchmarks
- European CBAM compliance cost assessments: will determine the pace of supply chain restructuring away from high-carbon origins
Furthermore, the commodity price impacts flowing from these indicators will increasingly influence producer investment decisions and capital allocation across the global potash sector.
Red Flags That Signal Transition from Anomaly to Crisis
- Any confirmed disruption to ICL's Dead Sea Works production or export port access that materially reduces Mediterranean potash loading capacity
- Sulfur spot prices reaching levels that make Mannheim process SOP production economically marginal for mid-tier producers, accelerating market concentration
- Secondary conflict escalation drawing in non-regional actors and triggering broader shipping insurance exclusion zones that extend into Mediterranean trade lanes
The Conditional Nature of Potash's Resilience
The structural case for potash's anomalous performance during the current conflict is both logically coherent and empirically supported by the market data emerging through the first half of 2026. Geographic production insulation, Mediterranean logistics independence, the concentrated North American supply base, and agricultural demand inelasticity combine to create a uniquely protected position within the broader fertilizer market disruption.
However, calling this resilience unconditional would be analytically imprecise. The conditions under which the anomaly holds require continued operational continuity at regional production facilities, Mediterranean shipping lane stability, and sulfur supply disruption remaining contained to the SOP cost structure rather than cascading further through the supply chain.
For procurement professionals, the rational response to this conditional resilience is front-loading and supply source diversification, not complacency. For producers and investors, the CBAM-geopolitical convergence is creating a structural market repositioning opportunity that favours low-carbon, conflict-insulated supply origins over a multi-year horizon that extends well beyond the resolution of any single regional conflict.
The broader lesson potash is teaching commodity markets in 2026 is as old as risk management itself: geography determines vulnerability, and supply chain architecture is always the decisive variable when geopolitical stress maps unevenly across an interconnected global market.
This article is analytical in nature and does not constitute financial or investment advice. Commodity price projections, scenario outcomes, and market trajectory assessments involve inherent uncertainty and should not be relied upon as predictions of future performance. Readers with procurement, investment, or risk management decisions should seek independent professional advice tailored to their specific circumstances. Market data referenced reflects conditions reported during early to mid-2026 and is subject to change as the geopolitical situation and commodity market dynamics evolve.
Want to Capitalise on the Next Major Mineral Discovery Before the Broader Market?
Discovery Alert's proprietary Discovery IQ model delivers real-time alerts on significant ASX mineral discoveries — turning complex commodity data into actionable investment insights for both short-term traders and long-term investors. Explore historic examples of major discovery returns on Discovery Alert's dedicated discoveries page and begin your 14-day free trial today to position yourself ahead of the market.