June 24, 2026

Global energy markets operate within an intricate web of dependencies that extends far beyond simple supply and demand calculations. When examining the fundamental architecture of modern economic systems, energy infrastructure emerges as the silent orchestrator of everything from manufacturing costs to currency valuations. Recent developments in Middle East tensions energy supply chain shock have exposed the fragile nature of these interconnected systems, revealing how quickly localised disruptions can cascade through global supply chains and reshape entire economic landscapes.
Understanding these dynamics requires looking beyond immediate price movements to examine the deeper structural vulnerabilities that define modern energy markets. The current period of heightened geopolitical risk illuminates long-standing weaknesses in global energy supply chain architecture while simultaneously accelerating transformative changes in how nations approach energy security and economic resilience.
How Do Geopolitical Energy Shocks Reshape Global Supply Chain Architecture?
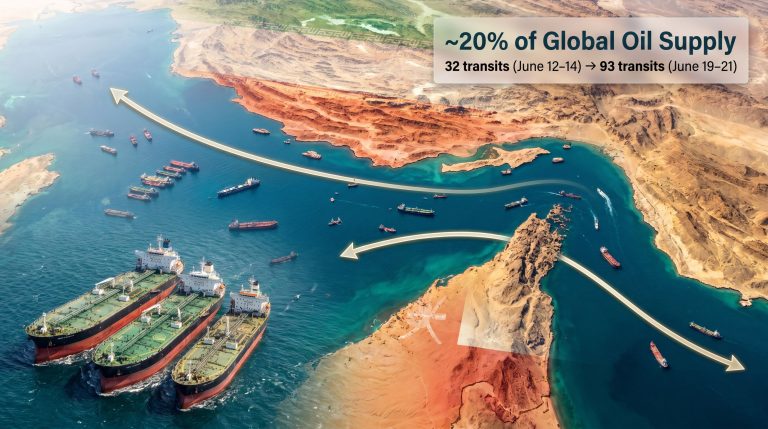
The anatomy of global energy vulnerability reveals itself most clearly during periods of crisis. Maritime chokepoints function as critical arteries in the global energy system, with the Strait of Hormuz serving as what analysts describe as the world's energy aorta. When tensions escalate in key regions, the immediate impact on energy flows demonstrates how concentrated these vital pathways have become, often leading to significant oil price volatility.
Recent market data illustrates the stark regional disparities in energy vulnerability. European liquified natural gas prices surged approximately 70% during recent conflict escalation, while United States natural gas prices increased only 8% over the same period. This 62-percentage-point differential reveals the geographic clustering of energy infrastructure vulnerabilities that defines modern market structures.
The Economics of Critical Infrastructure Dependency
Chokepoint economics operate on the principle that alternative routing options carry substantial cost premiums. When primary energy transport routes face disruption, the economic impact extends far beyond simple rerouting costs. Maritime vessels forced to circumnavigate Africa instead of transiting the Strait of Hormuz face additional journey distances of approximately 6,000-8,000 nautical miles, translating to 2-3 weeks of extra transit time and measurable increases in fuel consumption and insurance premiums.
The infrastructure interdependency extends beyond transportation to encompass specialised facilities that cannot be quickly replicated or replaced. LNG regasification terminals, for example, represent billions of dollars in fixed infrastructure that serves specific regional markets. Unlike oil, which can utilise flexible storage and distribution networks, LNG requires point-to-point infrastructure connections that create localised vulnerability clusters.
Strategic reserve utilisation patterns during energy supply chain shock events reveal the limited buffer capacity available to import-dependent economies. While the United States Strategic Petroleum Reserve can theoretically provide approximately 90 days of import coverage, many importing nations maintain significantly lower strategic reserves relative to their consumption patterns.
Furthermore, the Middle East energy crisis has highlighted how regional conflicts can trigger widespread economic disruptions across global markets.
Regional Energy Import Dependencies and Risk Exposure
| Region | Oil Import Dependency | LNG Import Dependency | Primary Vulnerability Factors |
|---|---|---|---|
| Asia-Pacific | 84% via Persian Gulf | 83% via Persian Gulf | Manufacturing disruption, petrochemical supply |
| Europe | 45% via Middle East | 65% via imports | Power generation, industrial heating |
| North America | 15% via imports | 25% via imports | Transportation sector, chemical production |
The data demonstrates how geographic positioning and domestic production capacity create vastly different risk profiles across regions. Asian economies face the highest exposure due to their dependence on Middle Eastern energy supplies and the concentration of shipping routes through potential conflict zones.
Supply Chain Stress Testing and Alternative Mechanisms
Multi-modal transport analysis reveals how energy supply chain shock events force expensive transitions between transportation methods. Pipeline disruptions typically require shifting to truck or rail transport, which can cost 3-5 times more per unit of energy delivered. Similarly, LNG terminal congestion forces importers to compete for limited spot market cargoes, driving prices significantly above long-term contract rates.
The cost premiums associated with alternative transport routes reflect both direct operational expenses and indirect market factors. Insurance markets play a particularly crucial role, as Lloyd's of London and other major insurers can effectively create shipping embargoes by withdrawing coverage for vessels transiting high-risk areas. This insurance dimension often proves more restrictive than physical infrastructure limitations.
Inventory buffer calculations highlight the temporal dimension of supply chain resilience. While oil markets benefit from substantial global storage capacity and flexible distribution networks, natural gas trends operate with much tighter inventory buffers. European gas storage facilities, despite significant expansion since 2022, provide only seasonal coverage rather than the multi-month security offered by strategic petroleum reserves.
When big ASX news breaks, our subscribers know first
What Are the Macroeconomic Transmission Mechanisms of Energy Supply Shocks?
Energy price volatility transmits through economic systems via multiple interconnected pathways that extend far beyond direct fuel costs. The speed and magnitude of these transmission mechanisms depend heavily on the structure of individual economies and their exposure to Middle East tensions energy supply chain shock dynamics.
Primary energy cost pass-through represents the most immediate transmission channel. Transportation costs respond within days through fuel surcharges and freight rate adjustments. Heating and electricity costs follow within weeks as utility companies adjust pricing mechanisms. These direct effects create measurable inflation pressure even before broader economic adjustments occur.
Inflation Pathway Analysis and Economic Growth Impacts
Secondary manufacturing effects concentrate in energy-intensive industries where fuel and electricity represent substantial input costs. Steel production, which requires high-temperature heat typically generated from natural gas, faces immediate margin pressure when energy costs spike. The 70% increase in European natural gas prices observed during recent tensions translates to approximately 10-15% higher steel production costs, assuming energy represents 15-20% of total input expenses.
Aluminium smelting operates at even higher energy intensity, with electricity costs representing 20-30% of production expenses. Chemical manufacturing, particularly fertiliser production through ammonia synthesis, faces extreme sensitivity to natural gas price fluctuations. These industries often reduce production capacity during extended periods of elevated energy costs, creating secondary supply shortages in downstream manufacturing sectors.
Tertiary service sector impacts follow through logistics and consumer spending channels. Aviation fuel price increases translate directly to ticket pricing within 2-4 weeks as carriers adjust dynamic pricing algorithms. The hospitality sector faces combined pressure from higher energy costs and reduced discretionary spending by consumers facing elevated household energy bills.
Central Bank Policy Response Frameworks and Effectiveness Limits
The distinction between supply-side and demand-driven inflation creates significant challenges for monetary policy makers. Traditional interest rate tools prove less effective when inflation originates from supply constraints rather than excess demand. Recent analysis suggests that sticky inflation remains the key risk if disruptions endure, particularly in an era of global economic fragmentation.
U.S. 10-year Treasury yields climbing to 4.11% during recent Middle East tensions reflects market expectations of inflationary supply shock rather than typical safe-haven dynamics. This yield increase contradicts historical patterns during geopolitical crises, when Treasury bonds typically rally on flight-to-quality demand.
Critical Economic Insight: Supply-driven inflation episodes create stagflationary pressures that render traditional monetary policy responses less effective, as interest rate increases cannot directly address supply constraints while potentially exacerbating growth slowdowns.
Emergency coordination mechanisms through institutions like the International Energy Agency provide some policy response capacity through strategic reserve releases and supply coordination. However, these tools offer temporary relief rather than structural solutions to supply chain vulnerabilities. The supply chain disruption has forced policymakers to reconsider traditional economic frameworks.
Currency Impact and Financial Market Transmission
Energy-importing nations face dual pressure during supply crises: commodity prices rise in dollar terms while their currencies weaken relative to the dollar due to increased current account deficits. This creates compounding inflation in local currency terms that amplifies the economic impact of energy price shocks.
Credit market stress emerges as energy-intensive industries face margin compression and potential debt service difficulties. Corporate bond spreads typically widen for companies with high energy exposure, while energy-exporting economies experience improved credit profiles and reduced borrowing costs.
Financial market volatility extends beyond energy sectors to encompass broad-based uncertainty about economic growth prospects and inflation trajectories. Equity market performance divergence becomes pronounced, with energy-importing economies underperforming relative to energy exporters and countries with greater energy independence.
How Do Energy Market Structures Amplify or Dampen Supply Shocks?
The structural differences between oil and natural gas markets create vastly different responses to geopolitical disruptions. Oil markets benefit from global fungibility, extensive storage infrastructure, and multiple transportation options. Natural gas markets, particularly LNG, operate through regional pricing mechanisms and point-specific infrastructure that amplifies local supply disruptions.
Market architecture vulnerabilities become apparent when examining recent price movements across different regions. The 70% increase in European gas prices contrasted with only 8% growth in U.S. natural gas costs illustrates how regional market structures determine shock transmission. Oil markets showed more uniform global price responses due to their integrated nature and flexible routing options.
LNG vs. Pipeline Infrastructure and Regional Price Disconnection
LNG infrastructure creates unique vulnerability patterns because export terminals, specialised shipping, and regasification facilities must function as integrated systems. Disruption at any point in this chain affects entire supply relationships. Unlike oil pipelines that can often reroute through alternative networks, LNG supply chains operate through dedicated point-to-point connections.
The regional nature of LNG pricing reflects these infrastructure constraints. European and Asian markets compete for limited LNG cargoes through spot market bidding, while North American pricing remains tied to domestic production and pipeline networks. This structural difference explains why Middle East tensions energy supply chain shock created immediate price spikes in import-dependent regions while leaving producer regions relatively insulated.
Pipeline infrastructure offers greater volume capacity but lower flexibility compared to LNG shipping. The 2022 European energy crisis demonstrated how pipeline disruptions can force rapid shifts to LNG imports, creating sustained demand pressure and price volatility. Current supply chain stress operates through different mechanisms, with export terminal capacity and shipping availability becoming the primary constraints.
Consequently, LNG market opportunities have emerged for suppliers who can provide alternative routing solutions.
Futures Market Dynamics and Duration Expectations
Oil futures pricing indicated market expectations for disruption duration measured in weeks rather than months, suggesting that financial markets assessed current tensions as manageable within existing supply chain resilience mechanisms. This temporal dimension proves crucial for understanding economic transmission effects, as weeks-long disruptions create different adjustment pressures compared to extended supply constraints.
Contango patterns in futures markets signal market participant beliefs about supply normalisation timelines. When markets shift from normal contango (future prices above spot) to backwardation (future prices below spot), it indicates tight near-term supply expectations. The shape and magnitude of these curve inversions provide quantitative measures of supply stress intensity and expected duration.
Financial market transmission channels extend beyond commodity futures to encompass currency markets, credit spreads, and equity valuations. Energy-importing currencies face systematic weakness during supply disruptions, while energy-exporting currencies strengthen. These exchange rate movements amplify the domestic inflation impact of energy price increases in importing nations.
Insurance and Risk Transfer Market Impacts
Marine insurance withdrawal represents a critical but often overlooked transmission mechanism for supply chain disruptions. When major insurers like Lloyd's of London suspend coverage for vessels transiting high-risk areas, it creates de facto shipping embargoes regardless of physical infrastructure availability. Insurance premiums for covered vessels can increase by 2-5% during supply disruption periods, adding measurable costs to energy transportation.
Political risk premium embedding occurs gradually in energy project financing as investors reassess the long-term stability of supply routes and production regions. These risk premiums become permanent features of energy infrastructure costs, contributing to structurally higher energy prices even after immediate crises resolve.
Derivatives market volatility increases dramatically during energy supply chain shock periods as market participants seek hedging instruments for price and delivery risk. Options pricing reflects elevated uncertainty through higher implied volatility, while hedging costs increase for energy-intensive industries and importing nations.
What Strategic Adaptations Are Reshaping Global Energy Security?
Infrastructure redundancy investments represent one of the most significant long-term responses to energy supply chain vulnerability. The ongoing Saudi exploration license initiatives exemplify strategic routing diversification that reduces dependence on Persian Gulf chokepoints. These developments connect production facilities to alternative export terminals, providing diversified access to global markets.
European accelerated construction of floating storage and regasification units reflects lessons learned from previous supply disruptions. These mobile LNG terminals provide greater flexibility compared to fixed infrastructure and can be repositioned based on changing supply patterns and geopolitical risks.
Strategic partnership realignments involve long-term supply agreements that prioritise reliability over purely economic optimisation. Energy importers increasingly value supply security and diversification alongside cost considerations, leading to multi-source procurement strategies that carry higher costs but reduce concentration risk.
Technology Acceleration and Clean Energy Transition
Energy supply chain shock events consistently accelerate clean energy transition timelines as nations seek to reduce import dependencies and exposure to volatile fossil fuel markets. Solar and wind power investment often surges during periods of conventional energy uncertainty, as renewable sources offer greater supply predictability despite higher upfront capital requirements.
Electric vehicle adoption patterns show acceleration during sustained high oil price periods, as consumers and fleet operators seek alternatives to petroleum-dependent transportation. This behavioural shift creates permanent demand destruction for oil that persists even after prices normalise, contributing to long-term structural changes in energy markets.
Industrial process efficiency investments typically increase during energy cost spikes as manufacturers seek to reduce their exposure to volatile input prices. Energy-intensive industries like steel, aluminium, and chemicals invest in consumption reduction technologies that provide permanent operational improvements and reduced vulnerability to future supply disruptions.
Corporate Supply Chain Resilience Strategies
| Strategy Type | Implementation Timeline | Cost Premium | Risk Reduction Effectiveness |
|---|---|---|---|
| Multi-Source Procurement | 6-18 months | 5-15% | High |
| Regional Inventory Buffers | 3-12 months | 10-25% | Medium |
| Alternative Transport Modes | 1-6 months | 20-50% | Medium |
| Long-term Contract Diversification | 12-36 months | 8-12% | High |
Multi-source procurement strategies involve developing supply relationships across multiple geographic regions and suppliers to avoid concentration risk. While this approach typically increases procurement costs due to reduced economies of scale, it provides significant protection against regional supply disruptions.
Regional inventory buffers require substantial working capital investment but offer immediate protection against short-term supply interruptions. Energy-intensive manufacturers increasingly maintain strategic stockpiles of critical inputs, accepting higher carrying costs in exchange for operational security.
Alternative transport mode preparation involves pre-negotiated agreements for truck, rail, or alternative pipeline capacity during primary route disruptions. These backup arrangements typically cost 20-50% more than primary transportation but provide essential continuity during crisis periods.
How Do Energy Crises Reshape Long-Term Economic Structures?
Permanent risk premium integration occurs as energy infrastructure costs incorporate higher security and redundancy requirements. Insurance premiums, financing costs, and operational expenses all reflect elevated baseline assumptions about geopolitical risk and supply chain vulnerability. These structural cost increases become embedded in long-term energy pricing regardless of immediate crisis resolution.
Geographic production shifts represent one of the most significant long-term structural changes resulting from persistent energy supply chain uncertainty. Manufacturing operations increasingly relocate toward energy-secure regions, even when labour and other input costs are higher. This trend particularly affects energy-intensive industries like aluminium smelting, steel production, and chemical manufacturing.
Strategic industry policy responses involve government intervention in critical energy infrastructure ownership and development. Nations increasingly view energy security as a national security imperative that justifies direct public investment and ownership in strategic facilities, moving away from purely market-driven infrastructure development. Moreover, OPEC production impact decisions increasingly factor in geopolitical considerations alongside market fundamentals.
International Trade Pattern Evolution
Bilateral energy agreements proliferate as nations seek to bypass traditional trading hubs and establish direct producer-consumer relationships. These arrangements often involve long-term contracts, infrastructure cooperation, and strategic partnership elements that extend beyond purely commercial terms.
Currency diversification in energy transactions reflects reduced confidence in dollar-dominated pricing during periods of U.S. policy uncertainty or sanctions regimes. Alternative settlement currencies, including Chinese yuan, euros, and commodity-backed arrangements, gain market share in specific bilateral trading relationships.
Regional economic bloc strengthening occurs as geographic proximity and political alignment become more important factors in energy trade relationships. Asia-Pacific energy cooperation deepens through mechanisms like regional LNG trading hubs and collaborative strategic reserve management.
Innovation Investment Acceleration and Structural Transformation
Long-term Economic Impact: Energy security concerns typically drive 3-5x increases in clean technology R&D spending during major supply disruptions, creating permanent shifts in innovation investment patterns that persist beyond immediate crisis periods.
Research and development priorities shift dramatically during energy crisis periods, with governments and private investors redirecting capital toward technologies that reduce import dependence and improve supply chain resilience. This investment acceleration creates technological capabilities and industrial capacity that provide permanent economic advantages.
Energy infrastructure hardening requirements become standard components of new facility design and existing system upgrades. Cyber security, physical security, and redundancy systems all receive enhanced investment as energy systems adapt to higher threat environments.
Workforce development programmes expand to support domestic energy production and alternative energy technologies. Skills training, education, and research capacity building create human capital investments that support long-term energy independence objectives.
The next major ASX story will hit our subscribers first
What Are the Investment Implications Across Asset Classes?
Equity market sector analysis reveals persistent performance divergence based on energy exposure and geographic positioning. Energy infrastructure companies, including pipeline operators, LNG terminal developers, and strategic storage providers, consistently outperform during periods of supply chain shock as their assets become more valuable in risk-adjusted terms.
Energy-intensive manufacturing sectors face sustained margin pressure and capital allocation challenges as elevated input costs reduce profitability and require substantial adaptation investments. Steel, aluminium, and chemical companies show particular sensitivity to sustained energy price volatility.
Geographic performance patterns demonstrate the importance of energy import dependence in determining market resilience. The 11% decline in South Korea's Kospi index compared to only 2% for the S&P 500 during recent tensions illustrates how energy vulnerability translates directly to equity market performance.
Fixed Income Market Dynamics and Credit Differentiation
Sovereign credit differentiation becomes pronounced as energy exporters experience improved fiscal positions while importers face current account pressures and increased borrowing costs. Credit rating agencies increasingly incorporate energy security assessments into sovereign risk evaluations.
Corporate bond spread widening affects companies based on their energy intensity and supply chain exposure. Investment-grade spreads for energy-dependent industries can increase by 50-100 basis points during sustained supply disruption periods, reflecting elevated business risk and potential earnings volatility.
Inflation-protected securities consistently outperform nominal bonds during energy supply chain shock periods as investors seek protection against accelerating price growth. Treasury Inflation-Protected Securities (TIPS) and similar instruments show strong performance characteristics during supply-driven inflation episodes.
Commodity and Currency Market Implications
Energy commodity futures markets shift from normal contango patterns to backwardation during acute supply stress, indicating tight near-term availability relative to expected future supply. These curve inversions provide quantitative measures of supply chain stress intensity and recovery timeline expectations.
Currency correlation patterns change dramatically during energy crises as traditional safe-haven relationships break down. The U.S. dollar's role as both a safe haven and the primary energy pricing currency creates complex dynamics that can lead to counterintuitive market movements.
Precious metals demand typically increases during prolonged energy supply uncertainty as investors seek inflation hedges and store-of-value assets. Gold and silver often outperform other commodity investments during periods of elevated geopolitical risk and supply chain disruption.
Investment Strategy Considerations: Portfolio diversification strategies must account for the interconnected nature of energy markets and their transmission effects across seemingly unrelated asset classes. Traditional correlation assumptions break down during supply crisis periods, requiring dynamic risk management approaches.
The evolving landscape of global energy security continues reshaping investment priorities and economic structures in ways that extend far beyond immediate crisis resolution. Understanding these transmission mechanisms and adaptation strategies provides essential insight for navigating an increasingly complex and interconnected global economy where Middle East tensions energy supply chain shock dynamics play central roles in determining long-term economic outcomes.
Ready to invest in the next major mineral discovery?
Discovery Alert instantly alerts investors to significant ASX mineral discoveries using its proprietary Discovery IQ model, turning complex mineral data into actionable insights. Understand why historic discoveries can generate substantial returns by visiting Discovery Alert's dedicated discoveries page, and begin your 14-day free trial today to position yourself ahead of the market.