July 31, 2026
When Conflict Rewrites the Commodity Playbook
Commodity markets have historically cycled through two distinct types of price regimes: those driven by the gravitational pull of economic expansion, and those detonated by sudden geopolitical rupture. Each demands a completely different analytical lens. Demand-led supercycles reward producers who invest aggressively, confident that rising consumption will validate every dollar committed to new barrels. Conflict-driven spikes, by contrast, introduce a fundamental paradox: prices surge, cash accumulates at historic speed, yet the very uncertainty that caused the price spike simultaneously argues against deploying that cash.
That paradox sits at the heart of the 2026 upstream energy story. The middle east oil shock upstream windfall has handed global producers one of the most concentrated cash flow opportunities in recent history, yet the industry's response has been conspicuously restrained. Understanding why that restraint is rational, where the windfall is flowing, and what it means for long-range supply adequacy requires peeling back the layers of a market environment unlike anything modelled in a standard commodity cycle.
When big ASX news breaks, our subscribers know first
Why This Price Surge Behaves Differently From Every Cycle Before It
The Anatomy of a Conflict-Driven Price Environment
Most energy investors calibrate their frameworks around demand cycles tied to GDP growth, manufacturing activity, and population-driven consumption trends. The 2026 price environment breaks every one of those models. The crude price surge that has defined this year is not the product of accelerating global growth pulling additional barrels out of storage. It is a supply-destruction event, originating in military conflict and infrastructure disruption across one of the world's most strategically critical transit corridors.
This distinction carries enormous analytical weight. In a demand-led cycle, producers can reasonably project that elevated prices will persist long enough to justify locking capital into multi-year development programs. In a conflict-driven environment, however, the price premium is held hostage to diplomatic outcomes, ceasefire negotiations, and military escalation trajectories that no reserve engineer or capital allocation committee can reliably model. The geopolitical oil market dynamics at play here are fundamentally different from anything the demand-cycle playbook was designed to handle.
"When prices rise because the world wants more energy, producers invest. When prices rise because a chokepoint has been closed by force, the rational response is to wait, accumulate, and preserve optionality."
From $60 to $90: The Scale of the Revision
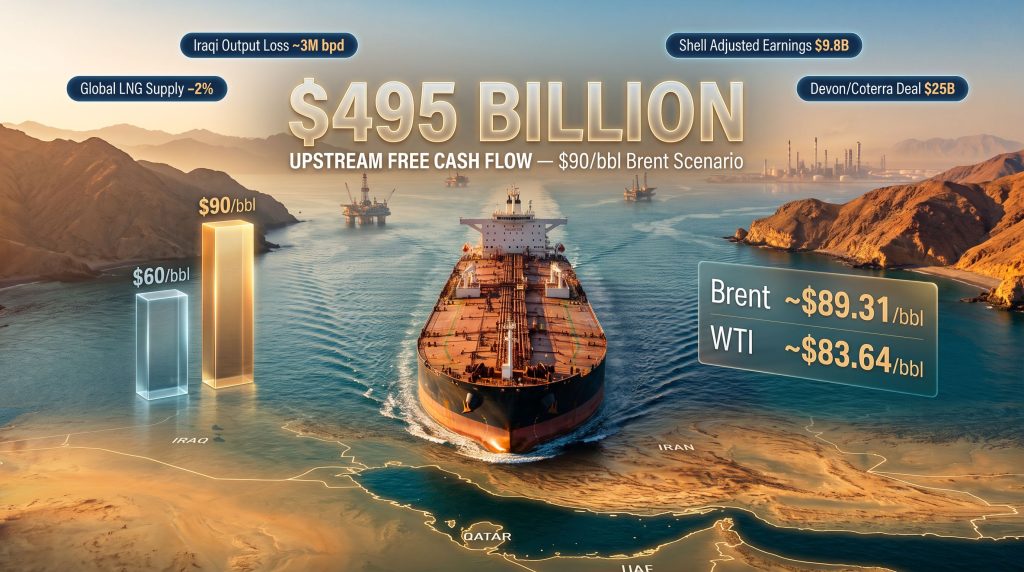
The numbers involved in the 2026 middle east oil shock upstream windfall are genuinely staggering. Wood Mackenzie's revised midyear projection places global upstream free cash flow at $495 billion for the full year, contingent on Brent crude averaging $90 per barrel. That figure represents more than double the analyst firm's earlier forecast, which was anchored to a $60 per barrel baseline. A single geopolitical event has effectively rewritten the entire industry's financial outlook for the year.
The trigger was the escalation of the U.S.-Iran conflict, which drove Brent briefly above $100 per barrel before a partial unwinding of the fear premium returned prices to approximately $89.31/bbl, with WTI settling near $83.64/bbl as of late July 2026. That retreat does not signal safety. It reflects the market's probabilistic discounting of a negotiated resolution, not confirmation that one will materialise. Furthermore, oil price volatility of this magnitude introduces systemic uncertainty that makes forward planning exceptionally difficult for operators across the supply chain.
The Hormuz Chokepoint: Quantifying What a Closed Strait Actually Costs
Infrastructure Disruption at a Global Scale
The Strait of Hormuz handles roughly one-fifth of the world's total oil trade on any given day. When Iran's Islamic Revolutionary Guard Corps declared the strait closed, the immediate arithmetic of supply destruction became visible in price data almost instantly. The disruption radiating outward from that single geographical bottleneck has touched markets far beyond crude benchmarks, as the IMF has documented in its analysis of how the conflict is reshaping energy trade and finance.
| Disruption Factor | Estimated Impact |
|---|---|
| Global oil production decline | At least 3% |
| Iraqi output loss | ~3 million barrels per day |
| Global LNG supply reduction (Qatar infrastructure damage) | ~2% |
| Brent peak during conflict | Above $100/bbl |
| Brent as of late July 2026 | ~$89.31/bbl |
Iraq's exposure is particularly acute. Approximately 3 million barrels per day of Iraqi output has been effectively stranded by route disruptions and infrastructure constraints, removing a volume equivalent to roughly 3% of global supply from accessible markets. Simultaneously, damage to Qatar's Ras Laffan infrastructure has carved approximately 2% out of global LNG supply, compounding the energy security anxiety felt by importing nations across Asia and Europe.
Egypt's direct entry into the conflict represents a further structural escalation factor. Each new actor added to an already complex military theatre increases the probability that a negotiated off-ramp becomes harder to construct, extending the duration of the supply premium embedded in forward pricing curves.
Mapping the $495 Billion: Who Captures the Windfall and Who Doesn't
The Asymmetric Geography of Upstream Cash Flow
One of the least appreciated dimensions of the 2026 upstream windfall is how unevenly it is distributed. Proximity to the disruption zone does not correlate with financial benefit. In fact, the inverse is often true: producers furthest from the conflict corridor are capturing the greatest share of the price upside because they retain full export volumes while selling into a market repriced by scarcity they did not experience. The broader commodity price impacts extend well beyond energy, reshaping input costs and revenue profiles across adjacent resource sectors.
Producers capturing the greatest benefit:
- U.S. unconventional basin operators in the Permian, Eagle Ford, and other domestic formations
- Western integrated majors with diversified upstream portfolios spanning multiple continents
- Canadian oil sands producers, with Western Canadian Select pricing jumping significantly alongside synthetic crude grades
- African basin producers, with Nigeria's Bonny Light rising approximately 6.2% in the relevant period
Producers constrained by volume losses despite higher prices:
- Iraqi operators facing approximately 3 million bpd of export disruption
- Gulf-based producers dependent on Hormuz transit for delivery to Asian customers
- Qatar's LNG sector, with infrastructure damage limiting export throughput
Wood Mackenzie's analysis indicates that the 49 national and international oil companies it tracks most closely are positioned to capture approximately $272 billion of the total $495 billion projected cash flow, representing more than half the entire global upstream windfall concentrated in a relatively narrow group of large-scale operators.
Major Operator Earnings Snapshot
The real-world financial impact is already visible in reported earnings. Shell recorded $9.8 billion in adjusted earnings, supported by a combination of stronger commodity trading performance, higher upstream price realisations, and improved refining margins. Glencore's commodity trading division generated $3.3 billion in trading profit, with market volatility creating arbitrage windows that sophisticated trading operations are uniquely positioned to exploit. Saudi Aramco's revenue profile improved despite lower output volumes, as the per-barrel price uplift more than offset production shortfalls.
| Metric | $60/bbl Baseline | $90/bbl Conflict Scenario |
|---|---|---|
| Global upstream FCF | ~$230-240B (estimated) | $495 billion |
| NOC/IOC share (49 companies) | Lower concentration | $272 billion |
| U.S. industry cash flow uplift | Baseline | ~$63.4B additional |
| Shell/BP projected windfall | Baseline | Multi-billion dollar uplift |
Capital Discipline as a Strategic Doctrine, Not a Temporary Reflex
Why Boards Are Choosing Balance Sheets Over Buybacks
The corporate response to the windfall has surprised both optimistic and pessimistic observers. Wood Mackenzie's Tom Ellacott, Senior Vice President of Corporate Research, has noted that the most telling feature of the industry's response is how little has actually changed in capital allocation behaviour. Most major operators have adopted a stance of accumulating cash rather than accelerating either shareholder returns or new investment programs. Capital discipline, it turns out, has proven more resilient than either bullish or bearish analysts expected.
The logic is straightforward once the conflict-driven nature of the price environment is accepted. Management teams are acutely aware that the $89-plus Brent price does not reflect a structural shift in global demand. It reflects a military situation. Committing multi-billion dollar capital programs to production investments that only generate acceptable returns above $70 per barrel, based on a price that exists because of a war, carries a risk profile that no responsible board can easily accept.
The expected outcome across the sector:
- Capital expenditure budgets remain largely flat despite the cash influx
- Share buybacks are projected to decrease by approximately 5% as boards prioritise financial resilience over distributions
- Debt reduction and deleveraging becomes the primary near-term application of excess cash
- M&A activity absorbs a meaningful portion of the surplus, targeting assets that generate long-term value independent of the conflict premium
Fraser McKay, Head of Upstream Analysis at Wood Mackenzie, has articulated the tension at the core of this moment. The current price surge is not rooted in underlying demand expansion, and energy companies understand that clearly. Balance sheets have reached levels of strength not seen in years, reinforcing the institutional instinct to protect that position rather than risk it on capital commitments that may not be viable when the geopolitical premium eventually fades. If crude prices hold through the second half of 2026, the pressure on boards to deploy capital through buybacks, acquisitions, or investment will intensify materially, and how that tension is resolved will shape the industry's strategic direction well into 2027.
M&A as the Preferred Capital Deployment Vehicle
Dealmaking Surges to a Two-Year High
When cash is abundant but capital expenditure budgets are frozen, M&A becomes the logical pressure valve. Upstream deal activity reached its highest level in two years during the first half of 2026, with several landmark transactions reshaping the competitive landscape.
| Acquirer | Target | Deal Value | Strategic Rationale |
|---|---|---|---|
| Shell (NYSE: SHEL) | ARC Resources | $16 billion | Canadian gas supply diversification |
| Devon Energy (NYSE: DVN) | Coterra Energy | $25 billion | Scale in U.S. unconventional basins |
| Mitsubishi | Aethon Energy | $7.5 billion | LNG supply security for Asian markets |
The strategic logic behind each transaction reflects the same underlying concern: acquiring stable, lower-risk production outside the Hormuz corridor. Natural gas and LNG assets are commanding particularly elevated acquisition premiums as buyers across both corporate and sovereign categories recognise that the conflict has permanently elevated the risk-adjusted cost of Hormuz-dependent supply chains.
Low-geopolitical-risk jurisdictions including North America, Canada, and select African producing basins are attracting disproportionate capital interest. This represents a structural reorientation of M&A activity that is unlikely to fully reverse even if diplomatic contacts eventually produce a ceasefire, because the vulnerability of Hormuz-routed supply has now been demonstrated at scale.
The next major ASX story will hit our subscribers first
The Long-Range Production Cliff: A Warning Hidden Inside the Windfall
Why Today's Cash Surplus Does Not Protect Tomorrow's Supply Base
Perhaps the most consequential and least widely discussed implication of the 2026 upstream environment is the growing disconnect between near-term cash generation and long-range supply sustainability. Wood Mackenzie's production modelling across 155 upstream companies reveals a structural decline trajectory that the current capital discipline posture is actively accelerating. The broader geopolitical risk landscape affecting energy and resource sectors suggests that supply-chain vulnerabilities will remain a defining concern well beyond this conflict cycle.
"Wood Mackenzie projects that average production across the 155 upstream companies it monitors will decline by 30% between 2030 and 2040, with more than 70 producers facing output reductions exceeding 50% absent significant new investment commitments."
This creates a compounding strategic dilemma. The same geopolitical uncertainty that argues against spending today is setting the conditions for a supply deficit in the next decade that will be far more structurally embedded than the current conflict-driven disruption. Unlike a chokepoint closure, a decade of underinvestment cannot be reversed by a peace agreement.
| Scenario | Near-Term Outcome | Long-Term Consequence |
|---|---|---|
| Maintain capital discipline | Strong FCF, balance sheet resilience | Accelerated production decline post-2030 |
| Increase reinvestment | Reduced FCF, higher leverage risk | Supply base preservation, future revenue protection |
| Deploy via M&A | Neutral to FCF, asset repositioning | Depends on asset quality and acquisition price |
Supply Chain Diversification and the Downstream Crunch
How the Middle East Oil Shock Is Redrawing Energy Infrastructure Maps
The conflict's consequences extend well beyond crude pricing. Multiple consuming nations have accelerated strategic reviews of their energy supply chain architecture in direct response to the Hormuz disruption. In addition, OPEC market influence has become an increasingly critical variable as member states weigh production decisions against a backdrop of unprecedented geopolitical complexity.
- Japan is backing overseas pipeline infrastructure projects specifically designed to reduce the proportion of crude sourced through Hormuz-dependent shipping lanes
- Australia is actively evaluating domestic refinery capacity development to reduce dependence on imported refined products
- Qatar has redirected LNG procurement toward American suppliers following damage to the Ras Laffan complex
- A U.S.-Saudi consortium has announced a $5 billion refinery project positioned outside the Hormuz corridor to establish a more resilient export pathway
- ADNOC has continued LNG export operations despite the Hormuz risk environment, demonstrating the UAE's strategic infrastructure positioning relative to Iran's closure declaration
Goldman Sachs has identified the diesel market as the single most acute near-term pressure point emerging from the upstream supply disruption. Russia's extension of diesel and gasoline export bans through 2027 has compounded the refined product tightness. The shutdown of Saudi Aramco's 400,000 barrel per day refinery following a Houthi strike removed significant processing capacity from an already strained global refining system. Even record U.S. refinery utilisation rates have proven insufficient to bridge the global refined fuel deficit, a concern oil refiners have begun to openly acknowledge as the duration of the disruption extends beyond initial forecasts.
Scenarios for H2 2026: Three Pathways, Three Sets of Consequences
The Variables That Will Determine Capital Deployment Decisions
The second half of 2026 will resolve several questions that are currently unanswerable. Whether Brent holds above $85 to $90 through year-end, whether U.S.-Iran diplomatic engagement produces a durable reduction in hostilities, whether OPEC+ formally pauses its output increase schedule, and whether consuming nations successfully accelerate supply diversification will collectively determine how much pressure mounts on corporate boards to deploy their accumulated cash.
| Scenario | Crude Price Assumption | Expected Corporate Response |
|---|---|---|
| Conflict de-escalation | Brent falls to $70-75/bbl | Capital discipline maintained; M&A activity slows |
| Sustained elevated prices | Brent holds $85-95/bbl | Buyback pressure intensifies; selective M&A continues |
| Conflict escalation | Brent re-tests $100+/bbl | Emergency supply diversification; strategic reserve drawdowns; accelerated non-Gulf M&A |
What is clear is that the middle east oil shock upstream windfall of 2026 is not simply a financial story. It is simultaneously a test of corporate governance under uncertainty, a stress test for global energy supply chains, and an early warning signal about the long-range production capacity crisis that underinvestment is quietly constructing beneath the surface of today's cash-rich balance sheets.
This article contains forward-looking analysis and scenario projections that involve assumptions and estimates. Commodity prices, geopolitical outcomes, and corporate capital allocation decisions are inherently uncertain. Nothing in this article constitutes financial or investment advice. Readers should conduct their own independent research and consult qualified professional advisers before making investment decisions.
Want to Spot the Next Major Resource Discovery Before the Broader Market Does?
Discovery Alert's proprietary Discovery IQ model delivers real-time alerts on significant ASX mineral discoveries, transforming complex resource data into actionable investment insights for both short-term traders and long-term investors — explore historic examples of major discoveries and their market returns, then begin your 14-day free trial to position yourself ahead of the market.