May 19, 2026

The global energy landscape continues to evolve through complex interdependencies between geopolitical stability and market dynamics. Understanding how regional conflicts affect worldwide crude oil pricing requires examining the sophisticated mechanisms that connect local disruptions to international commodity markets. Furthermore, the escalating tensions between the United States, Israel, and Iran highlight the critical importance of military action against Iran and its potential ramifications for global energy security. This analysis explores the strategic framework underlying these relationships and their implications for energy security across different economic scenarios.
How Do Military Conflicts in Energy-Rich Regions Reshape Global Oil Pricing Dynamics?
Historical Precedent Analysis: From 1973 to Present
Military escalation in energy-producing regions has consistently triggered significant crude oil price volatility over the past five decades. The relationship between geopolitical tension and petroleum markets demonstrates recurring patterns that provide insight into contemporary market behavior during periods of uncertainty.
The foundational precedent emerged during the 1973 Arab-Israeli conflict, when petroleum-exporting nations implemented strategic supply restrictions that quadrupled global crude prices within months. This historical episode established the template whereby military action against Iran and other Middle Eastern producers creates immediate market responses through risk premium incorporation in futures pricing.
| Conflict Period | Price Impact | Duration | Recovery Timeline |
|---|---|---|---|
| 1973 Yom Kippur War | +300% peak increase | 6 months | 18-24 months |
| 1979 Iranian Revolution | +150% sustained elevation | 12 months | 36+ months |
| 1990 Gulf War | +100% temporary spike | 3 months | 6-8 months |
| 2019 Abqaiq Attack | +20% single-session spike | 1 day | 2-3 weeks |
Contemporary market responses operate through fundamentally different mechanisms than historical precedents due to technological advancement in trading infrastructure. The immediate price reaction to the February 2026 military action against Iran demonstrated this evolution, with Brent crude futures climbing to $72.86 per barrel (+2.45%) and WTI reaching $67.02 (+2.78%) during anticipatory trading periods.
Key factors distinguishing modern market responses include:
- Algorithmic trading systems providing instantaneous news incorporation
- 24/7 global futures markets enabling continuous price discovery
- Sophisticated risk modeling incorporating multiple disruption scenarios
- Enhanced satellite monitoring of infrastructure and shipping activity
The distinction between reversible and permanent supply disruptions significantly influences market psychology and pricing duration. Moreover, understanding the OPEC production impact helps analysts predict how organisations will respond to supply shortages. Analysis from the Council on Foreign Relations suggests that certain types of supply interruptions create temporary price elevation, while others generate sustained market structure changes.
Recovery timeline modelling reveals consistent patterns across different conflict types. However, the current oil price stagnation dynamics suggest that temporary infrastructure damage typically generates acute price spikes lasting 2-4 weeks, while sustained political instability can maintain elevated pricing for multiple years. The specialised nature of Middle Eastern petroleum infrastructure means repair timelines often extend far beyond simple equipment replacement, as facilities utilise custom-made components unavailable through standard industrial suppliers.
Real-Time Market Response Mechanisms
Modern crude oil markets operate through sophisticated price discovery mechanisms that incorporate geopolitical information within minutes of major events. The global nature of petroleum trading creates unique dynamics whereby regional conflicts immediately affect international pricing through interconnected futures markets and algorithmic trading systems.
Primary market response channels include:
- Futures Market Volatility: Immediate repricing of contracts extending months into the future
- Algorithmic Amplification: Automated trading systems executing large position changes based on news feeds
- Cross-Regional Arbitrage: Price adjustments across different geographic markets and crude grades
- Options Market Activity: Increased demand for protective instruments reflecting heightened uncertainty
The February 2026 events illustrated these mechanisms in real-time, with market participants predicting opening price increases ranging from $5-12 per barrel, with some projections reaching $90 per barrel for Brent crude. These predictions reflected not only immediate supply concerns but also market assessment of potential escalation scenarios.
"The concentration of trading activity during the first hours following major geopolitical news creates the most dramatic price movements, as automated systems accumulate positions before manual reassessment of underlying fundamentals occurs."
Volatility indices specific to energy markets provide quantitative measures of uncertainty during geopolitical events. In addition, the recent oil price rally review demonstrates how historical analysis suggests moderate geopolitical concerns typically generate volatility spikes 30-50% above baseline levels, while extreme events can produce increases exceeding 100%.
When big ASX news breaks, our subscribers know first
What Strategic Chokepoints Determine Global Energy Security?
Critical Maritime Infrastructure Analysis
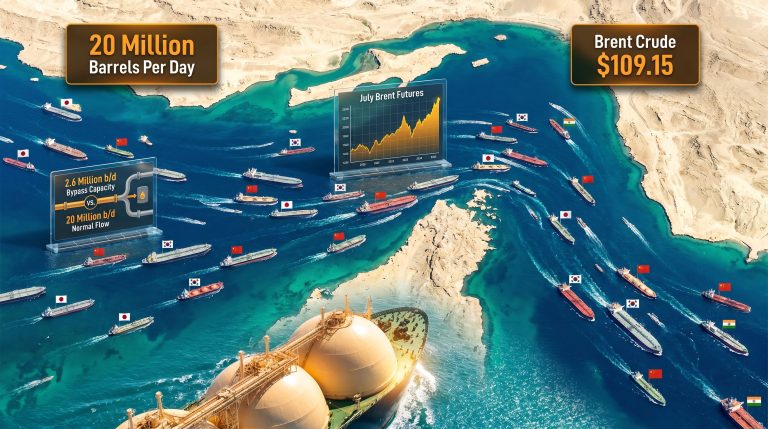
Global petroleum supply depends critically on a small number of geographic passages that concentrate enormous volumes of daily crude oil transport. The most significant of these chokepoints handles approximately 20 million barrels per day, representing roughly one-fifth of total global production.
The Strait of Hormuz represents the most strategically important petroleum chokepoint globally, connecting Persian Gulf producers to international markets through a passage just 21 miles wide at its narrowest point. This waterway facilitates crude exports from Saudi Arabia, the UAE, Kuwait, Iraq, and Iran, making it indispensable for global energy supply chains.
Critical chokepoint characteristics:
- Daily throughput: 20 million barrels
- Geographic constraints: 21-mile minimum width
- Alternative routing: Limited pipeline capacity (4.8 million barrels/day maximum)
- Strategic vulnerability: Single-point-of-failure for multiple major producers
Alternative routing infrastructure remains severely limited compared to maritime transport capacity. The Saudi Pipeline provides partial circumvention capability but cannot accommodate the full volume currently transiting through Hormuz. Other Gulf producers lack comparable alternative infrastructure, creating acute vulnerability to supply disruption.
Iranian geographic position enables multiple disruption mechanisms, including direct military confrontation with shipping, mine deployment, or attacks on navigational infrastructure. The 2019 incidents involving tanker attacks demonstrated how non-state actors can create substantial market disruptions without formal closure of shipping lanes.
Infrastructure vulnerability extends beyond the chokepoint itself to encompass specialised petroleum processing facilities throughout the region. The 2019 attack on Saudi Arabia's Abqaiq facility temporarily removed 5.7 million barrels per day of processing capacity, demonstrating how targeted strikes on individual installations can create market impacts comparable to broader supply disruptions.
Supply Chain Resilience Modelling
Energy security depends not only on individual chokepoint vulnerabilities but also on the broader supply chain's capacity to adapt to disruption scenarios. Resilience modelling examines how quickly alternative supply sources can compensate for lost production and the associated cost premiums for emergency routing.
Disruption scenario categories:
-
Partial Restriction (25-50% capacity reduction)
- Timeline: 2-4 weeks for alternative arrangements
- Cost premium: 15-25% above normal shipping rates
- Market impact: Moderate price elevation with gradual normalisation
-
Severe Restriction (50-75% capacity reduction)
- Timeline: 1-3 months for comprehensive rerouting
- Cost premium: 40-60% above baseline
- Market impact: Significant price spikes requiring strategic reserve deployment
-
Complete Closure (90%+ capacity loss)
- Timeline: 3-6 months for infrastructure workarounds
- Cost premium: 100%+ above normal operations
- Market impact: Crisis-level pricing requiring international coordination
Regional impact distribution varies significantly across major consuming economies based on their import dependencies and strategic reserve capabilities. Consequently, the trade war oil impacts reveal that Asian economies face particular vulnerability due to their reliance on Middle Eastern crude supplies and limited alternative sourcing options.
Strategic petroleum reserve deployment represents the primary short-term response mechanism for severe disruption scenarios. The United States maintains approximately 700 million barrels in strategic reserves, while other major consuming nations hold additional emergency stockpiles totalling several billion barrels globally.
How Do Major Oil Producers Respond to Supply Disruption Scenarios?
OPEC+ Strategic Decision-Making Framework
Major petroleum-producing organisations maintain sophisticated coordination mechanisms for responding to supply disruption scenarios. The recent OPEC+ decision to increase daily output by 206,000 barrels following the February 2026 events demonstrates these response protocols in operation.
The emergency OPEC+ meeting involved eight core members: Saudi Arabia, Russia, the UAE, Kazakhstan, Kuwait, Iraq, Algeria, and Oman. This streamlined decision-making structure enables rapid response to market disruptions without requiring consensus from the full membership of 23+ countries.
OPEC+ production response mechanisms:
- Immediate capacity deployment: 206,000 barrel/day increase authorised within 48 hours
- Strategic coordination: Pre-positioning of increased Saudi output (500,000 barrel/day preparation)
- Spare capacity utilisation: Primary reliance on Saudi Arabia and UAE excess capacity
- Market timing: Production announcements coordinated with futures market openings
Saudi Arabia's preparation activities suggest sophisticated anticipation of geopolitical events, with reports indicating production increases beginning weeks before the actual military action against Iran. This preparation reflects the Kingdom's central role in global market stabilisation and its capacity to rapidly deploy additional output when supply disruptions occur.
The UAE represents the second-largest source of immediate spare capacity within OPEC+, capable of adding approximately 1-1.5 million barrels per day to global markets if supply shortages materialise for extended periods. This combined Saudi-UAE spare capacity provides the primary mechanism for offsetting moderate supply disruptions from geopolitical events.
Non-OPEC Producer Response Patterns
Petroleum producers outside the OPEC+ coordination framework maintain different response mechanisms based on their technological capabilities and market positioning. Furthermore, the US oil production decline demonstrates how United States shale production provides particular flexibility due to its rapid deployment characteristics and distributed production base.
U.S. shale production advantages:
- Rapid deployment: 3-6 month timeline from drilling decision to production
- Distributed infrastructure: Thousands of individual wells reducing single-point vulnerabilities
- Market responsiveness: Production economics enabling quick response to price signals
- Technology integration: Advanced drilling techniques maximising output per well
Strategic petroleum reserve releases represent another critical non-OPEC response mechanism. The United States has demonstrated willingness to deploy reserves during supply disruptions, with release rates capable of offsetting 1-4 million barrels per day for periods of several months.
Alternative supplier activation protocols vary significantly across different producing regions. Canadian oil sands production provides stable long-term supply but limited surge capacity, while Brazilian offshore production offers moderate flexibility within existing infrastructure constraints.
What Economic Sectors Face Greatest Vulnerability During Energy Price Volatility?
Transportation and Logistics Impact Assessment
Energy price volatility creates cascading effects throughout the global economy, with transportation and logistics sectors experiencing the most immediate and severe impacts. Fuel cost fluctuations directly affect operating expenses for airlines, shipping companies, trucking operations, and consumer transportation.
Gasoline price transmission mechanisms operate through established patterns whereby crude oil price increases translate to retail fuel prices within 2-4 weeks. Analysis suggests that current market conditions could drive average U.S. gasoline prices above $3.00 per gallon from the existing $2.98 baseline, with regional variations depending on refinery capacity and distribution infrastructure.
Sector-specific vulnerability analysis:
| Industry Sector | Fuel Cost % of Operations | Price Pass-Through Timeline | Consumer Impact |
|---|---|---|---|
| Commercial Airlines | 25-35% | 1-3 months | Higher ticket prices |
| Long-haul Trucking | 30-40% | 2-6 weeks | Shipping cost increases |
| Ocean Freight | 40-50% | 1-2 months | International trade costs |
| Consumer Vehicles | Variable | Immediate | Reduced discretionary spending |
Consumer behaviour adaptation to gasoline price increases follows predictable patterns based on historical precedent. Price increases of 20-30% typically generate moderate demand destruction, with consumers reducing discretionary travel and optimising trip efficiency. More substantial price increases above 50% create significant behavioural changes including public transportation adoption and vehicle purchasing decisions favouring fuel efficiency.
Supply chain disruption effects extend beyond direct fuel costs to encompass scheduling reliability and route optimisation challenges. However, logistics companies maintain contingency planning for energy price volatility, but extreme scenarios can overwhelm these preparations and require fundamental operational adjustments.
Industrial Energy Consumption Analysis
Manufacturing sectors demonstrate varying sensitivity to petroleum price fluctuations based on their energy intensity and ability to pass costs through to consumers. Chemical and petrochemical industries face particular vulnerability due to their dual exposure through both energy costs and feedstock pricing.
Energy-intensive industry exposure levels:
- Petrochemicals: 60-70% of production costs tied to petroleum pricing
- Steel Production: 25-35% energy cost component
- Aluminium Smelting: 30-40% electricity and fuel dependency
- Cement Manufacturing: 20-30% energy cost sensitivity
Regional competitive advantage shifts during energy price spikes create complex dynamics in global manufacturing. Regions with lower energy costs or greater energy security gain temporary competitive advantages, while energy-dependent manufacturing centres experience margin compression and potential production curtailment.
Energy hedging strategies employed by industrial consumers provide some protection against short-term volatility but remain limited for extreme price scenarios or sustained elevation periods. Most corporate hedging programmes cover 6-18 months of exposure, leaving companies vulnerable to longer-duration geopolitical disruptions.
How Do Asian Economic Powers Navigate Middle Eastern Energy Dependencies?
China's Energy Security Strategic Framework
China's substantial reliance on Middle Eastern petroleum creates unique vulnerabilities during regional conflicts and supply disruptions. The country imported approximately 1.4 million barrels per day of Iranian crude during 2025, representing more than 80% of Iran's ocean-borne exports and approximately 13% of China's total crude imports.
The concentration of Chinese petroleum procurement through Middle Eastern suppliers creates strategic dependencies that extend beyond simple economic considerations. Roughly one-third of China's total oil imports transit through the Strait of Hormuz, making any disruption to this chokepoint a significant concern for Chinese energy security planners.
China's diversification initiatives:
- Belt and Road Infrastructure: Pipeline projects reducing maritime dependency
- Alternative Supplier Development: Increased procurement from Russia, West Africa, and South America
- Strategic Reserve Expansion: Domestic stockpiling for supply security
- Technology Investment: Renewable energy deployment reducing petroleum dependency
Supply disruption scenarios force China to compete in global markets for alternative crude sources, potentially driving prices higher as Chinese buyers bid for substitute supplies. This dynamic creates a feedback loop whereby regional Middle Eastern conflicts affect global pricing even if physical Chinese supply access remains unimpaired.
Chinese energy diplomacy operates through multiple channels designed to maintain supply access during geopolitical uncertainty. These include bilateral agreements with producing nations, participation in international energy frameworks, and strategic investments in global petroleum infrastructure.
Regional Energy Partnership Evolution
Asian economic powers have developed increasingly sophisticated coordination mechanisms for managing energy security challenges. These partnerships encompass both bilateral agreements and multilateral frameworks designed to enhance collective resilience during supply disruptions.
Key Asian energy security initiatives:
- Japan-Korea Cooperation: Joint strategic reserve management and LNG procurement coordination
- ASEAN+3 Framework: Regional energy emergency response protocols
- India-Japan Partnership: Alternative energy development and supply chain diversification
- China-Russia Energy Corridor: Pipeline infrastructure reducing Middle Eastern dependency
India faces similar challenges to China regarding Middle Eastern supply dependency, though with different strategic responses. Indian energy policy emphasises domestic production enhancement, renewable energy deployment, and procurement diversification across multiple regions.
Japan and South Korea demonstrate advanced supply chain risk mitigation approaches through their extensive LNG import infrastructure and strategic petroleum reserve systems. Both countries maintain emergency response protocols enabling rapid deployment of alternative energy sources during supply disruptions.
What Long-Term Market Structural Changes Emerge from Geopolitical Disruptions?
Investment Flow Redirection Patterns
Sustained geopolitical uncertainty in energy-producing regions creates fundamental shifts in global investment patterns, affecting both traditional petroleum infrastructure and alternative energy development. These investment redirections often persist long after immediate supply disruptions resolve.
Primary investment pattern changes:
- Infrastructure Hardening: Enhanced security and redundancy in critical petroleum facilities
- Alternative Route Development: Pipeline and shipping infrastructure bypassing vulnerable chokepoints
- Technology Acceleration: Advanced monitoring and automation systems for rapid disruption response
- Renewable Energy Prioritisation: Accelerated deployment reducing fossil fuel dependencies
Capital allocation shifts toward energy security enhancement often involve substantial public and private investment in previously uneconomical projects. Geographic diversification of energy infrastructure becomes prioritised over pure cost optimisation, creating new opportunities in previously overlooked regions.
Research and development investment increases significantly during periods of energy security concern, particularly in areas related to supply chain resilience and alternative energy technologies. These investment increases typically generate innovation acceleration that persists beyond the immediate geopolitical trigger events.
Regulatory and Policy Response Evolution
Government responses to energy security challenges create lasting changes in regulatory frameworks and international cooperation mechanisms. These policy adaptations often establish new institutional structures that reshape global energy markets for decades.
Policy response categories:
- Strategic Reserve Enhancement: Increased government stockpiling requirements and capacity expansion
- Supply Chain Diversification Mandates: Regulatory requirements for supplier geographic distribution
- Critical Infrastructure Protection: Enhanced security standards for energy facilities
- International Cooperation Frameworks: Multilateral agreements for emergency response coordination
Emergency response protocol standardisation emerges as governments recognise the need for coordinated responses to supply disruptions. These protocols establish predetermined mechanisms for strategic reserve deployment, alternative supplier activation, and demand management during crisis periods.
Regulatory frameworks increasingly incorporate geopolitical risk assessment into energy planning processes. This integration requires energy companies and utilities to demonstrate supply chain resilience and maintain contingency planning for various disruption scenarios.
The next major ASX story will hit our subscribers first
How Can Investors and Businesses Prepare for Energy Market Volatility?
Risk Management Strategy Development
Energy market volatility creates both substantial risks and opportunities for investors and businesses across multiple sectors. Effective preparation requires comprehensive risk assessment and strategic positioning for various potential scenarios.
Core risk management approaches:
- Portfolio Diversification: Exposure across multiple energy sectors and geographic regions
- Hedging Instruments: Futures contracts and options for price protection
- Supply Chain Analysis: Assessment of energy cost exposure across business operations
- Scenario Planning: Stress testing for various geopolitical and supply disruption scenarios
Hedging instrument utilisation for energy price exposure varies significantly across different business models and risk tolerance levels. Airlines typically maintain extensive fuel hedging programmes, while smaller businesses may rely on simpler price stabilisation mechanisms or supply contracts with embedded price protection.
Hedging strategy comparison:
| Hedging Method | Cost | Protection Level | Complexity | Optimal Users |
|---|---|---|---|---|
| Fixed-price contracts | Low | Moderate | Simple | Small businesses |
| Futures contracts | Moderate | High | Medium | Mid-size companies |
| Options strategies | High | Customisable | Complex | Large corporations |
| Collar strategies | Medium | Partial | Medium | Risk-balanced entities |
Business continuity planning for energy supply disruptions requires identification of critical operations and development of alternative arrangements. These preparations may include backup fuel supplies, alternative transportation arrangements, or operational modifications reducing energy intensity.
Opportunity Identification Framework
Geopolitical energy market disruptions create substantial opportunities for investors and businesses positioned to benefit from supply chain reorganisation and infrastructure development needs. These opportunities often emerge across multiple timeframes and sectors.
Near-term opportunity categories:
- Energy Storage Companies: Increased demand for grid stabilisation and supply security
- Alternative Transportation: Electric vehicle and public transit infrastructure development
- Energy Efficiency Technology: Solutions reducing petroleum dependency for businesses and consumers
- Regional Energy Infrastructure: Pipeline and processing facilities in stable political regions
Technology companies specialising in energy security solutions experience increased demand during geopolitical uncertainty periods. These solutions encompass monitoring systems, predictive analytics for supply chain management, and automation technologies reducing operational vulnerability to supply disruptions.
Long-term structural opportunities:
- Renewable Energy Infrastructure: Solar, wind, and battery storage projects
- Critical Mineral Mining: Lithium, cobalt, and rare earth elements for energy transition
- Energy Efficiency Services: Building retrofits and industrial process optimisation
- Smart Grid Technology: Enhanced electrical distribution and management systems
Investment in energy transition acceleration often receives policy support during geopolitical uncertainty periods, as governments prioritise energy independence and supply chain resilience. This policy support can include tax incentives, regulatory streamlining, and direct government investment in strategic projects.
What Indicators Signal Market Stabilisation Following Geopolitical Events?
Recovery Timeline Modelling
Market stabilisation following geopolitical disruptions operates through predictable phases that provide investors and businesses with frameworks for anticipating price normalisation and supply chain restoration. Understanding these patterns enables more effective strategic planning during uncertainty periods.
Stabilisation phase progression:
- Immediate Shock (Days 1-7): Peak volatility and maximum price elevation
- Information Gathering (Weeks 1-4): Market assessment of actual supply impact
- Alternative Arrangement (Months 1-3): Substitute supply source establishment
- New Equilibrium (Months 3-12): Price settlement at adjusted baseline reflecting changed conditions
Key metrics indicating supply chain restoration include shipping volume recovery through affected routes, inventory level normalisation at major petroleum terminals, and futures curve adjustment reflecting reduced long-term supply concerns. These metrics provide quantitative measures of market confidence restoration.
Historical pattern analysis reveals that price normalisation timelines depend critically on whether market participants expect permanent or temporary changes to supply infrastructure. Temporary disruptions typically generate price recovery within 4-8 weeks, while permanent changes create new pricing baselines that may persist for years.
Market Confidence Restoration Factors
Confidence restoration in energy markets requires resolution of multiple uncertainty factors affecting long-term supply availability. These factors encompass political stability indicators, infrastructure integrity assessment, and international diplomatic progress toward conflict resolution.
Primary confidence indicators:
- Shipping Volume Recovery: Return of tanker traffic through previously disrupted routes
- Inventory Rebuilding: Strategic and commercial petroleum stockpile restoration
- Futures Curve Normalisation: Reduction of long-term contract risk premiums
- Alternative Supply Verification: Confirmation of substitute producer capacity utilisation
International diplomatic intervention effectiveness plays a crucial role in market confidence restoration, particularly when diplomatic efforts address underlying political conflicts rather than merely managing immediate supply disruptions. For instance, the latest developments regarding military action against Iran demonstrate how sustained diplomatic progress typically generates more durable price stabilisation than temporary cease-fire arrangements.
Technology monitoring systems increasingly provide real-time verification of infrastructure integrity and operational status, enabling markets to assess supply restoration progress with greater precision than historical precedents allowed. Satellite imagery, shipping tracking, and automated facility monitoring contribute to more accurate market assessment of actual supply conditions.
"Market participants increasingly rely on multiple independent verification sources for supply disruption assessment, reducing the market impact of unverified reports or speculation during geopolitical uncertainty periods."
Consumer and business adaptation completion signals provide additional indicators of market stabilisation. These signals include normalisation of transportation patterns, business inventory level restoration, and reduced consumer concern regarding fuel availability and pricing.
Disclaimer: This analysis incorporates market predictions and scenario modelling that involve inherent uncertainty. Energy market behaviour during geopolitical events can vary significantly from historical patterns due to changing technology, infrastructure, and international relationships. Readers should consult qualified financial advisors before making investment decisions based on geopolitical energy market analysis. The scenarios presented represent analytical frameworks rather than predictive certainties.
Ready to Capitalise on Geopolitical Energy Market Opportunities?
Given the complex interplay between geopolitical tensions and energy market volatility, Discovery Alert's proprietary Discovery IQ model provides instant notifications on significant ASX mineral discoveries, helping investors identify actionable opportunities in the energy and resources sectors before broader market movements occur. Explore Discovery Alert's dedicated discoveries page to see how major mineral discoveries have generated substantial returns throughout history, then begin your 14-day free trial today to position yourself ahead of market-moving announcements.