June 21, 2026
The Hidden Architecture of a Global Energy Crisis
Few infrastructure chokepoints in the modern world carry the systemic weight of a single maritime corridor. The global oil trading system was built over decades on the assumption that certain passages remain open, that tanker schedules are predictable, and that physical supply will reliably meet refinery demand. When those assumptions break down, the consequences do not stay contained within energy markets. They migrate into inflation data, central bank deliberations, airline balance sheets, and the retirement portfolios of ordinary investors. The Strait of Hormuz blockade oil supply risks represent precisely that kind of systemic rupture.
When big ASX news breaks, our subscribers know first
How Much Oil Actually Flows Through the Strait of Hormuz?
The 20 Million Barrel Per Day Reality: Understanding the Scale of Exposure
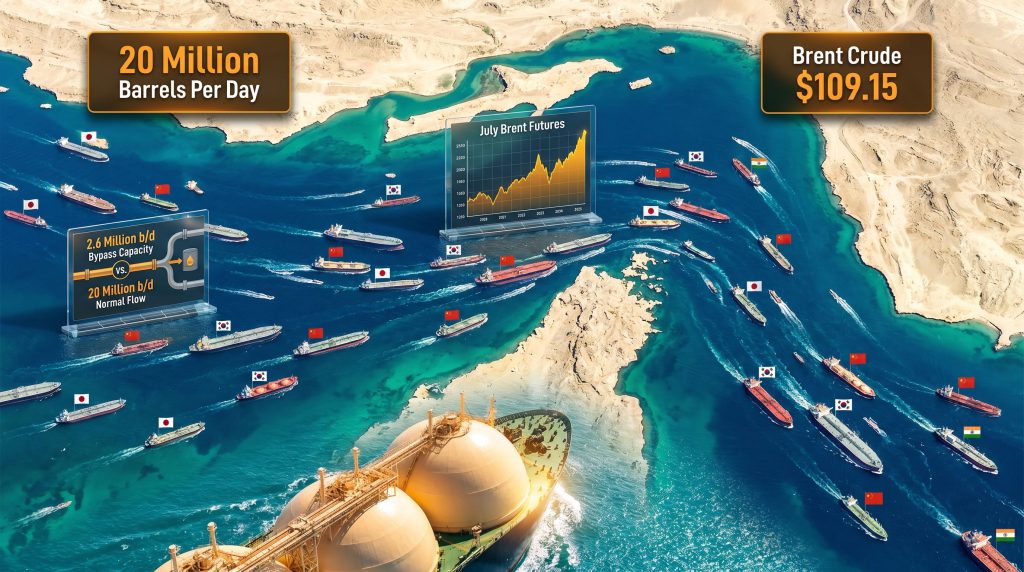
Understanding why the current disruption carries such outsized consequences requires grasping the sheer volume of energy that passes through a waterway only 21 kilometres wide at its narrowest navigable point. According to the U.S. Energy Information Administration, approximately 20 million barrels per day transited the Strait of Hormuz in 2024, representing roughly one-fifth of total global petroleum liquids consumption. No other single maritime passage comes close to matching that share of world energy supply.
The strait is not just a crude oil conduit. Furthermore, the full range of commodities transiting the passage includes:
- Liquefied natural gas exports from Qatar, which relies almost entirely on Hormuz access to reach global LNG buyers
- Refined petroleum products destined for Asia-Pacific and European markets
- Condensate and petrochemical feedstocks sourced from Gulf producers
- Crude grades including Arab Light, Arab Heavy, and Iranian Heavy, which serve as pricing benchmarks across Asian refinery systems
Which Countries Are Most Exposed to a Strait of Hormuz Disruption?
The geographic concentration of exposure is striking. Import-dependent economies in Asia face the most acute vulnerability, while domestic production buffers reduce but do not eliminate risk for the United States.
| Country/Region | Estimated Dependency on Hormuz Flows | Primary Risk |
|---|---|---|
| Japan | High | ~85% of crude imports transit the strait |
| South Korea | High | Major LNG and crude exposure |
| China | Moderate-High | Largest global oil importer |
| India | Moderate | Significant Gulf crude reliance |
| Europe | Moderate | LNG and refined product exposure |
| United States | Low-Moderate | Domestic production buffers exposure |
One dynamic that receives insufficient attention in mainstream coverage is the compound vulnerability of LNG markets. Qatar, the world's largest LNG exporter, depends almost entirely on Hormuz access for its exports. A sustained blockade therefore creates a dual energy shock: simultaneously tightening crude oil markets and removing a critical source of LNG supply that European buyers have been increasingly relying upon. The European gas price pressures this creates compound in ways that simple crude price models fail to capture.
What Triggered the 2026 Strait of Hormuz Blockade?
The Geopolitical Sequence That Brought Global Oil Markets to Crisis Point
The disruption did not materialise suddenly. A sequence of diplomatic deteriorations and military posturing across 2025 and 2026 progressively dismantled the diplomatic architecture that had previously kept commercial shipping protected. The April 8, 2026 ceasefire between Iran and its regional adversaries collapsed without producing an enforceable framework, removing the primary diplomatic buffer that shipping operators had been relying upon when pricing freight contracts.
Key developments that contributed to sustained disruption:
- Ceasefire collapse eliminated the diplomatic backstop that had been suppressing war-risk insurance premiums
- Shipping operators began embedding elevated risk premiums into freight contracts, raising the delivered cost of every barrel regardless of whether individual cargoes transited successfully
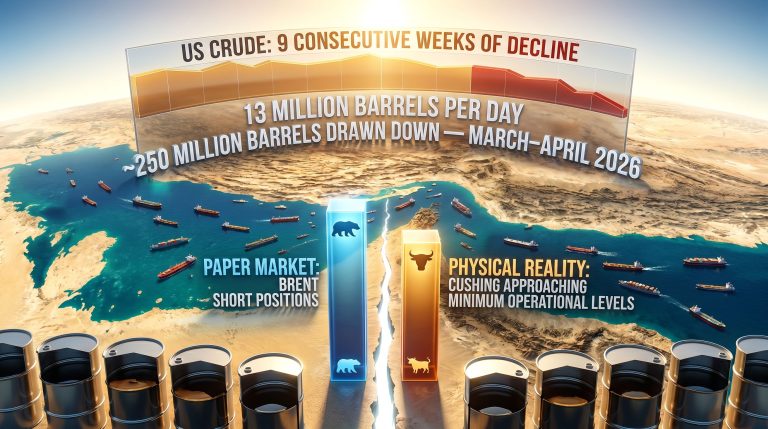
- Refiners and importers began drawing down strategic inventories as a substitute for disrupted daily supply flows
US-Iran Diplomatic Failures and Their Market Consequences
High-level diplomatic engagement, including direct discussions between US President Donald Trump and Chinese President Xi Jinping, failed to produce a binding framework capable of restoring regional shipping stability. The trade war impact on oil markets compounded these pressures, as the absence of a credible resolution pathway kept tanker operators on elevated alert and sustained upward pressure on crude benchmarks.
President Trump's public statement that military action against Iran could occur on a short-notice basis introduced a binary risk premium into energy markets that is structurally resistant to conventional hedging instruments. When a head of state signals that escalation timelines are essentially unpredictable, futures curve positioning becomes an exercise in scenario weighting rather than informed probability assessment.
This matters for portfolio construction beyond the energy sector. Binary geopolitical risk of this type is extremely difficult to hedge using standard instruments. Options on crude futures become expensive rapidly, and short-term positions around individual news events carry severe vulnerability to instantaneous headline reversals.
How Does a Strait of Hormuz Blockade Actually Affect Global Oil Prices?
From Physical Disruption to Price Discovery: The Transmission Mechanism
The relationship between physical supply disruption and observed oil prices operates across at least four distinct channels, and understanding each separately is essential for assessing the durability of elevated price levels.
- Physical supply reduction: Tanker volumes fall below levels needed to meet daily refinery intake requirements, creating an immediate feedstock deficit
- Insurance and freight cost escalation: War-risk premiums raise the all-in delivered cost of every barrel, even those successfully transiting the strait
- Inventory drawdown acceleration: Importers draw down existing reserves faster than replenishment can occur, depleting the buffer available for future disruptions
- Speculative risk premium: Futures markets price in probabilistic escalation scenarios, adding a forward-looking component to spot prices that may exceed the immediate physical deficit
Brent Crude at $109: What the Price Level Signals About Market Expectations
When US President Donald Trump delayed a planned military strike on Iran on May 18, 2026, following appeals from regional Gulf leaders, July Brent crude futures fell more than 2% to $109.15 per barrel, while West Texas Intermediate declined to $107.28. The equity relief was also visible: Australia's S&P/ASX 200 rose 1% to 8,594 as immediate war-risk expectations eased.
The critical analytical insight here is what the price did not do. Despite the strike delay reducing the immediate escalation premium, Brent remained firmly above $109. Monitoring crude oil price trends makes it clear that markets are not simply pricing short-term geopolitical fear — they are pricing sustained physical supply tightness that exists independently of whether a military strike occurs. The strike delay removes one upside risk, but it does not restore tanker volumes or replenish depleted inventories.
Historical Precedents: How Previous Hormuz Threats Moved Oil Markets
Context from prior disruption events helps calibrate expectations for both price magnitude and duration. According to expert analysis from CNBC, a full Hormuz closure could produce price scenarios significantly more severe than those observed in prior partial disruptions.
| Event | Peak Price Impact | Duration of Elevated Prices |
|---|---|---|
| 1980 Iran-Iraq War (tanker war phase) | ~+150% over multi-year period | Multi-year |
| 1990 Gulf War | ~+100% spike before reversal | Months |
| 2019 Gulf of Oman tanker attacks | ~+4% immediate spike | Days to weeks |
| 2024 Bab al-Mandeb disruptions | Rerouting costs elevated | Months |
| 2026 Hormuz Blockade (current) | Brent above $109 | Ongoing |
A notable pattern across these precedents is the distinction between shock events (brief price spikes that normalise quickly) and sustained physical restriction (multi-month or multi-year price elevation). The current situation exhibits characteristics more consistent with the latter category: ongoing physical supply shortfall, depleting inventories, and no binding diplomatic resolution in sight.
What Are the Realistic Bypass Alternatives if the Strait of Hormuz Is Closed?
The EIA's Assessment of Emergency Pipeline Bypass Capacity
According to the U.S. Energy Information Administration, approximately 2.6 million barrels per day of bypass pipeline capacity exists across Saudi Arabian and UAE infrastructure. That figure represents roughly 13% of normal Hormuz throughput, highlighting the structural impossibility of substituting pipeline routes for maritime flows at scale.
Saudi Arabia and UAE Pipeline Infrastructure: Capacity and Limitations
The two primary bypass routes each carry meaningful capacity in isolation but remain wholly inadequate relative to normal strait volumes. In addition, operational constraints further reduce the practical ceiling below even nameplate figures:
- Saudi Arabia's East-West Pipeline (Petroline): Connects Eastern Province oil fields to the Red Sea port of Yanbu, with a nameplate capacity of approximately 5 million barrels per day, though operational throughput runs consistently below that ceiling
- UAE's Abu Dhabi Crude Oil Pipeline (ADCOP): Connects the Habshan processing facility to the Fujairah terminal on the Gulf of Oman coast, completely bypassing the strait with a capacity of approximately 1.5 million barrels per day
- Combined practical bypass ceiling: Approximately 2.6 million barrels per day under optimal simultaneous operation
The arithmetic is unambiguous: even if every available bypass pipeline operated simultaneously at maximum capacity, approximately 17.4 million barrels per day of normal Hormuz throughput would remain undeliverable through alternative routes. This is not a rerouting problem. It is a structural supply deficit problem that no combination of existing bypass infrastructure can solve in the near term.
An additional complexity rarely discussed is the product specification mismatch that can arise during bypass operations. Saudi pipelines primarily carry Arab Light crude, and sudden volume surges through Yanbu can strain the port's loading infrastructure and create bottlenecks in crude blending for refineries expecting specific grade specifications. Asian refineries configured for heavier Gulf grades face particular challenges when lighter bypass crude is substituted at scale.
What Happens to Global Fuel Supply Chains During a Prolonged Hormuz Disruption?
Inventory Drawdown Dynamics: How Quickly Do Strategic Reserves Get Depleted?
The immediate market response to physical supply disruption is inventory drawdown, and this process creates a deceptive stability in the short term that can mask the severity of the underlying problem. When refiners and national oil companies draw down existing petroleum stocks:
- The visible physical shortage is temporarily suppressed, delaying the price signal that would otherwise trigger demand reduction
- The buffer available to absorb any secondary disruption event diminishes progressively
- A supply cliff emerges when inventories reach critically low operational minimums, at which point shortages become acute and rapid
The Jet Fuel Crisis Scenario: Aviation Sector Vulnerability
One of the most acute downstream consequences of prolonged Strait of Hormuz blockade oil supply risks involves the jet fuel supply chain. Aviation fuel markets are particularly exposed because jet fuel cannot be easily substituted and airlines operating on thin competitive margins have limited capacity to absorb sustained input cost increases.
Ryanair's Chief Financial Officer warned publicly that a prolonged jet fuel supply crunch could push financially weaker European carriers toward insolvency — a warning that highlights how energy disruptions upstream can trigger corporate failures in sectors that appear distant from geopolitical risk.
The aviation sector's vulnerability is structurally underappreciated in standard energy disruption analysis. Most models focus on crude price levels, but the real transmission mechanism for airlines is physical jet fuel availability and the cost of hedging programmes. When hedging coverage expires during a sustained disruption, carriers face full spot price exposure at precisely the moment those prices are highest.
European Fuel Shortage Timeline: What the Scenarios Suggest
Commodity strategists have outlined a range of scenarios depending on how the disruption evolves from current conditions.
| Scenario | Timeframe | Estimated Inventory Impact |
|---|---|---|
| Partial disruption (current) | Ongoing | Gradual drawdown; shortages possible within weeks |
| Full blockade (escalation) | 2–4 weeks | Acute regional fuel shortages in Europe |
| Sustained disruption (no resolution) | Through 2027 | Global petroleum inventories remain below normal |
| Diplomatic resolution | Weeks after agreement | Gradual normalisation; inventory rebuild takes months |
The next major ASX story will hit our subscribers first
How Does a Strait of Hormuz Disruption Drive Inflation and Delay Interest Rate Cuts?
The Energy-Inflation Transmission: From Oil Prices to Consumer Price Indices
Sustained crude oil prices above $100 per barrel do not create inflation through a single mechanism. The transmission operates across layered economic channels that compound over time:
- Direct fuel costs: Petrol, diesel, and jet fuel prices rise at the pump, immediately visible to consumers and businesses alike
- Embedded energy costs: Manufacturing, agriculture, freight, and logistics sectors all face higher input costs that feed through to final goods pricing with a lag
- Second-round effects: Sustained energy inflation can become embedded in wage expectations and broader price-setting behaviour if market participants believe the disruption is durable
Bond Market Signals: What the 10-Year Treasury Yield Surge Means
Bond markets registered the inflationary implications of sustained Hormuz disruption rapidly and forcefully. Fears that elevated energy prices could delay or reverse central bank rate-cutting cycles triggered a global bond sell-off that pushed the 10-year US Treasury yield to a one-year high and Japan's 30-year government bond yield to a record level.
When long-duration bond yields rise in parallel with crude oil prices, markets are communicating a specific message: the inflationary consequences of the supply disruption are expected to be persistent. Short-duration bond markets price near-term policy expectations, but long-duration moves of this magnitude reflect a genuine reassessment of the medium-term inflation trajectory.
Reserve Bank of Australia Rate Decision: The Hormuz-Inflation Connection
The RBA rate decision serves as a particularly instructive case study in how energy geopolitics transmits directly into domestic monetary policy expectations. Swap market pricing as of May 2026 implies a 21% probability that the Reserve Bank of Australia will raise its cash rate at its June 2026 meeting — a direct consequence of energy-driven inflation expectations being revised upward. For Australian mortgage holders who anticipated relief from rate cuts, this dynamic represents a tangible household financial consequence of events unfolding 10,000 kilometres away.
Central Bank Dilemma: Inflation vs. Growth in a Supply-Shock Environment
The energy supply shock places central banks in a structurally difficult position: standard monetary policy tools are designed to manage demand-side inflation, but supply-shock inflation cannot be resolved by raising interest rates. Rate hikes suppress demand but do not restore oil supply. The result is a policy environment where central banks must choose between accepting above-target inflation or accepting economic contraction.
| Central Bank | Pre-Disruption Expectation | Post-Disruption Revision | Key Risk |
|---|---|---|---|
| US Federal Reserve | Rate cuts anticipated | Timeline pushed out | Stagflation risk |
| European Central Bank | Easing cycle underway | Pace likely to slow | Energy-driven CPI persistence |
| Reserve Bank of Australia | Cut expected June 2026 | 21% probability of hike | Household mortgage stress |
| Bank of Japan | Normalisation path | Yield curve control tested | Record 30-year JGB yields |
Which Sectors and Asset Classes Are Most Vulnerable to Sustained High Oil Prices?
Transportation and Aviation: The Highest-Risk Sector Exposure
Fuel-intensive industries operating in competitive markets with limited pricing power face the greatest earnings compression from sustained oil above $100 per barrel:
- Airlines: Jet fuel represents between 20% and 30% of total operating costs for most carriers; existing hedging programmes provide partial but time-limited protection that erodes progressively during a sustained disruption
- Road freight and logistics: Diesel cost increases compress margins for operators locked into fixed-price contracts that cannot be renegotiated rapidly
- Maritime shipping: Bunker fuel costs rise, increasing the input cost for essentially all seaborne trade globally
Defensive Sector Rotation: Where Capital Has Been Moving
Capital rotation patterns following the strike delay announcement were consistent with behaviour observed during previous geopolitical energy disruptions. Australian energy stocks rose approximately 0.6% while gold mining equities gained approximately 0.9%, reflecting simultaneous commodity exposure and safe-haven demand. Holding gold as a safe haven has consequently attracted significant institutional interest as investors balance reduced immediate war-risk against persistent supply disruption concerns.
Portfolio Stress-Testing Framework: Assessing Energy Cost Exposure
Investors should apply a structured diagnostic framework to holdings across all sectors, not merely the energy sector directly:
- What percentage of a company's total operating cost base is attributable to energy inputs, both direct and embedded?
- Does the company have contractual mechanisms enabling energy cost pass-through to customers, and over what timeframe do those mechanisms operate?
- What is the duration and coverage of any existing fuel hedging programmes, and when does that coverage expire?
- How directly is the company's supply chain exposed to Persian Gulf sourcing or Hormuz transit routes?
- Does the company hold sufficient liquidity to absorb a sustained 6 to 12-month period of elevated energy input costs without triggering covenant breaches or requiring emergency capital raising?
What Would It Take to Resolve the Strait of Hormuz Crisis?
The Three Resolution Pathways and Their Probability Assessment
Pathway 1: Diplomatic Agreement
A binding agreement between the United States and Iran, potentially facilitated by Gulf state intermediaries, that removes the immediate threat of military escalation and restores commercial shipping confidence. This pathway requires sustained diplomatic engagement that has so far not materialised, and the failure of both the April ceasefire and the Trump-Xi discussions suggests the barriers to a durable agreement are high.
Pathway 2: Military Resolution
A decisive military action that either eliminates the blockade capability or creates sufficient deterrence to compel Iran to restore shipping access. This pathway carries significant escalation risk and could produce a substantial short-term oil price spike before any eventual supply normalisation, creating severe near-term volatility even if the medium-term resolution is constructive. The impact on energy security under this scenario would be far-reaching and enduring.
Pathway 3: Gradual Erosion of Blockade Effectiveness
Commercial shipping operators gradually resume transit as war-risk insurance markets find a new equilibrium, individual cargo movements incrementally resume (as evidenced by the Iraqi cargo bound for Vietnam that transited during the current disruption), and the economic cost to Iran of maintaining the blockade becomes unsustainable. Furthermore, OPEC's influence on oil markets during this period could play a critical role in managing supply gaps and price expectations through coordinated production adjustments.
What Invalidates the Supply Shortage Thesis
The prolonged supply shortage outlook would be materially undermined by any of the following developments:
- A verified and sustained return of commercial tanker volumes through the strait to near-normal operational levels
- A binding US-Iran agreement that credibly removes the near-term military escalation risk and provides enforceable shipping access guarantees
- A coordinated and sufficiently large release of strategic petroleum reserves by IEA member nations capable of offsetting the daily supply deficit for an extended period
- A significant demand-side shock, such as a global recession, that reduces petroleum consumption faster than supply continues to be disrupted
Key Takeaways: Strait of Hormuz Blockade Risk Assessment Summary
| Risk Dimension | Current Assessment | Key Indicator to Watch |
|---|---|---|
| Physical supply disruption | Active; tanker volumes below normal | Weekly EIA/IEA inventory data |
| Oil price level | Brent above $109; elevated | Futures curve structure |
| Inflation persistence risk | Elevated; bond markets signalling concern | 10-year Treasury yield trajectory |
| Rate cut delay probability | Meaningful; RBA 21% hike probability | Central bank forward guidance |
| Aviation sector stress | High; jet fuel supply under pressure | Airline hedging disclosures |
| Diplomatic resolution timeline | Uncertain; no binding framework | US-Iran negotiation progress |
| Military escalation risk | Unresolved; short-notice warning active | US military positioning signals |
Important Disclaimer: This article contains analysis, forecasts, and scenario projections relating to geopolitical events and energy markets. Nothing in this article constitutes financial, investment, or trading advice. Past price behaviour during geopolitical disruptions does not guarantee comparable outcomes in the current situation. Investors should conduct their own due diligence and consult qualified financial advisers before making investment decisions. All figures and data referenced are sourced from publicly available information including the U.S. Energy Information Administration.
Further Reading: The U.S. Energy Information Administration's analysis titled Amid regional conflict, the Strait of Hormuz remains critical oil chokepoint provides detailed infrastructure and flow data relevant to understanding the physical constraints discussed in this article. Available at eia.gov.
Want to Identify the Next Big ASX Opportunity Before the Market Catches On?
While geopolitical disruptions reshape energy markets and commodity prices, Discovery Alert's proprietary Discovery IQ model delivers real-time alerts on significant ASX mineral discoveries — instantly translating complex data across 30+ commodities into clear, actionable insights for both traders and long-term investors. Explore how historic mineral discoveries have generated substantial returns, and begin your 14-day free trial today to position yourself ahead of the market.