
July 14, 2026
The Hidden Weight of Modern Life: What 3.01 Million Pounds Tells Us About America's Mineral Future
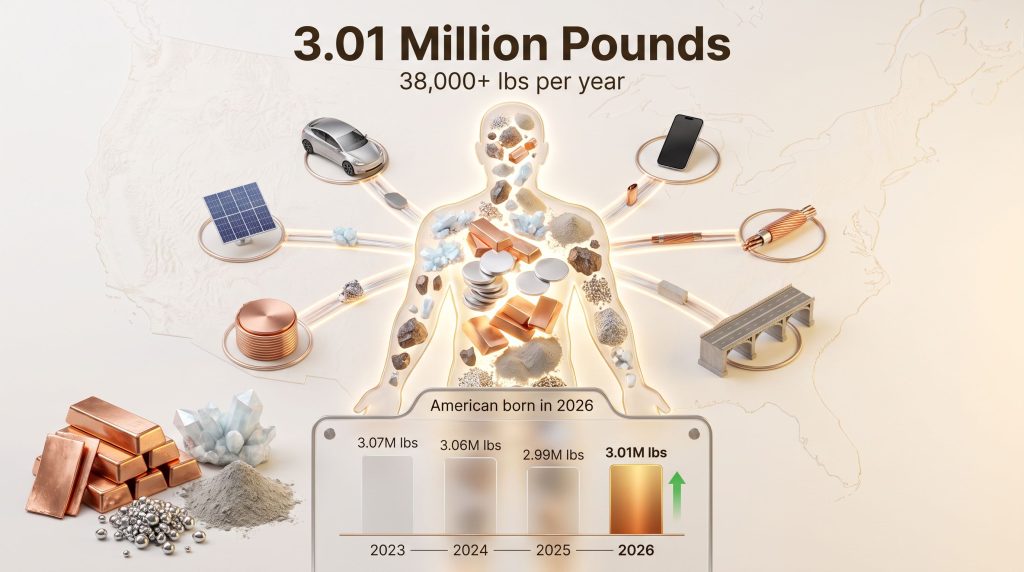
Every smartphone unlocked, every road driven, every hospital visited draws on a vast and largely invisible network of extracted materials. Before a single infrastructure project breaks ground or an electric vehicle rolls off a production line, minerals must be mined, processed, and distributed at enormous scale. The Mineral Baby infographic makes this reality tangible by converting lifetime consumption data into a single, human-scale figure that anyone can grasp and engage with meaningfully.
When big ASX news breaks, our subscribers know first
What the Mineral Baby Infographic Actually Measures
The Mineral Baby infographic is an annual educational publication produced by the Minerals Education Coalition (MEC), a nonprofit entity operating under the Society for Mining, Metallurgy & Exploration (SME). Its central purpose is straightforward but powerful: to convert vast, abstract commodity statistics into a single human-scale figure that anyone can understand.
Rather than presenting tonnes of aggregate national output, the infographic answers a more personal question. How much does one person consume? The answer, expressed as a lifetime total, forces a recalibration of how most people think about mining's relevance to daily existence.
How the Calculation Works
The methodology behind the Mineral Baby infographic draws on four primary data sources:
- Production figures compiled by the National Mining Association
- Commodity-level data from the U.S. Geological Survey (USGS) Mineral Commodity Summaries
- Life expectancy projections from the U.S. Census Bureau
- Mortality statistics from the Centers for Disease Control (CDC)
Annual per-capita mineral demand is multiplied by the average U.S. life expectancy to produce the lifetime consumption estimate. Critically, each edition uses statistics from the prior calendar year, meaning the 2026 Mineral Baby reflects actual 2025 resource production and consumption data rather than forecasts or projections.
This lag structure makes the infographic a reliable retrospective benchmark rather than a predictive tool, grounding its figures in verified production records rather than modelled assumptions.
Who Uses the Mineral Baby and Why
The infographic is deliberately designed for broad distribution across a wide range of audiences and settings. The MEC's annual mineral infographics have become a widely referenced resource across multiple sectors:
- K-12 classrooms: Integrated into science, geography, and economics curricula to contextualise resource dependence for younger generations
- Congressional briefings: Used to support legislative discussions on minerals policy, domestic production, and supply chain resilience
- Workforce development programs: Deployed in trade schools and universities to illustrate the career relevance and scale of the mining sector
- Public advocacy campaigns: Shared by industry associations to build community-level understanding of mining's contribution to modern life
SME Executive Director Melissa Russell has publicly noted that the infographic functions as a conversation starter, helping audiences from students to policymakers recognise how deeply minerals and metals are embedded in the products and systems they use every day.
The 2026 Figure: 3.01 Million Pounds Per Lifetime
The headline figure from the 2026 Mineral Baby infographic is 3.01 million pounds of minerals, metals, and fuels consumed per American across an average lifetime. Translated into annual terms, this equates to roughly 38,000 pounds of new mineral resources required every single year for each person.
Year-Over-Year Consumption Trends
Tracking the Mineral Baby figure across recent editions reveals meaningful shifts in American consumption patterns:
| Edition Year | Estimated Lifetime Consumption |
|---|---|
| 2023 Mineral Baby | 3.07 million lbs |
| 2024 Mineral Baby | 3.06 million lbs |
| 2025 Mineral Baby | 2.99 million lbs |
| 2026 Mineral Baby | 3.01 million lbs |
The 2026 figure represents a modest but notable rebound from the 2025 dip, signalling renewed demand pressure across multiple commodity categories. Furthermore, the fluctuations visible in this table are not random noise. They reflect real shifts in U.S. industrial output, the pace of energy transition investment, construction activity, and the broader manufacturing cycle.
Which Minerals Drove the 2026 Increase?
The 2026 edition recorded increases across a broad range of commodities compared to the prior year. Each increase carries its own demand story:
- Cement: Sustained by infrastructure investment and domestic construction expansion across both public and private sectors
- Copper: Electrification of transportation networks, EV charging infrastructure, and grid modernisation are collectively amplifying the copper supply crunch at a rate that is outpacing new mine supply
- Lithium: The battery storage lithium boom and electric vehicle proliferation are the primary consumption drivers, with demand growing rapidly from a comparatively small base
- Iron ore: Domestic steel production and manufacturing reshoring initiatives are sustaining volumes across this foundational commodity
- Coal: Despite accelerating renewable energy deployment, coal continues to contribute to baseload power generation in the U.S. energy mix
- Lead: Battery backup systems and a range of industrial applications sustain persistent lead demand
- Zinc: Galvanisation demand is rising alongside construction and infrastructure activity
- Salt: Broad chemical processing and industrial applications underpin continued consumption
- Silver: Uniquely positioned as both a monetary metal and a critical conductor in solar photovoltaic technology, silver's dual role makes it a bellwether for clean energy growth
Silver's inclusion in the list of commodities showing increased consumption is particularly instructive. It illustrates how the energy transition does not reduce mineral demand but actively redirects and amplifies it into new categories.
The Energy Transition Paradox: Clean Power Requires More Mining
One of the most counterintuitive realities embedded within the Mineral Baby data is that the shift toward renewable energy dramatically increases rather than decreases the total volume of minerals required per unit of energy generated.
Solar panels, wind turbines, and lithium-ion battery systems are substantially more mineral-intensive than the conventional fossil fuel infrastructure they are replacing. A single offshore wind turbine requires several times more copper per megawatt of capacity than a gas-fired power plant. Solar panels consume silver as a conductor, aluminium as a structural frame, and silicon as a semiconductor, all extracted and refined through conventional mining processes.
Copper demand, in particular, is forecasted by multiple industry analysts to outpace global mine supply through the early 2030s as electrification accelerates. The lead times required to bring new copper mines into production typically span ten to fifteen years from discovery to first output, meaning the supply response to current demand signals will arrive late relative to need. Consequently, the critical minerals demand trajectory points firmly upward for the foreseeable future.
The Strategic Dimension: Domestic Supply and National Security
The U.S. government has been intensifying efforts to reduce dependence on foreign mineral imports, particularly from geopolitically sensitive supply chains. Critical minerals policy has become embedded in national security frameworks, trade strategy, and industrial planning.
According to the 2026 USGS Mineral Commodity Summaries, minerals remained fundamental to the U.S. economy at multiple levels, spanning extraction, processing, and the manufacture of finished products. The same report confirmed that the estimated total value of nonfuel mineral production in the U.S. reached US$112 billion in 2025, representing a 6% increase over the 2024 total. This figure reflects a minerals sector that is growing in both economic scale and strategic significance.
The gap between projected mineral demand and current domestic production capacity represents a structural challenge. Closing that gap requires not just new mining activity but sustained investment in processing, refining, and recycling infrastructure across the full supply chain.
Visualising 3.01 Million Pounds: Minerals Hidden in Plain Sight
Making the Mineral Baby figure tangible requires connecting it to everyday products that most consumers never associate with mining. The table below maps common product categories to their primary mineral inputs:
| Product Category | Key Minerals Required |
|---|---|
| Smartphones and electronics | Lithium, cobalt, silver, gold, rare earth elements |
| Electric vehicles | Lithium, copper, nickel, manganese, cobalt |
| Solar panels | Silver, silicon, aluminium, tellurium |
| Medical devices | Titanium, platinum, cobalt, tantalum |
| Roads and infrastructure | Cement, aggregates, iron ore, bitumen |
| Household appliances | Steel, copper, aluminium, zinc |
By volume, cement and construction aggregates account for the largest share of lifetime consumption. However, by economic and strategic value, technology metals including lithium, cobalt, and rare earth supply chains carry disproportionate weight despite their smaller volumetric contribution.
This distinction matters for policy and investment alike. Securing supply of high-volume bulk materials like cement is largely a domestic logistics challenge. Securing supply of low-volume, high-value critical minerals is a geopolitical and exploration challenge of an entirely different character.
Less Commonly Known Mineral Dependencies
Beyond the headline commodities, several less visible mineral dependencies deserve attention:
- Tellurium is a byproduct of copper refining and a critical input for cadmium telluride solar panels. Its supply is structurally constrained because it cannot be mined directly.
- Tantalum, derived primarily from coltan ore, is essential for capacitors in virtually every electronic device yet remains almost entirely sourced from a handful of countries.
- Rare earth elements are not actually rare in terms of crustal abundance but are economically and technically difficult to concentrate and separate, creating supply bottlenecks that do not reflect geological scarcity.
- Gallium and germanium, used in semiconductors and fibre optic systems, have historically been almost entirely supplied by a single dominant producer nation, creating documented supply chain vulnerabilities that policymakers are now actively working to address.
The Mineral Baby as a Workforce Development Tool
Beyond its role in public education and policy advocacy, the Mineral Baby infographic serves a practical function in mining workforce development. The industry faces a generational talent shortage, with a significant proportion of its experienced workforce approaching retirement age and insufficient numbers of younger workers entering the sector to replace them.
By making the scale and relevance of mineral consumption visceral and personal, the infographic helps career counsellors, educators, and recruitment programs communicate mining's centrality to modern life. Furthermore, innovations in critical minerals processing are creating new and technically sophisticated career pathways that appeal to younger, engineering-oriented graduates.
When a student understands that their smartphone alone requires over thirty distinct mineral inputs, the career pathways that support those supply chains begin to feel tangible and meaningful rather than abstract. The North American mining sector has actively promoted the infographic as a recruitment and awareness tool across educational institutions.
The official 2026 Mineral Baby infographic is available as a free download in both PDF and JPG formats at MineralsEducationCoalition.org/stats, and MEC actively encourages educators, policymakers, journalists, and industry professionals to distribute it as a public educational resource.
The next major ASX story will hit our subscribers first
What Rising Mineral Demand Signals for the Decades Ahead
Structural Demand Drivers Are Not Short-Term
The forces pushing per-capita mineral consumption upward are not cyclical. They are structural. Electrification of transportation, expansion of digital infrastructure, urbanisation, advanced manufacturing reshoring, and the build-out of renewable energy systems all compound demand simultaneously.
Efficiency gains in materials science and the substitution of scarcer minerals with more abundant alternatives will partially moderate growth in specific commodity categories over time. However, the net trajectory, informed by the multi-decade arc of the Mineral Baby infographic figure, points consistently upward.
The Role of Recycling and the Circular Economy
Secondary recovery and recycling programs are gaining increasing traction as a partial offset to primary extraction demand. Circular economy frameworks for lithium, copper, and rare earth elements are attracting both policy attention and private investment, driven by the dual incentive of reducing import dependence and lowering the environmental footprint of mineral supply chains.
However, recycling alone cannot close the supply-demand gap for most critical minerals. The installed base of products containing recoverable materials is still being built, meaning the volume of recyclable material available for secondary processing will grow meaningfully only over the coming decades rather than in the near term.
The Mineral Baby as an Economic Barometer
Viewed across a multi-year series, the trajectory of the Mineral Baby infographic functions as a useful proxy for the health and direction of the broader U.S. industrial economy. A rising figure reflects expanding construction, accelerating electrification, and growing manufacturing activity. A dip, as seen in the 2025 edition, signals contraction or efficiency-driven moderation across those same sectors.
The rebound to 3.01 million pounds in the 2026 edition, driven by increases across cement, copper, lithium, and silver among others, suggests that the broad forces of energy transition investment and domestic industrial expansion are reasserting themselves after a period of consolidation.
This article is intended for informational and educational purposes. Figures relating to future mineral demand, price trajectories, and supply forecasts involve inherent uncertainty and should not be construed as investment advice. Readers are encouraged to consult the primary sources referenced, including the USGS Mineral Commodity Summaries and the Minerals Education Coalition, for verified current data.
Want to Capitalise on the Surging Demand for Critical Minerals?
Discovery Alert's proprietary Discovery IQ model delivers real-time alerts on significant ASX mineral discoveries — instantly converting complex commodity data into actionable investment insights across copper, lithium, silver, and beyond. Explore how historic mineral discoveries have generated extraordinary returns on Discovery Alert's dedicated discoveries page, then begin your 14-day free trial to position yourself ahead of the market.