July 14, 2026
The Hidden Geometry of Global Energy: Why One Narrow Passage Controls Everything
Every barrel of crude oil that reaches a refinery in Japan, South Korea, or China from the Persian Gulf travels through a passage barely 33 kilometres wide at its narrowest navigable point. This is not a modern logistics quirk but a structural feature of global energy architecture that has persisted for decades. The Strait of Hormuz sits at the intersection of geopolitical ambition and raw physical necessity, and the current Trump Strait of Hormuz toll plan has forced energy markets to confront just how fragile this arrangement truly is.
Understanding the full weight of what is currently unfolding requires stepping back from the daily price ticker and examining the mechanics of how disruption translates into supply loss, and why the world has no reliable substitute for this chokepoint. Furthermore, the current crude oil prices signal that markets are already beginning to absorb the risk implications of reduced transit activity.
When big ASX news breaks, our subscribers know first
Why the Strait of Hormuz Cannot Be Replaced
The Strait of Hormuz connects the Persian Gulf to the Gulf of Oman, serving as the sole maritime exit point for crude oil exported from Saudi Arabia, Iraq, Iran, Kuwait, the UAE, and Qatar. There is no equivalent alternative route with the same capacity. The East-West Pipeline in Saudi Arabia and the Habshan-Fujairah pipeline in the UAE offer partial bypass capability, but combined they can handle only a fraction of the volume that transits Hormuz daily.
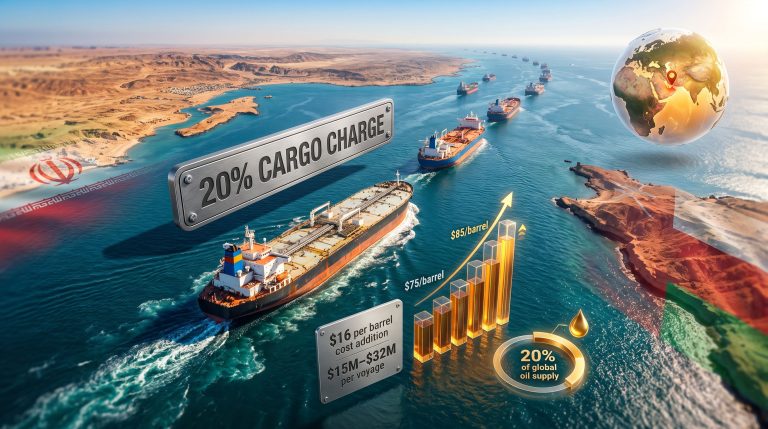
Under normal operating conditions, the strait handles approximately 21 million barrels of crude per day, accounting for roughly 20% of all seaborne oil trade globally. Around 120 vessels transit the passage daily across multiple shipping lanes, carrying not just crude but refined products, liquefied natural gas, and other hydrocarbons.
| Metric | Estimated Figure |
|---|---|
| Daily vessel transits (normal conditions) | ~120 ships |
| Share of global seaborne oil trade | ~20% |
| Daily crude volume transiting | ~17-21 million bbl/day |
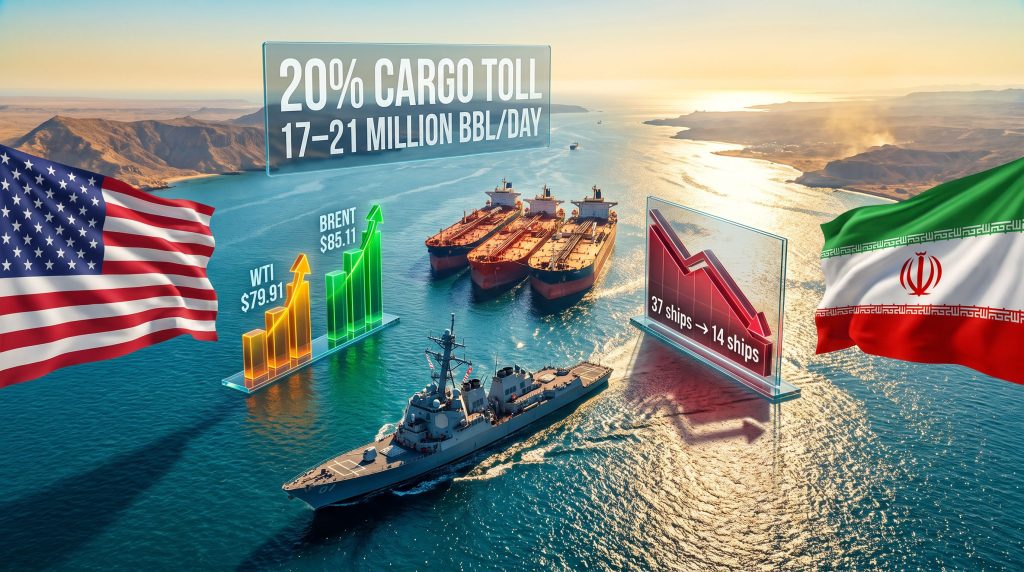
| Vessel traffic recorded July 13, 2026 | 14 ships (vs. 37 one week prior) |
| Crude tankers among those 14 ships | 4 |
That drop from 37 vessels to just 14 in a single week is not a rounding error. It is a structural signal. When crude tanker counts fall from double digits to single digits, the downstream effect is not gradual. It is compressive.
How the Trump Strait of Hormuz Toll Plan Evolved in Three Phases
The current situation did not emerge overnight. The Trump administration's approach to monetising Hormuz transit followed a progression that moved from collaborative framework to unilateral enforcement. In addition, geopolitical trade tensions across the broader Middle East region have amplified the market sensitivity to each policy shift.
| Phase | Core Proposal | Operational Status |
|---|---|---|
| Joint Venture | U.S.-Iran shared toll collection framework | Discussed; never formally enacted |
| Ceasefire Pause | Zero tolls for 60 days pending negotiations | Agreed; subsequently abandoned |
| 20% Unilateral Fee | U.S. as "Guardian of the Strait" imposing cargo toll | Reinstated July 13, 2026 with naval blockade |
Phase One involved a proposed joint venture structure in which both the United States and Iran would share toll revenues from vessels transiting the strait. This model never progressed to formal implementation.
Phase Two introduced a 60-day toll-free ceasefire window tied to broader diplomatic negotiations, most notably the U.S.-Iran memorandum of understanding (MoU). This period generated significant optimism in oil markets, with analysts and institutions including the International Energy Agency (IEA) revising their supply forecasts toward surplus.
Phase Three, announced on July 13, 2026, saw the administration reinstate a 20% cargo fee on vessels transiting the strait, framing the United States as the self-declared "Guardian of the Strait." This was accompanied by a naval blockade posture that has already demonstrably reduced vessel traffic.
Breaking Down the $16-Per-Barrel Cost Estimate
Andy Lipow, president of Lipow Oil Associates, estimated via CNBC's Squawk Box Asia that the 20% proposed fee would add approximately $16 per barrel to crude oil shipped through the strait. This figure is based on applying the percentage fee to the cargo value of a standard crude tanker consignment under current market pricing.
To understand the arithmetic:
- A very large crude carrier (VLCC) typically carries around 2 million barrels of crude.
- At current WTI pricing near $79.91 per barrel, that cargo is valued at roughly $160 million.
- A 20% fee on that cargo value equals approximately $32 million per vessel.
- Spread across the 2 million barrels, the per-barrel cost addition approaches $16.
At approximately $2 million per ship for smaller vessels and significantly more for VLCCs, theoretical gross toll revenue at 120 daily transits could approach $240 million per day in a best-case enforcement scenario. However, legal disputes, vessel rerouting, and defiance from non-signatory nations would substantially erode any real collection.
The most important insight here is not what the toll costs, but what it signals. A $16 per barrel cost addition is significant but absorbable. A complete closure of the strait is not.
How Shipping Costs Pass Through to Oil Benchmarks
In crude markets, shipping cost increases are not always passed directly to end consumers in a linear way. Tanker freight rates, reflected in instruments such as the Baltic Dirty Tanker Index, feed into the netback calculations that refiners use to determine the effective delivered cost of crude. When freight rates spike due to geopolitical risk premiums, refiners respond by seeking alternative origin grades, creating pricing distortions that ripple through regional crude benchmarks including Brent and Dubai. Consequently, crude oil price trends across both benchmarks have become increasingly reactive to transit disruption signals rather than purely to fundamental supply and demand shifts.
The Legal Contradiction at the Heart of the Toll Plan
Under the United Nations Convention on the Law of the Sea (UNCLOS), all vessels enjoy the right of transit passage through straits used for international navigation. This right cannot be suspended, and fees may only be charged for specific services rendered to a vessel, not as a blanket percentage levy on cargo value.
The International Maritime Organisation (IMO) has affirmed this position, providing no legal framework that would authorise a unilateral toll of this nature. The legal friction is compounded by a significant historical contradiction: the United States previously characterised Iran's own proposed strait toll as illegal under international maritime law. The administration's current posture as self-declared Guardian of the Strait has no recognised standing under existing UNCLOS frameworks.
This creates an enforcement paradox. If the toll cannot be legally collected, it functions primarily as a coercive deterrent rather than a revenue mechanism, which actually amplifies its role as a geopolitical signal rather than diminishing it. The IMO's formal position on the matter reinforces that the current proposal sits well outside established maritime law.
How Oil Markets Are Pricing the Announcement
The immediate market reaction to the July 13 announcement was swift and directional:
- WTI August futures: Rose 2.27% to $79.91 per barrel
- Brent September futures: Climbed 2.14% to $85.11 per barrel, extending a prior session gain of 9.6%
These moves reflect a market recalibrating not the cost of the toll itself, but the probability distribution around physical supply disruption. Henry Hoffman, co-portfolio manager at Catalyst Energy Infrastructure Fund, noted that the more consequential risk is not the direct cost burden imposed by the fee but the potential for renewed physical supply losses, a risk that grows exponentially if vessel traffic continues to fall.
This framing is critical for investors. The oil market is not pricing a $16 per barrel shipping surcharge. It is pricing a non-linear tail risk: the scenario where storage fills, exports stop, and producers are forced to curtail output in a way that cannot be measured simply by examining damaged infrastructure. Furthermore, the trade war oil impact on global supply chains is adding yet another layer of complexity to an already volatile pricing environment.
The next major ASX story will hit our subscribers first
The Storage Overflow Mechanism and Why It Amplifies Supply Loss
One of the least widely understood dynamics in this situation involves the cascading effect of storage saturation. When crude tankers cannot exit the Persian Gulf:
- Crude accumulates at export terminals faster than onshore storage can absorb it.
- Storage capacity reaches operational limits, typically within days to weeks depending on the producer.
- Producers have no choice but to shut in wellhead production.
- Shut-in production is not simply deferred. Restarting wells and restoring export infrastructure takes time, meaning supply loss extends well beyond the physical disruption window.
This mechanism means the effective supply loss from even a partial Hormuz disruption is materially greater than the volume of crude visibly blocked at any given moment.
| Scenario | Vessel Traffic Impact | Estimated Supply Effect | Price Pressure |
|---|---|---|---|
| Toll enforcement only | Moderate decline | Minimal direct loss | Low-to-moderate upward |
| Partial disruption | Significant decline | 3-5 million bbl/day at risk | Moderate-to-high upward |
| Full strait closure | Near-zero traffic | 17-21 million bbl/day disrupted | Severe price spike |
Saudi Arabia's $11 Per Barrel Price Cut and the Asian Demand Race
Complicating the supply picture further is a timing mismatch developing in Asian crude markets. Saudi Aramco recently cut its official selling price for its primary Asian crude grade by approximately $11 per barrel, moving it from a significant premium to a $1.50 discount versus the Oman/Dubai benchmark. This is an aggressive pricing manoeuvre designed to recapture Chinese refinery demand that fell sharply during the initial period of strait disruption.
The strategic risk embedded in this move is subtle but important. Chinese demand may begin recovering precisely as Middle Eastern supply reliability deteriorates further. If Chinese refiners increase purchase commitments based on current Saudi pricing, and then those cargoes face disruption or delay due to renewed Hormuz tension, the downstream impact on Asian refinery margins and regional product pricing could be severe.
This creates a scenario where demand recovery and supply vulnerability are advancing simultaneously, rather than in the sequential, cushioned way that markets typically price in. The OPEC market influence on pricing strategy across member states is also adding pressure to how quickly producers can adapt to shifting demand signals from Asia.
Citi's Warning: The MoU Unravelling and Its Price Implications
Citi Research published a note on July 14, 2026 stating that the risks of military escalation had risen materially following the toll announcement. The bank identified a secondary scenario in which Iran exits the MoU entirely until after U.S. midterm elections, a move Citi described as likely to sustain a higher-for-longer oil price environment across the remainder of 2026.
The IEA's most recent surplus forecast was constructed on the assumption that tanker traffic through Hormuz would gradually normalise following the MoU signing. That assumption is now under direct threat. The IEA projected the oil market would return to surplus toward the end of 2026, but that calculation did not incorporate a scenario where the MoU collapses and traffic through the strait remains structurally suppressed.
When Citi analysts describe escalation risks as having risen materially, the investment community should interpret this not as a qualitative warning but as a probability-weighted revision to oil price forecasts across multiple time horizons.
Geopolitical Scenarios Traders Must Now Price In
| Scenario | Probability Driver | Oil Price Implication |
|---|---|---|
| Toll enforcement, no escalation | Diplomatic restraint holds | Modest price premium maintained |
| MoU collapse, no closure | Iran exits talks pre-midterms | Sustained elevated prices |
| Full strait closure | Military confrontation triggers shutdown | Severe supply shock; prices spike sharply |
Each of these scenarios carries a fundamentally different risk premium for energy markets, and the current pricing reflects a blend of probability-weighted expectations rather than a single deterministic outcome. For commodity traders and energy equity investors, the key variable is not which scenario materialises but how quickly the market reprices as evidence accumulates.
Frequently Asked Questions: Trump's Hormuz Toll Plan
What is Trump's proposed Strait of Hormuz toll?
The Trump Strait of Hormuz toll plan, as declared on July 13, 2026, positions the United States as the Guardian of the Strait and proposes a 20% fee on all cargo transiting the passage. This was accompanied by a naval blockade posture.
How much would the 20% Hormuz fee add to oil prices?
Lipow Oil Associates estimates the fee would add approximately $16 per barrel to the cost of crude shipped through the strait, based on applying the 20% levy to standard VLCC cargo values at current market prices.
Is the Hormuz toll legal under international law?
Under UNCLOS, transit passage through international straits is guaranteed to all vessels. The IMO has confirmed there is no legal basis for a blanket cargo toll of this nature. The U.S. position as self-declared Guardian has no formal recognition under existing maritime law frameworks.
Which countries are most affected by the Strait of Hormuz toll?
Nations with the greatest exposure include China, Japan, South Korea, and India, all of which source a substantial proportion of crude imports from Persian Gulf producers whose only maritime export route is through Hormuz.
What happens to oil prices if the Strait of Hormuz closes?
A full closure would disrupt 17 to 21 million barrels per day of crude flow, representing approximately 20% of global seaborne oil trade. Price modelling suggests a severe supply shock scenario with prices spiking sharply, though the exact magnitude would depend on strategic reserve releases and demand destruction responses.
How has vessel traffic through Hormuz changed since the toll announcement?
Kpler data recorded just 14 ships transiting the strait on July 13, 2026, including only 4 crude tankers, compared to 37 vessels just one week earlier. This represents a decline of more than 60% in total traffic within a single week.
Key Takeaways for Energy Market Participants
- The 20% cargo toll adds an estimated $16 per barrel to crude shipped through the strait under current proposals
- Vessel traffic dropped from 37 ships to 14 ships in one week, signalling that behavioural deterrence is already working before formal enforcement
- The plan's greatest market risk is not the toll cost itself but the escalating conflict signal and potential for physical supply disruption through the storage overflow mechanism
- The IEA's 2026 oil surplus forecast was explicitly contingent on normalising Hormuz traffic, an assumption now structurally compromised
- Saudi Arabia's $11 per barrel price cut to Asian buyers reflects urgency to retain Chinese demand before Middle Eastern supply reliability deteriorates further
- International legal challenges under UNCLOS and IMO frameworks create significant enforcement uncertainty, but the coercive deterrent effect on vessel traffic is already measurable
This article is intended for informational purposes only and does not constitute financial or investment advice. All price figures, vessel traffic data, and analyst estimates are drawn from publicly available sources and are subject to change as the geopolitical situation evolves. Readers should conduct their own due diligence before making investment decisions based on commodity market analysis.
Want to Stay Ahead of the Next Major Commodity Market Shift?
Discovery Alert's proprietary Discovery IQ model scans ASX announcements in real time, delivering instant alerts on significant mineral discoveries across more than 30 commodities — turning complex market signals into clear, actionable opportunities for both traders and long-term investors. Explore how historic mineral discoveries have generated substantial returns and begin your 14-day free trial at Discovery Alert to position yourself ahead of the market.