August 3, 2026
The Hidden Story Behind a Flat Number: Decoding Australia's Exploration Expenditure Plateau
When aggregate spending figures hold steady across a twelve-month period, the instinct is to read stability as a positive sign. In the context of mineral exploration, however, flat headline numbers often conceal more than they reveal. The real story lies beneath the surface, embedded in commodity-level shifts, cost pressures, and the structural decisions being made today that will determine what mines exist a decade from now.
Australia's mineral exploration expenditure in 2025 settled at approximately A$3.95 billion, a figure that looks reassuringly close to the prior year's result. However, examining the layers beneath that number tells a more complex, and in some respects more concerning, story about where exploration capital is flowing, what it is avoiding, and what the consequences of those choices may be through the early 2030s.
When big ASX news breaks, our subscribers know first
How Australia's Exploration Expenditure Performed Across 2025
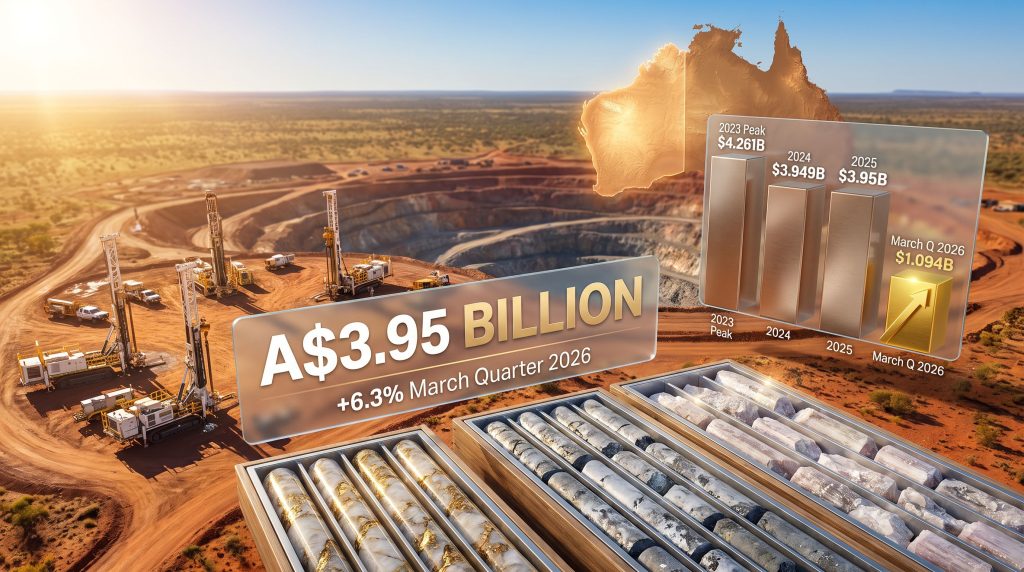
The Australian Bureau of Statistics data confirmed that full-year 2025 mineral exploration expenditure rose by just 0.2% compared to 2024, arriving at A$3.95 billion. That marginal uplift followed a more significant 7.0% contraction in 2024, which itself came directly after the sector's record peak of A$4.261 billion in 2023.
Within the calendar year, quarterly performance was uneven. The December quarter 2025 saw expenditure pull back 1.5% quarter-on-quarter to A$1.05 billion, reflecting softening conditions heading into the new year. That weakness was then reversed in the March quarter 2026, where seasonally adjusted expenditure climbed 6.3% to reach A$1.094 billion, offering the first constructive forward signal in several reporting periods.
The table below captures the full progression across this cycle:
| Period | Expenditure (A$) | Change |
|---|---|---|
| Full Year 2023 (Peak) | $4.261 billion | Record high |
| Full Year 2024 | $3.949 billion | -7.0% |
| Full Year 2025 | $3.95 billion | +0.2% |
| December Quarter 2025 | $1.05 billion | -1.5% QoQ |
| March Quarter 2026 | $1.094 billion (SA) | +6.3% QoQ |
The stabilisation in 2025 represents a floor rather than a rebound. The sector absorbed the shock of the post-boom correction but has not yet demonstrated the momentum required to breach the 2023 high.
Which Commodities Drove Exploration Spending in 2025?
Perhaps the most strategically significant feature of the 2025 data is not the total figure but what lies within it. The flat headline number masked substantial internal capital rotation, with funds moving decisively between commodity categories. Furthermore, understanding these shifts is essential for grasping the longer-term implications for Australian exploration trends and the country's resource development pipeline.
Gold: The Anchor Holding Expenditure Steady
Gold retained its position as the dominant force in Australian exploration budgeting. With gold prices sustaining historically elevated levels through much of 2025 and into 2026, exploration companies channelled increasing resources into gold-focused drilling programmes. The economic case for gold exploration remained compelling, with higher spot prices improving the commercial threshold at which marginal deposits become viable targets. Gold's resilience helped prevent a more severe national expenditure contraction.
Silver, Lead, and Zinc: Underrated Contributors
A less-discussed development in the 2025 data was the contribution from silver, lead, and zinc exploration. These commodities attracted increased spending, partly driven by the structural relationship between silver and gold (many programmes target both simultaneously) and partly by improving price signals in base metals markets. This category is often overlooked in headline commentary but provided a meaningful offset to losses elsewhere.
Where Capital Retreated
Three commodity groups experienced meaningful budget contractions:
-
Lithium and battery minerals: Following the extraordinary boom in lithium exploration through 2022 and 2023, prices collapsed sharply as supply-side capacity additions outpaced near-term demand growth. The lithium market downturn saw lithium carbonate prices fall from peaks above US$80,000 per tonne to well below US$15,000 per tonne at various points, eliminating the commercial case for many greenfield programmes. The result was a significant pullback in drilling activity across Western Australia's spodumene belt and other lithium terranes.
-
Iron ore and bulk commodities: Mature basin dynamics in the Pilbara and other established iron ore regions suppressed greenfield interest. With major producers managing existing operations rather than seeking new large-scale discoveries, early-stage exploration investment in bulk commodities remained subdued.
-
Nickel: This commodity faced the sharpest capital allocation pressure of any category. The combination of depressed nickel prices, driven in large part by a surge in Indonesian laterite-sourced supply, and the suspension or closure of several Australian nickel operations created a deeply unfavourable environment for exploration investment. Companies that had aggressively pursued nickel sulfide targets during the EV-related boom pulled back sharply.
The 2025 stability in total Australia mineral exploration expenditure concealed a structural commodity rotation of considerable magnitude. Capital migrated toward precious metals and away from the battery minerals and bulk commodities that defined the prior exploration cycle. This internal shift carries significant implications for Australia's future resource discovery pipeline.
State-by-State: Where Exploration Capital Concentrated
Geographic concentration of exploration spending remained a defining characteristic of the Australian sector in 2025. The following breakdown reflects estimated distribution based on available ABS state-level data:
| State/Territory | Estimated Share of National Spend | Primary Commodity Focus |
|---|---|---|
| Western Australia | ~65-70% | Gold, Lithium, Nickel, Iron Ore |
| Queensland | ~10-12% | Coal, Copper, Base Metals |
| South Australia | ~6-8% | Copper, REEs, Olympic Dam region |
| Northern Territory | ~4-6% | Gold, Uranium, Critical Minerals |
| New South Wales | ~3-5% | Gold, Tin, Base Metals |
Western Australia's dominance is underpinned by an exceptional combination of geological endowment, established infrastructure, deep geoscience data archives, and a regulatory framework that, while imperfect, is more mature than most comparable jurisdictions. The state's Archaean greenstone belts remain among the world's most prospective terranes for gold, and the Goldfields region continues to attract disproportionate exploration activity.
South Australia deserves particular attention for its growing relevance to copper and rare earth element exploration, anchored by the Olympic Dam corridor and emerging activity in the Gawler Craton. South Australia's geological survey has invested in releasing high-quality pre-competitive geoscience data, which has demonstrably influenced private sector exploration decisions by reducing the cost and risk of initial target generation.
The Northern Territory and New South Wales represent underexplored frontiers relative to their geological potential. Both jurisdictions have attracted growing policy attention, though translating that interest into sustained private exploration capital remains a work in progress.
The Structural Forces Suppressing Real Exploration Activity
The 0.2% nominal increase in Australia's mineral exploration expenditure in 2025 becomes considerably less reassuring when examined through an inflation-adjusted lens.
Drilling Cost Inflation: The Silent Erosion of Exploration Value
Exploration drilling rates, labour costs, and equipment costs rose materially through 2022 and 2023, with the inflationary wave persisting into 2024 and 2025. Contract drilling rates in Western Australia increased by an estimated 20-35% compared to pre-pandemic benchmarks, depending on rig type and location. This means that the same nominal budget purchases meaningfully fewer metres drilled today than it did three years ago.
In practical terms, the real volume of exploration activity — measured in drill metres, geochemical samples, or geophysical surveys completed — likely declined in 2025 relative to 2022 and 2023 levels, even as dollar expenditure held steady. This is the hidden contraction that headline figures do not capture.
Capital Market Tightening and Junior Explorer Access
Junior exploration companies, which represent the majority of greenfield discovery activity in Australia, depend on equity capital markets for funding. Rising interest rates through 2022–2024 compressed risk appetite among retail and institutional investors, making it considerably harder for early-stage explorers to raise capital at reasonable valuations. Many companies were forced to scale back drilling programmes, defer tenement commitments, or prioritise brownfield targets over higher-risk greenfield opportunities. In addition, junior exploration incentives have become increasingly important in bridging the gap left by tighter private capital markets.
Permitting and Regulatory Timelines
A persistent and growing frustration across the Australian exploration sector is the time required to obtain exploration licences, heritage clearances, and environmental approvals. In several jurisdictions, timeline blowouts of six to eighteen months between application and approval have become routine. These permitting challenges have a direct effect on exploration budgeting, as companies defer committed spend while awaiting approvals that may or may not arrive on a predictable schedule.
When adjusted for drilling cost inflation, the real purchasing power of Australia's 2025 exploration expenditure represents a meaningfully smaller volume of actual ground investigation than the nominal figure implies. Policymakers and investors should be cautious about interpreting flat expenditure as flat activity.
Australia's Position in the Global Exploration Landscape
Globally, Australia competes with Canada, the United States, Latin America, and parts of Africa for exploration capital from major mining companies and internationally mobile junior explorers. Australia has historically captured a substantial share of global non-ferrous exploration budgets, typically ranking among the top three destinations worldwide.
Several dynamics are reshaping how international capital evaluates Australian exploration opportunities:
-
Demand signals from the United States, European Union, and Japan for critical minerals supply chain diversification have created renewed interest in Australian copper, rare earth, and battery mineral projects, even as domestic lithium prices remain depressed.
-
Canada's competitive exploration tax credit framework, particularly the flow-through share financing mechanism, provides structural advantages for junior explorers that Australia's capital markets framework does not replicate. This remains a long-standing competitive disadvantage for Australian exploration companies seeking retail investor participation.
-
Foreign direct investment in Australian exploration has provided a meaningful buffer, with Asian and European strategic investors taking positions in projects aligned with their critical minerals supply objectives. This FDI component has supported expenditure levels that purely domestic capital markets might not have sustained.
The next major ASX story will hit our subscribers first
Government Policy Programmes and Their Influence on Exploration
Federal and state-level policy frameworks have become increasingly important in shaping where exploration capital flows, particularly for early-stage critical mineral projects.
| Programme | Administering Body | Stage Supported | Key Benefit |
|---|---|---|---|
| International Partnerships in Critical Minerals (IPCM) | Federal Government | Early-Mid Stage | Cash grants for supply chain-aligned projects |
| Exploration Incentive Scheme (EIS) | WA Government | Greenfield | Co-funded drilling in underexplored areas |
| Critical Minerals Accelerator Initiative | Federal Government | Pre-feasibility | Grant funding and technical support |
The IPCM programme, which has directed grant funding to projects including Tivan's Speewah fluorite project in the Kimberley region of Western Australia (which received a A$7.4 million grant), represents one mechanism through which federal policy seeks to catalyse early-stage activity. These programmes do not substitute for private capital but can reduce the financial barrier at which companies commit to exploration and pre-feasibility work.
Western Australia's Exploration Incentive Scheme deserves recognition as one of the more effective state-level mechanisms globally for stimulating greenfield drilling. By co-funding drilling in underexplored regions and releasing the resulting data publicly, the programme reduces the informational asymmetry that often prevents capital from entering poorly understood geological provinces.
Is Australia's Exploration Pipeline Strong Enough for Future Production?
This is the question that matters most for Australia's long-term resource sector competitiveness, and the 2025 data provides grounds for concern. The mineral discovery curve suggests that sustained underinvestment in early-stage exploration creates compounding deficits in the project development pipeline that are difficult to reverse quickly.
The typical lead time from initial discovery to first production at a significant new mine ranges from ten to twenty years, depending on commodity, jurisdiction, and project complexity. This means that discoveries made — or not made — in 2024–2026 will determine what production capacity exists in the 2034–2046 window, precisely the period when global demand projections for copper, battery materials, and rare earths point to the steepest supply-demand gaps.
Several structural issues compound this concern:
-
Declining greenfield intensity: As capital rotated toward brownfield targets and near-mine extensions in 2025, the proportion of spending directed at genuinely new geological terrain decreased. Brownfield exploration carries lower discovery risk but also lower discovery potential in terms of scale and novelty.
-
Discovery rate trends: Independent analysis of global discovery data consistently shows that the average size and grade of new mineral discoveries has declined over multi-decade timeframes, reflecting both the geological reality that the most accessible deposits were found earlier and a shift in exploration methodology away from high-risk grassroots programmes.
-
The nickel discovery deficit: Given the near-complete withdrawal of exploration capital from Australian nickel in 2024–2025, the country's nickel sulfide discovery pipeline has effectively stalled. If nickel demand recovers alongside a genuine EV market reacceleration, the absence of new Australian discoveries entering the development pipeline could create a supply gap that takes a decade to address.
If Australia's exploration expenditure remains flat or contracts in real terms through 2026–2028, the country risks a meaningful reduction in new resource discoveries entering the development pipeline by the early 2030s. This is precisely when global demand projections for battery metals, copper, and rare earths are expected to accelerate to their steepest trajectory.
The 2026 Exploration Outlook: Early Recovery or False Dawn?
The March 2026 quarterly rebound of 6.3% to A$1.094 billion (seasonally adjusted) provides a constructive starting point for assessing the year ahead. Furthermore, recent ABS quarterly exploration data indicates a notable jump in drill metres, suggesting that physical exploration activity may finally be beginning to catch up with nominal spending figures. Several factors support a cautiously optimistic reading:
-
Gold price strength sustained above US$2,000 per ounce and periodically testing record highs creates a compelling economic environment for gold exploration budget expansion. Companies with prospective ground are incentivised to accelerate drilling programmes when the commodity economics are this supportive.
-
Capital market conditions have moderated compared to the peak tightening environment of 2023–2024, with the interest rate cycle having turned in most major economies. This should gradually improve equity raising conditions for junior explorers over 2026.
-
Critical mineral policy momentum at both federal and state levels continues to direct co-investment toward projects with supply chain relevance, providing a partial offset to purely market-driven funding gaps.
However, material risks remain:
-
Geopolitical uncertainty and global trade disruption continue to influence commodity price volatility, making multi-year exploration budget commitments more difficult for companies to justify.
-
Lithium price recovery has not yet materialised to the degree required to reinstate large-scale greenfield exploration programmes in that commodity.
-
Cost pressures have not fully unwound, meaning that even a nominal expenditure increase may translate into limited additional physical exploration activity.
Key Takeaways: Australia Mineral Exploration Expenditure 2025
-
Australia's total mineral exploration expenditure reached A$3.95 billion in 2025, a nominal increase of just 0.2% following a 7.0% decline in 2024 and remaining approximately 7.3% below the 2023 record of A$4.261 billion.
-
The headline figure conceals substantial commodity-level rotation, with gold and silver-lead-zinc gaining exploration budget share while lithium, nickel, and bulk commodities all lost ground.
-
On a real, inflation-adjusted basis, actual exploration activity almost certainly contracted in 2025, given drilling cost inflation of an estimated 20–35% versus pre-pandemic benchmarks.
-
Western Australia accounts for an estimated 65–70% of national exploration expenditure, a concentration driven by its multi-commodity geological endowment and established geoscience infrastructure.
-
The March 2026 quarterly result of +6.3% offers an early positive signal, though structural headwinds including permitting delays, capital market constraints, and commodity price uncertainty continue to weigh on the medium-term outlook.
-
The discovery pipeline risk is real: sustained underinvestment in greenfield exploration today creates a structural gap in new project development that will be difficult to close when demand cycles require it.
This article contains forward-looking analysis and references to industry data and expenditure forecasts. Exploration expenditure trends, commodity price projections, and regulatory timelines involve inherent uncertainty. Readers should not rely on this content as financial or investment advice. Independent professional advice should be sought before making investment decisions.
Want to Know When the Next Major ASX Mineral Discovery Hits the Market?
While Australia's exploration expenditure holds steady, the real opportunity lies in identifying significant mineral discoveries the moment they are announced — Discovery Alert's proprietary Discovery IQ model scans ASX announcements in real time, delivering actionable alerts across 30+ commodities to both short-term traders and long-term investors. Explore historic discoveries and their remarkable returns, then begin your 14-day free trial at Discovery Alert to position yourself ahead of the market.