July 31, 2026
When Commodity Cycles Turn: Reading the Signals in a Mining Recovery
The history of large-cap Australian mining companies is, at its core, a story of cyclical extremes. Balance sheets that look catastrophic at the bottom of a commodity cycle often transform dramatically as volumes recover, costs compress, and market sentiment slowly catches up with operational reality. For investors willing to sit with discomfort, these inflection points have historically represented some of the most asymmetric opportunities in equity markets. The question worth examining now is whether Mineral Resources (ASX: MIN) has reached one of those inflection points, and whether the Mineral Resources earnings outlook has genuinely changed in structural terms, or simply bounced.
When big ASX news breaks, our subscribers know first
Why the FY2026 Numbers Represent More Than a Cyclical Bounce
Three Pillars, One Recovery Story
What makes the current Mineral Resources earnings outlook analytically interesting is the simultaneity of improvement across all three of the company's major divisions. This is not a single-asset recovery story driven by one favourable commodity price move. Mining services, iron ore, and lithium all contributed to a materially better FY2026 result, and each did so while exceeding their own guidance targets.
That combination — record volumes alongside cost discipline alongside debt reduction — is rare. It signals something more than luck or timing. It suggests operational leverage is functioning as intended, where fixed and semi-fixed cost bases are being spread across higher throughput volumes, improving unit economics across the board.
The financial metrics tell a stark story when viewed in aggregate:
| Metric | FY2025 | FY2026 (Updated) | Change |
|---|---|---|---|
| Net Debt | ~A$5.4B | ~A$4.3B | Down 20% |
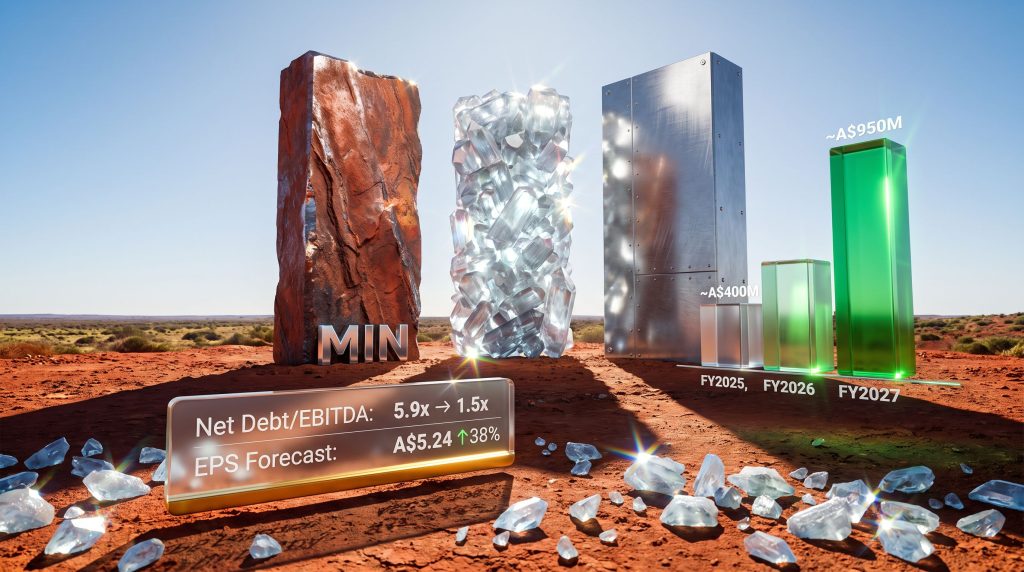
| Net Debt / EBITDA | 5.9x | 1.5x | Significant deleveraging |
| EPS Forecast | ~A$3.80 | A$5.24 | Up 38% |
| 1H : 2H EPS Split | N/A | 26:74 | Back-half weighted |
| Revenue (Half-Year) | N/A | ~A$3.05B | N/A |
| Underlying EBITDA (Half-Year) | N/A | ~A$1.2B | N/A |
| NPAT (Half-Year) | N/A | ~A$573M | N/A |
| Free Cash Flow (Half-Year) | N/A | ~A$293M | N/A |
The compression of Net Debt/EBITDA from 5.9x to 1.5x in a single fiscal year represents one of the most significant balance sheet transformations in MIN's recent operating history. This single ratio shift fundamentally changes the risk profile that had been suppressing the share price.
Decoding the 26:74 Earnings Split
The heavily back-half-weighted earnings split is worth understanding in structural terms, not just as an accounting curiosity. A 26:74 first-half to second-half EPS distribution typically reflects either a ramp-up in production volume through the year, improving commodity price realisations in the back half, or both. In MIN's case, the Bald Hill lithium restart in the fourth quarter of FY2026 would have contributed meaningfully to the back-half skew, as would the compounding effect of lower unit costs flowing through on larger volumes.
For investors tracking quarterly operational reports, this split is a reminder that annualised first-half earnings figures can be significantly misleading when used to extrapolate full-year results for this business.
How MIN Performed Against Its Own Guidance
Volume Outperformance Across Every Segment
One of the more underappreciated aspects of the FY2026 result is that outperformance was not isolated to the most commodity-sensitive division. Every major business line exceeded its most recently revised guidance midpoint:
- Mining Services: Record annual volumes delivered; guidance midpoint exceeded by approximately 5%
- Onslow Iron Ore: Guidance midpoint exceeded by approximately 6%, with unit costs beating the midpoint by 7%
- Mt Marion Lithium: Guidance midpoint exceeded by approximately 10%
- Wodgina Lithium: Guidance midpoint exceeded by approximately 13%, with unit costs beating by 4%
This breadth of outperformance matters for a specific reason. Analysts and investors who systematically adjust future guidance assumptions upward following consistent beats will mechanically lift forward earnings estimates, creating a self-reinforcing earnings revision cycle. The 38% upgrade to the FY2026 EPS forecast to A$5.24 reflects exactly this dynamic. Furthermore, Mineral Resources' full-year results confirm the scale of this operational turnaround across the group.
Cost Discipline as a Structural Signal
The cost beats at Onslow and Wodgina are particularly meaningful. At Onslow, the 7% unit cost beat suggests the mine's relatively modern infrastructure is performing better than conservative assumptions implied. Wodgina's 4% cost beat, in the context of the lithium market downturn that has brutally punished high-cost producers over recent years, demonstrates that MIN's hard-rock spodumene operations can generate acceptable margins even in a difficult pricing environment.
Cost discipline in mining is not simply a function of management efficiency. It reflects geological asset quality, mine design, infrastructure integration, and contractor management. Consistent cost beats across multiple sites suggest MIN's operational model is functioning with genuine competitive discipline, not just benefiting from favourable external conditions.
The Lithium Price Recovery and What It Means for Earnings
Understanding the Trough-to-Recovery Dynamic
Lithium carbonate spot prices fell below USD 10,000 per metric ton in recent periods, a level that rendered a large proportion of global lithium supply unprofitable. This was not a gradual softening but a collapse from boom-era prices exceeding USD 80,000 per metric ton in late 2022. The severity of this correction created a psychological overhang in equity markets that persisted well beyond the operational trough, which is typical of commodity cycles where investor trauma from prior losses suppresses re-rating even as fundamentals improve.
Long-run lithium carbonate price forecasts anchored at levels above USD 20,000 per metric ton through to 2033 are grounded in marginal cost economics. At sub-USD 10,000, the majority of hard-rock lithium projects globally are loss-making at the cash cost level, which structurally constrains new supply and supports eventual price recovery toward the marginal cost of production. In addition, the global lithium market is attracting significant new investment interest that could further influence supply and demand dynamics over the coming years.
For context, the doubling of MIN's average lithium price achievement in FY2026 relative to FY2025 provides a concrete illustration of how even modest price improvements translate into outsized earnings leverage for low-to-mid cost producers.
Bald Hill: Catalyst or Complication?
The restart of the Bald Hill lithium mine in the fourth quarter of FY2026 is one of the more nuanced elements of the current earnings thesis. Key parameters are worth tracking carefully:
| Factor | Detail |
|---|---|
| Restart Quarter | Q4 FY2026 |
| Target Capacity | 140,000 metric tons per annum |
| Full Ramp-Up Timeline | December quarter 2026 |
| Cost Profile | Higher cost relative to Mt Marion and Wodgina |
| Earnings Impact | Accretive, subject to cost containment |
Bald Hill carries a higher cost profile than MIN's other lithium operations. The mine's economic rationale depends on lithium prices holding sufficiently above its cash cost of production. The restart decision signals management confidence in the lithium price trajectory, but it also introduces margin dilution risk if costs prove higher than anticipated during ramp-up. Investors should monitor the December 2026 quarter operational update closely for evidence that the full-capacity target is being achieved within budget parameters.
Structural Demand: Beyond the Cycle
It is worth separating cyclical price recovery from structural demand growth when evaluating the long-term lithium thesis. Electric vehicle penetration continues to increase globally, and battery energy storage systems are increasingly being deployed at grid scale, creating demand streams that are largely independent of the automotive cycle. These two demand vectors create a structural floor beneath lithium consumption that underpins the long-run price forecasts cited above, even if near-term prices remain volatile.
Iron Ore and Mining Services: The Overlooked Earnings Foundations
Onslow's Structural Cost Advantage
The Onslow Iron project occupies a different competitive position from the company's legacy iron ore assets. Unlike older operations that lacked integrated rail and port infrastructure, Onslow was designed from the outset with lower unit economics in mind. The 4% average price improvement recorded in FY2026 is modest in absolute terms but matters because it was achieved against a backdrop of cautious China steel demand. Even a 1% improvement in realised iron ore price translates meaningfully to EBIT at MIN's production volumes.
Chinese steel producer demand remains the dominant macro variable for Australian iron ore. Infrastructure spending trends, property sector activity, and manufacturing output in China are the leading indicators investors should monitor alongside iron ore price futures. Furthermore, Onslow capacity expansion plans continue to underpin the longer-term volume growth thesis for this division.
Mining Services: The Defensive Earnings Floor
The mining services division is frequently undervalued in market analysis because its revenue model lacks the commodity price optionality that attracts speculative capital. However, this is precisely what makes it structurally important.
MIN's mining services business operates 12 crushing and screening plants across 12 sites under long-term contracts with major mining companies. Power is supplied by clients, margins are comparatively stable, and contract renewals have historically driven volume growth, creating a more defensive earnings base that partially insulates the group from commodity price volatility.
The division has historically contributed approximately 40% of group EBIT. With annualised EBITDA potentially approaching the A$1 billion threshold, mining services represents a near-infrastructure-quality earnings stream that deserves to be valued with a meaningfully lower discount rate than the lithium or iron ore divisions. That blended valuation complexity is part of why MIN's share price often struggles to reflect intrinsic value accurately.
Analyst Forecasts and the Valuation Gap
Consensus Earnings Trajectory
| Period | Earnings Estimate | Notes |
|---|---|---|
| FY2025 | ~A$400M | Post-lithium downturn trough |
| FY2026 | ~A$950M | Record volumes, price improvement |
| FY2027 | ~A$820M | Normalisation expected |
| Long-Run Growth | 10.1% p.a. (one estimate) | High forecast dispersion applies |
Warning: Different analytical frameworks produce materially divergent earnings growth trajectories for MIN, ranging from approximately 10% to over 58% per annum depending on lithium price assumptions and Bald Hill ramp-up scenarios. This dispersion reflects genuine uncertainty, not analytical error. Investors should apply independent judgement and treat any single forecast with appropriate scepticism.
The Valuation Case at A$58 Per Share
At a recent trading price of approximately A$58, MIN trades at a meaningful discount to a published fair value estimate of A$77 per share from Morningstar's equity research coverage. That implies potential upside of approximately 33% under that specific analytical framework.
The discount persists for identifiable reasons. The lithium price rout left deep psychological scars among investors who purchased MIN at elevated prices during the boom. Elevated debt levels, even after their material reduction, continue to concern investors who worry about balance sheet flexibility if commodity prices retreat again. The no-moat classification applied by some analysts reflects genuine uncertainty about MIN's ability to sustain above-cost-of-capital returns through the full commodity cycle.
The WACC adjustment to 9.0% from 8.7%, with a beta of 1.4, is a meaningful signal. A beta above 1.0 explicitly acknowledges that MIN's earnings are more volatile than the broader market, which is an honest reflection of the company's exposure to two highly cyclical commodities simultaneously.
The next major ASX story will hit our subscribers first
Bull Case vs. Bear Case: Stress-Testing the Outlook
The Bull Case
- Lithium carbonate prices recover toward USD 20,000/t by 2027 to 2028, driving significant earnings leverage
- Bald Hill ramp-up proceeds on schedule and within cost targets, adding accretive volume
- Mining services EBITDA approaches the A$1 billion annualised run-rate, providing earnings stability
- Net debt continues declining below A$4 billion, reducing the financial risk premium embedded in the share price
- EV adoption and grid-scale battery storage demand accelerates faster than new lithium supply can respond
The Bear Case
- Lithium prices remain below USD 10,000/t for an extended period, compressing margins at all three lithium operations
- Bald Hill restart costs prove materially higher than anticipated, diluting group-level margins
- Chinese economic weakness reduces iron ore demand and realised pricing
- Western Australian labour and input cost inflation re-emerges, pressuring mining services margins
- Elevated debt limits capital allocation flexibility if commodity prices deteriorate simultaneously across iron ore and lithium
Scenario Modelling: Lithium Price Sensitivity
| Lithium Price Scenario | Implied EPS Range | Debt Servicing Comfort |
|---|---|---|
| Bear: USD below 10,000/t sustained | A$1.50 to A$2.50 | Constrained |
| Base: USD 12,000 to 16,000/t | A$4.00 to A$5.50 | Manageable |
| Bull: USD above 20,000/t | A$6.00 to A$8.00+ | Comfortable |
Key Risks Investors Must Weigh
Geographic Concentration
MIN's operations are heavily concentrated in Western Australia, a jurisdiction with well-understood labour market tightness and input cost pressures. While WA's mining-friendly regulatory environment is generally constructive, cost inflation in periods of high commodity activity can erode the unit cost advantages that underpin MIN's competitive positioning.
Governance and Leadership Continuity
The chair and managing director have been with the business for decades and hold meaningful shareholdings, creating strong alignment with long-term shareholder value. However, long-tenured concentrated leadership structures can also represent succession risk if key personnel transition unexpectedly. This is a structural consideration for investors with long investment horizons.
Debt Trajectory as a Re-Rating Catalyst
The pace of net debt reduction may be the single most important variable determining whether MIN's share price closes the gap to fair value estimates over the next 12 to 24 months. A continued decline toward a Net Debt/EBITDA ratio below 1.0x would likely trigger a meaningful re-rating by removing the financial stress discount currently embedded in the share price.
What to Watch Over the Next 12 Months
Investors tracking the Mineral Resources earnings outlook should prioritise the following monitoring checkpoints:
- Bald Hill ramp-up progress toward the December 2026 quarter full-capacity milestone of 140,000 metric tons per annum
- Lithium carbonate spot price movement, with USD 15,000/t representing a key psychological and margin threshold
- Net debt reduction pace, particularly whether the 1.5x Net Debt/EBITDA ratio continues to compress through FY2027
- Mining services contract renewals and whether volume growth guidance is maintained or upgraded
- Onslow iron ore volume consistency, specifically whether the pattern of guidance outperformance is sustained
- Chinese steel demand indicators, including PMI data and infrastructure spending announcements as leading signals for iron ore pricing
Frequently Asked Questions: Mineral Resources Earnings Outlook
What is the current EPS forecast for Mineral Resources in FY2026?
Updated estimates place the FY2026 EPS at approximately A$5.24 per share, a 38% upgrade from prior forecasts, driven by record production volumes and improved lithium price realisations across the year.
Why did Mineral Resources restart the Bald Hill lithium mine?
Average lithium price achievement doubled in FY2026 relative to FY2025, making the economics of Bald Hill's restart viable. The mine is targeting full capacity of 140,000 metric tons per annum by the December 2026 quarter, though its higher cost profile relative to Mt Marion and Wodgina requires careful cost management.
What is the published fair value estimate for MIN shares?
Morningstar's equity research publishes a fair value estimate of A$77 per share for MIN, compared to a recent trading price of approximately A$58, suggesting the stock may be trading at a material discount to intrinsic value under that framework. This is not a guarantee of future returns.
How has Mineral Resources reduced its debt burden?
Net debt fell approximately 20% across FY2026 to A$4.3 billion, with the Net Debt/EBITDA ratio compressing from 5.9x to 1.5x, driven by stronger operating cash flows across all three business divisions.
What structural demand drivers support the long-term lithium price thesis?
Long-run lithium carbonate price forecasts above USD 20,000 per metric ton through 2033 are anchored to marginal production cost economics, supported by structural demand growth from electric vehicle adoption and grid-scale energy storage deployment.
Why do analyst forecasts for MIN vary so significantly?
High forecast dispersion reflects genuine uncertainty around the timing and magnitude of the lithium price recovery, execution risk in the Bald Hill ramp-up, and the sensitivity of iron ore earnings to Chinese demand conditions. No single forecast should be treated as definitive.
This article is intended for informational purposes only and does not constitute financial advice. Forecasts, valuation estimates, and scenario analyses involve inherent uncertainty. Past performance is not indicative of future results. Investors should conduct independent due diligence and consult a licensed financial adviser before making investment decisions. For additional equity research on ASX-listed resource companies, Morningstar Australia publishes institutional-grade analysis at morningstar.com.au.
Want to Catch the Next Major ASX Mineral Discovery Before the Market Does?
Discovery Alert's proprietary Discovery IQ model scans ASX announcements in real time, delivering instant alerts on significant mineral discoveries across more than 30 commodities — turning complex data into actionable investment opportunities for both short-term traders and long-term investors. Explore historic discoveries and their exceptional market returns, then start your 14-day free trial at Discovery Alert to position yourself ahead of the broader market.